Investors,
Congratulations to all of those who have trusted my views on disinflation since December 2022. I’ve been adamant that inflation will decelerate (even though prices are still rising), which is the definition of disinflation, and the incoming data has reaffirmed this outlook.
Notably, these are some of the newsletter titles related to disinflation that I’ve published since Dec.’22:
“Everything Falls, Including Inflation” - December 17, 2022
“The Fed Is Threading The Needle” - February 4, 2023
“Disinflation. Disinflation Everywhere!” - February 18, 2023
“Shelter Will Plummet… Here’s How I Know” - April 15, 2023
“Don’t Overcomplicate Disinflation” - May 13, 2023
“The Credit Crunch Is Choking Inflation” - June 17, 2023
While these have just been the titles of various articles I’ve posted over the past 8 months, I’ve been pounding the table on disinflation in as many newsletters as I can. If you’ve been incorrect on your assessment of where inflation was headed so far in 2023, I’d strongly recommend going back to read some of the newsletters above to sharpen your iron.
At this point, I’m completely bored by the debate around inflation vs. disinflation.
If you want to know why I’m no longer going to entertain these debates, I provided a full explanation on Twitter and also shared where I think inflation is going next (and why). You can read it here or click on the screenshot below:
Why has the trend of disinflation been so important to get right? Because asset prices thrive in a disinflationary environment. Given that the trend of disinflation became increasingly obvious in Q4’22, how have stocks performed since Q4? Remarkably well.
In fact, asset prices are trending higher across the board!
Industrial stocks are trading at new all-time highs. Consumer discretionary stocks are at new 52-week highs. The S&P 500 is at new YTD highs. The Nasdaq-100 is trading at its highest level in 18+ months. Communications stocks are at new YTD highs. Airline stocks are at new 52-week weeks. Semiconductors hit new all-time highs on Friday. Software stocks are at new 52-week highs. The Russell 2000 is up +9.7% YTD, on pace to double its average calendar year return. The Dow Jones had its highest daily close of 2023, up +9.8% since mid-March 2023. The Ark Innovation ETF ($ARKK) hit new YTD highs for 4 consecutive days this past week. Bitcoin hit new YTD highs on Thursday. Bitcoin-related equities have been hitting new YTD highs for the past month. All of the four major U.S. indexes are trading above their 200-day moving average, and their respective moving averages have a rising/positive slope.
All of this has occurred amidst a disinflationary environment, despite ongoing Fed rate hikes, less than ideal economic data, and a global growth slowdown.
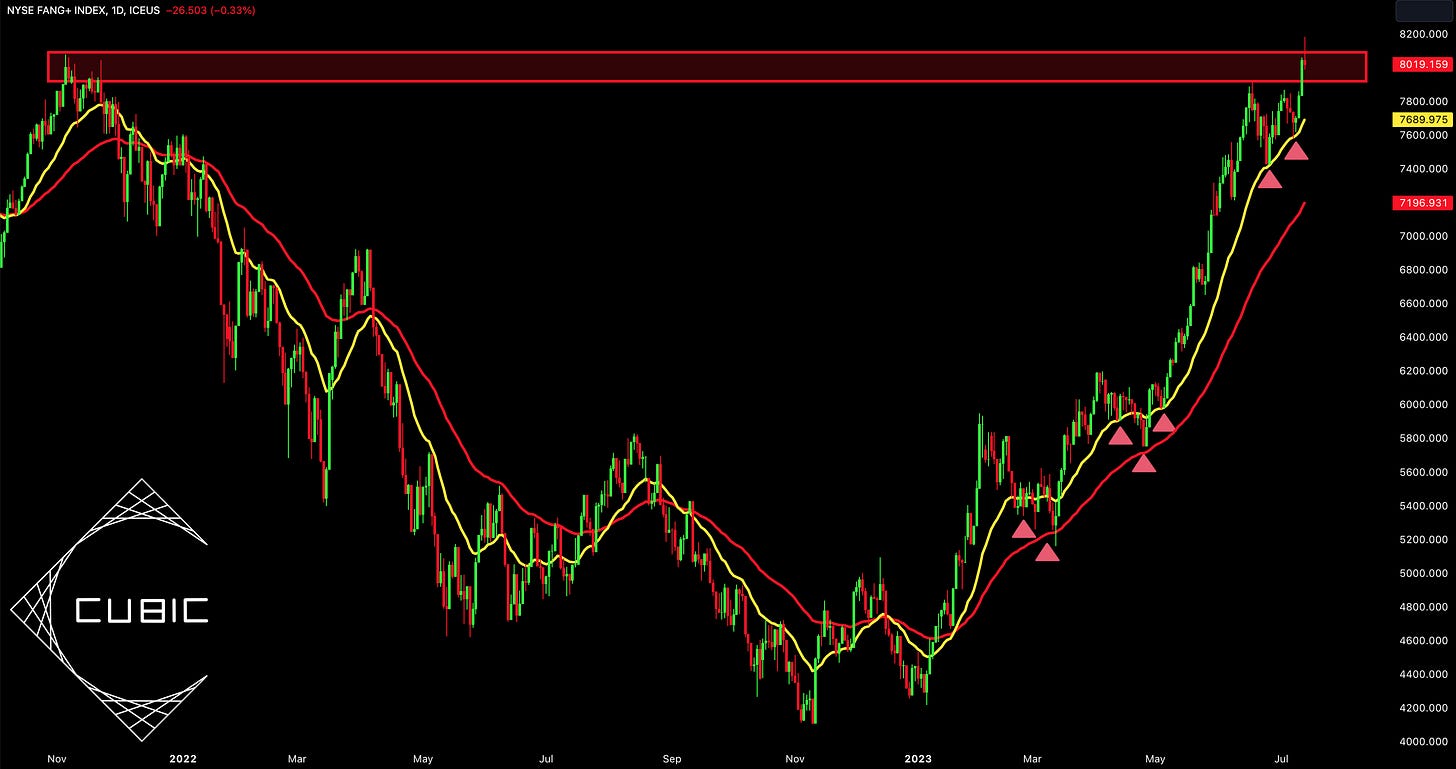
The MVP of the market, aka FANG+ stocks, hit new all-time highs on Friday!
Notice how $NYFANG has been riding the 21-day EMA & 55-day EMA higher all year? That’s extraordinarily bullish and a defining characteristic of an incredibly strong uptrend. If you don’t believe me, look at the market dynamics from Q2 2020 through Q1 2021 (one of the strongest & most significant uptrends in market history):
$NYFANG continued to grind higher and make new highs after retesting either of these key EMA’s. Even when these EMA’s lost some of their influence in the market after Q1’21, the NYFANG index managed to gain a total of +18% in 2021. Speaking of FANG, congratulations to everyone who has been riding this wave instead of complaining about how the best stocks in the world are grinding higher. I partnered with MicroSectors earlier this year, helping to highlight their unique FANG-related products, FNGU & FNGD.
FNGU, their 3x leveraged FANG ETN, is up +378% YTD and is easily one of (if not the) top performing ETF/ETN’s of 2023. Make sure to follow all of their updates on Twitter, where they post excellent market data and insights!
I know that we’ve already discussed a lot, but let’s dive into some rapid fire charts:
Macroeconomics:
As expected, the Shelter component of the CPI has peaked on a YoY basis and is now experiencing disinflation. The Shelter disinflation isn’t happening at a rapid pace, but I want to be very clear that I expect it to speed up in the months ahead.
The latest data from the June 2023 CPI showed that Shelter increased by +7.8% YoY, a moderate deceleration vs. the May 2023 result of +8.0%. Nonetheless, it’s clear that Shelter peaked on a YoY basis in March 2023, which is perfectly within the window of my prediction that it would occur between March & June 2023.
What about services, aka the lifeblood of the U.S. economy? Massive disinflation.
If we remove the Shelter component from services, we see the following:
In fact, at +3.2% YoY, we are back within the historic range of services inflation.
What about grocery prices? Massive disinflation.
What about alternative measures of broad-based inflation? Disinflation.
We just had the largest decline in YoY median CPI from one month to the next, yet people still refuse to acknowledge that inflationary pressures are subsiding. I’ll repeat:
Inflation has peaked. Prices haven’t.
With headline CPI falling to +3.0% YoY, core CPI falling to +4.8% YoY, and PPI falling to +0.1% YoY (yes, +0.1% YoY), I firmly believe that we will witness more disinflation in the months ahead and through the remainder of 2023.
All else being equal, this disinflationary environment will be accretive for asset prices.
Stock Market:
Stocks are on fire. They’re in an uptrend. I’m involved. I’m still managing risk.
This has been the theme of the year, implementing technical analysis to navigate the market, take profits, cut losses, and engage with the uptrend. So how am I going to manage risk going forward after such a strong week?
The Nasdaq-100:
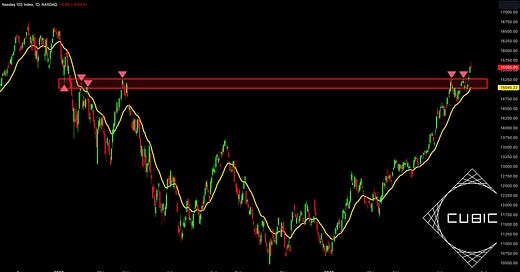
So long as the Nasdaq-100 stays above the red zone (February - April 2022 highs), I’m going to stay long equities in my trading account. If/when the Nasdaq-100 falls below the red zone, implying that it was a failed breakout, I’ll become more defensive and short-term bearish.
I’ve also added the 21-day EMA onto this chart to highlight how it’s trading within the red zone, likely to provide extra support if/when we retest this range. This range is so important because former resistance can act as future support. My belief is that a potential retest of this red zone will result in a rebound.
I had previously been sharing similar structure for the S&P 500, saying the following:
If S&P 500 $SPX stays above the Aug'22 highs, stay long.
If S&P 500 $SPX falls below the Aug'22 highs, trim.
Since then, SPX has flipped those former August 2022 highs into support and produced new YTD highs!
With the S&P 500 breaking away from this pivotal support level, it becomes harder to manage risk around that level because it requires a larger decline to fall below it. In the current market environment, I believe that the Nasdaq-100 will provide tighter risk management and I’ll be focused on the NDX primarily (not exclusively) as a risk management tool.
Bitcoin:
What’s there to say about Bitcoin, which is up +84% YTD and even hit new YTD highs this past week? Not much really.
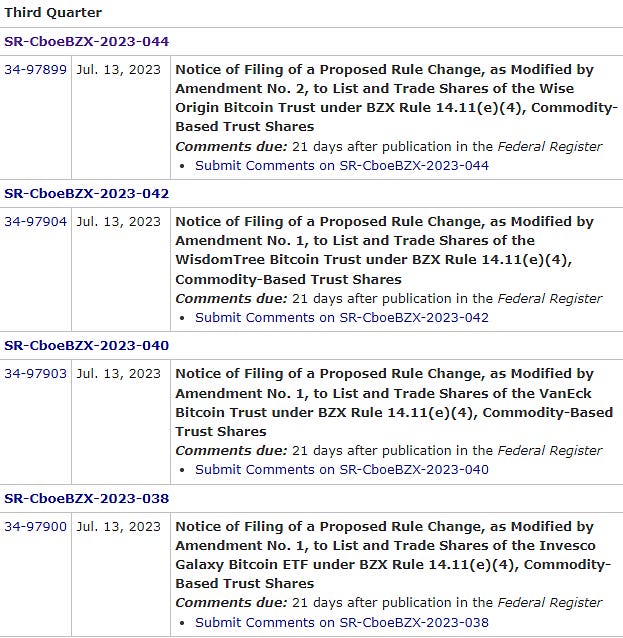
The SEC has officially acknowledged spot Bitcoin ETF’s from a variety of financial services companies, including: Fidelity, WisdomTree, VanEck, and Invesco.
Larry Fink, the CEO of the world’s largest financial services company, BlackRock, made optimistic comments about the sustainability of Bitcoin as a private monetary network & fiat alternative.
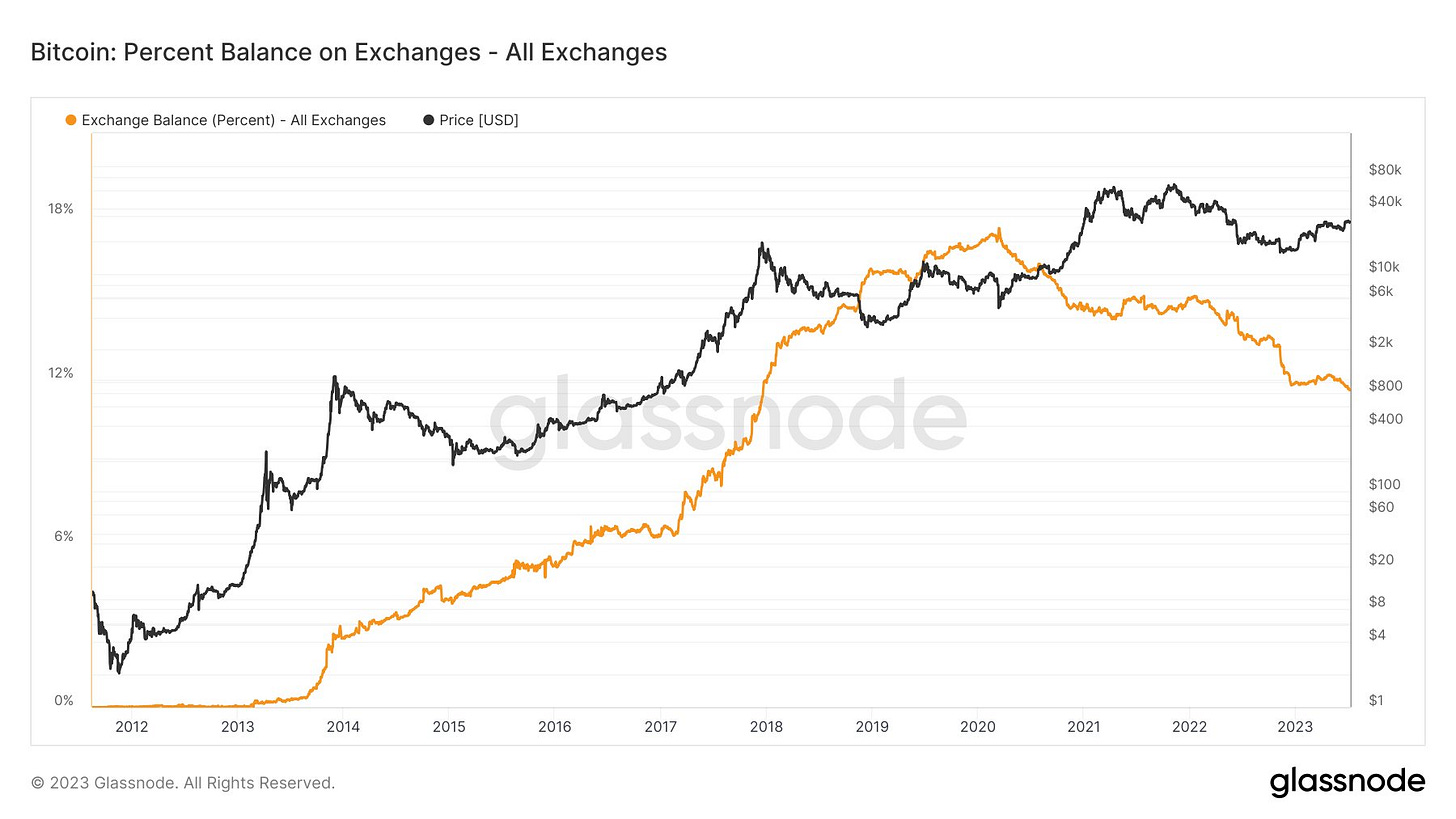
In terms of raw data, the following chart from Will Clemente stood out to me, highlighting how “11.5% of Bitcoin supply left on exchanges, lowest in over 5 years”:
With less and less Bitcoin available for sale on exchanges, any potential downward pressure on price should theoretically be stickier while upward pressure will be more exaggerated. The institutions are coming for our Bitcoin, but mine aren’t for sale.
Best,
Caleb Franzen
SPONSOR:
This edition was made possible by the support of MicroSectors, a financial services and investment company that creates an array of unique investment products and ETN’s. Their NYSE FANG+ products are the only one of their kind, allowing investors to gain exposure, leveraged/un-leveraged and direct/inverse, to the NYSE FANG+ Index. They have a suite of products ranging from big banks, to oil and gas, and even gold/gold miners.
I started a partnership with MicroSectors because I’ve been using their products for over a year and this was an organic and seamless fit with my views.
Please follow their Twitter and check out their website to learn more about their services and the different products that they offer.
DISCLAIMER:
This report expresses the views of the author as of the date it was published, and are subject to change without notice. The author believes that the information, data, and charts contained within this report are accurate, but cannot guarantee the accuracy of such information.
The investment thesis, security analysis, risk appetite, and time frames expressed above are strictly those of the author and are not intended to be interpreted as financial advice. As such, market views covered in this publication are not to be considered investment advice and should be regarded as information only. The mention, discussion, and/or analysis of individual securities is not a solicitation or recommendation to buy, sell, or hold said security.
Each investor is responsible to conduct their own due diligence and to understand the risks associated with any information that is reviewed. The information contained herein does not constitute and shouldn’t be construed as a solicitation of advisory services. Consult a registered financial advisor and/or certified financial planner before making any investment decisions.
This report may not be copied, reproduced, republished or posted without the consent of Cubic Analytics and/or Caleb Franzen, without proper citation.
Please be advised that this report contains a third party paid advertisement and links to third party websites. These advertisements do not constitute endorsements and are not necessarily representative of the views or opinions of the newsletter author. The advertisement contained herein did not influence the market views, analysis, or commentary expressed above and Cubic Analytics maintains its independence and full control over all ideas, thoughts, and expressions above. The mention, discussion, and/or analysis of individual securities is not a solicitation or recommendation to buy, sell, or hold said security. All investments carry risks and past performance is not necessarily indicative of future results/returns.


Thanks, as usual. Very informative.
Great post and great calls!