Investors,
There was an abundance of important economic data, stock market dynamics, and strength within the crypto market this past week. The purpose of these reports is to highlight the key aspects on my radar and to analyze the implications going forward. In today’s report, we’ll cover:
Disinflationary dynamics & recession signals.
Zoomed-out stock market trends & some stocks I’m buying.
Five critically important Bitcoin charts that are all flashing key signals.
These weekly versions of Cubic Analytics will continue to be free in attempt to provide maximum value to you as a member of the community. My only ask is that you either like the post or share it with a colleague, friend, or family member and help to grow the readership beyond the 4,180 of you who received this report.
Macroeconomics:
Wall Street was fervently attentive to inflation data this week, with the release of the Consumer Price Index (CPI) and Producer Price Index (PPI) for January 2023. With the strong progress (aka deceleration) that we’ve seen since mid-2022, investors were primarily hoping to confirm one thing: disinflation.
Disinflation, or a slower increase of inflation, was all that mattered in my opinion and it was the most probable outcome from my perspective:
Indeed, disinflation is exactly what the data showed us!
The January CPI increased at a year-over-year pace of +6.34%, down only slightly from December’s result of +6.5%. Estimates were more optimistic, predicting +6.2%, so the result came in hotter than anticipated. Nonetheless, disinflation is disinflation and we shouldn’t let perfect get in the way of good.
Core CPI also declined from +5.7% YoY in December 2022 to +5.5% in January 2023, another important win for disinflation, despite the rapid acceleration in the Shelter component of the CPI! Shelter is showing no signs of abating, increasing +0.7% MoM and +7.9% YoY (the fastest pace since June 1982). As I’ve voiced in the past, the lag effects of Owner’s Equivalent Rent (OER) vs. the actual housing/rental market will take 8-12 months to take effect. With the housing market peaking in June 2022, I don’t expect to see the Shelter component, which comprises 33% of the overall CPI weighting, to start decelerating until the March 2023 data, at the soonest.
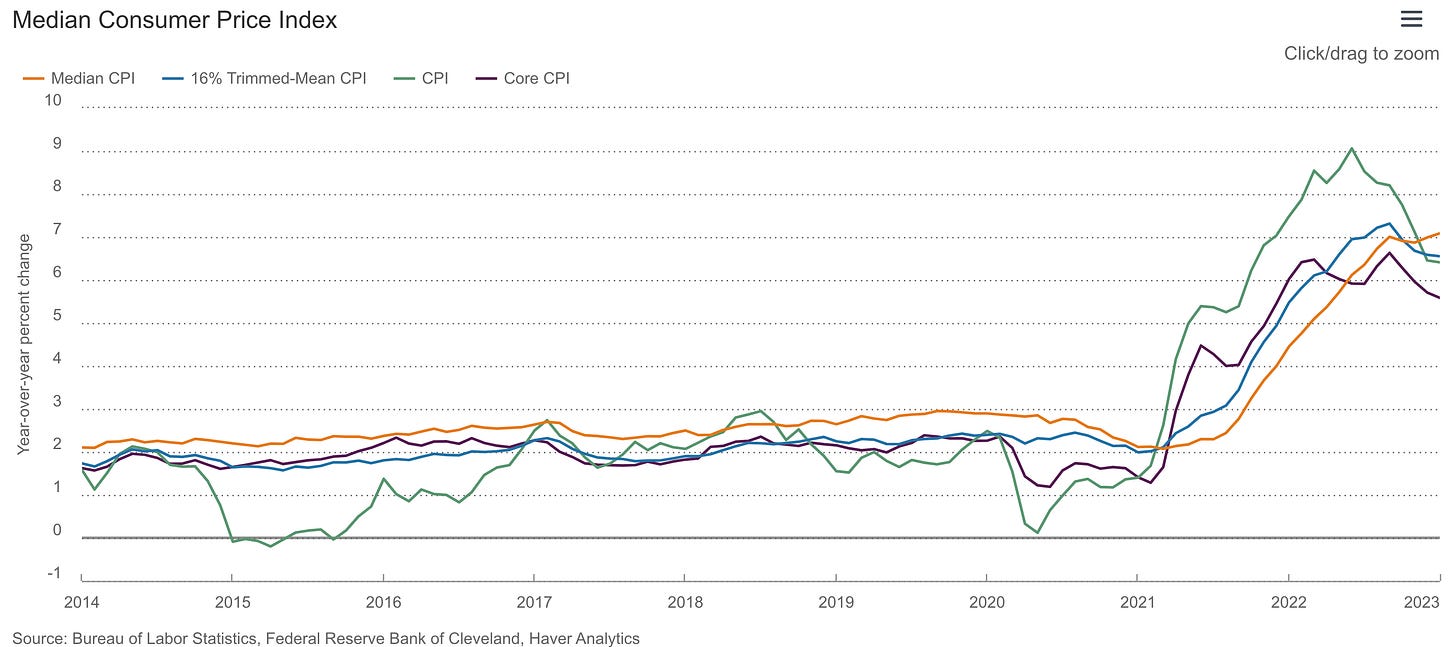
While the overall CPI data was hotter than expected, but still encouraging, there was one primary aspect that gave me some concern: median CPI re-accelerated (orange).
We don’t know if this is a one-off acceleration, or if it will continue to decline lower in the months ahead; however, I will continue to watch this specific datapoint like a hawk. Without giving it too much attention, largely because it doesn’t deserve much in my opinion, the Producer Price Index confirmed the exact same dynamics we saw in the CPI data. The result was hotter than expected, but still disinflationary.
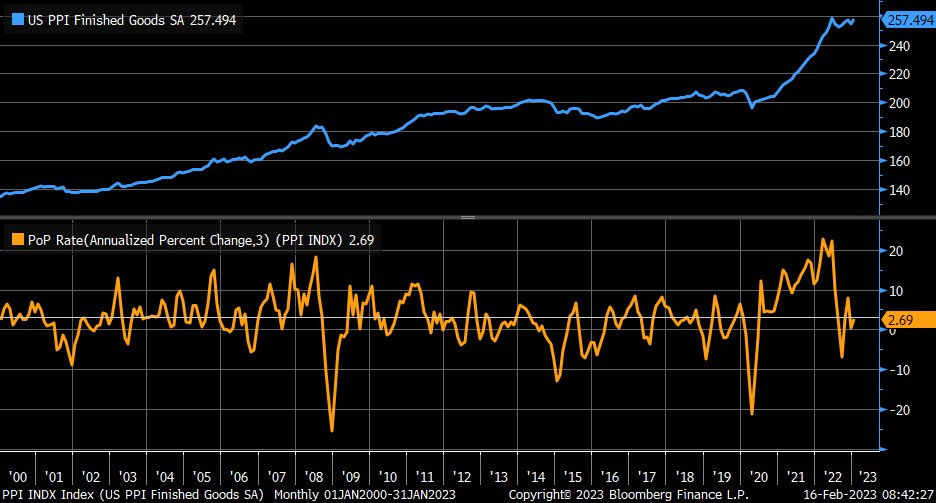
The headline PPI for January 2023 increased +0.7% MoM and +6.0% YoY, vs. +6.5% YoY in December 2022. Admittedly, the MoM increase was the fastest since the June 2022 result of +0.9%. This could be a sign of concern going forward, but we’re continuing to see disinflationary dynamics on a YoY basis for consumer & producer prices. Smoothing out the data over the past three months, the following chart from Liz Ann Sonders helps to contextualize the trend for PPI by calculating the 3-month annualized inflation rate for producer prices:
At +2.7%, this is in the normal range of historic inflation trends over the past 20+ years.
Ensuring that we continue to see disinflation in the months ahead will be an important accomplishment to confirm that inflationary pressures are normalizing. Would it imply that the pressures are gone? No. However, it would indicate that they’re improving, and that’s what matters right now.
Regarding forward-looking economic data, the Conference Board’s Leading Economic Indicators reflected a decline of -0.3% in January 2023 vs. -0.7% in December 2022. This was one of the main datapoints that I provided in my 2023 outlook, which supported my overall thesis that the U.S. economy is likely to enter a recession this year. On a rolling 6-month basis, the LEI has fallen -3.6% vs. the 6-month pace of -2.4% in December 2022. Overall, this data is continuing to suggest that the U.S. economy is deteriorating and that a recession is probable. It’s important to remember that this specific indicator has correctly predicted the past three recessions, even though backward-looking data like retail sales showed an improvement in January by growing +3.0% month-over-month.
Stock Market:
The market reaction to incoming economic data this week was particularly strong, with investors using each sign of weakness as an opportunity to increase their appetite for risk. We saw the riskiest segments of the market lead the way higher this week, with notable gains in technology & long-duration growth stocks.
There’s no better way to illustrate this dynamic than comparing these two weekly returns:
Dow Jones Industrial Average -0.13%
Ark Innovation ETF +6.93%
The riskier the asset, the better it performed this past week.
I took a moment on Twitter to reflect on broader market dynamics that we’ve witnessed over the past 14 months, which I’d like to expand on:
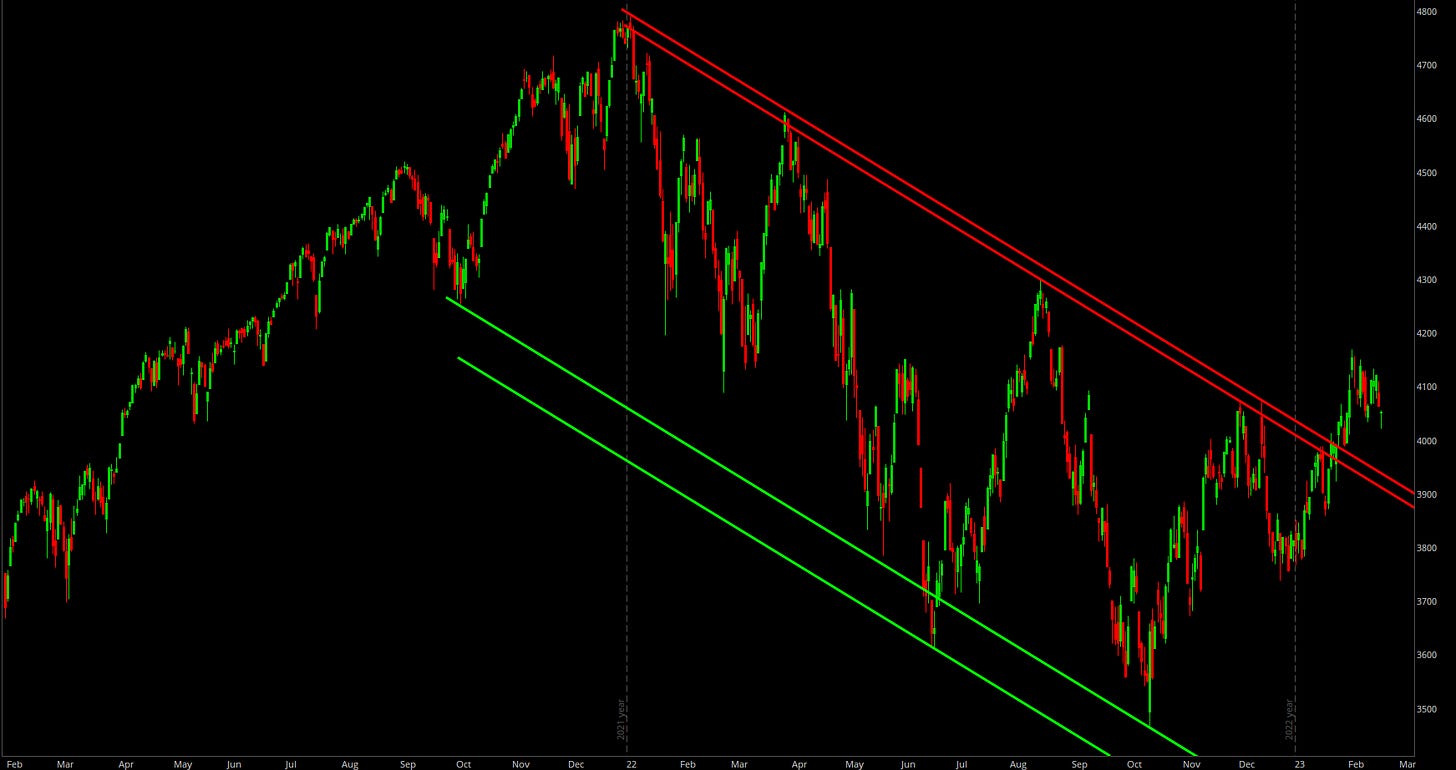
The S&P 500 entered a bear market (down at least -20% from highest 52-week close) on June 13, 2022. However, the “bear market” status didn't last long, as the index rallied +18% from mid-June to mid-August 2022. The escape from the bear market similarly didn’t last very long, with the index re-entering a bear market in September and hitting new lows in October. Just when the future about the U.S. economy & the overall market reached its bleakest, the market has ripped higher since then. From the bear market lows on 10/13/22, the S&P 500 has gained +16.85% through Friday’s close.
Market dynamics can be categorized as:
An orderly decline
A brief bear market
Large relief rallies
In the grand scheme of things, the index is trading at the same level as May 2021! Even at its lowest point in 2022, the index was valued at the same price as it was in November 2020.
Currently, the index is down -14.9% from the ATH daily close on 1/4/22. The reality is, that’s normal behavior for the stock market. The Dow Jones is only down -8% over that same timeframe. Based on where we stand today, it appears that the market was actually much less hectic than it felt in the moment. For example, the VIX couldn't stay above 30 for a meaningful amount of time and we never saw a spike in volatility congruent to historical market selloffs or capitulation events.
Maybe that capitulation event doesn't come – we don't know.
The ongoing market rally is reminiscent of market dynamics that we saw from June through August 2022, both in terms of causal factors (extreme negative positioning, disinflation, and “peak” Fed hawkishness) and magnitude. From the June 2022 lows to the August 2022 peak, the index rallied as much as +18.8%. During the current rally, the index has gained as much as +20%. While the current rally hasn’t occurred as quickly as it did in mid-2022, the market is celebrating for the exact same reasons.
The question we must ask ourselves is: “will it fall for the exact same reason?”
Investors have celebrated peak inflation & peak Fed hawkishness, only to be faced with the realization that the Federal Reserve isn’t done tightening and that there’s still more work to be done. With hotter-than-expected inflation, a resilient & dynamic labor market, and surprisingly strong retail sales in January, the Fed has a green light to keep raising rates. Even if those increases are modest +0.25%, economic data suggests that the Fed isn’t done. Thus far, investors have shrugged off this realization and have been unfazed by the resurgence of “higher for longer”. This is a stark contrast vs. the market’s reaction to “higher for longer” in August, which is notable.
I'm still buying core portfolio holdings, but I'm also reducing my exposure to the tech/growth aspects of my portfolio and rotating into slightly more defensive names. Notably, I’ve been buying the following:
Brookfield Corporation BN 0.00%↑
Alphabet GOOGL 0.00%↑
Extra Space Storage EXR 0.00%↑
Digital Realty Trust DLR 0.00%↑
Republic Services Group RSG 0.00%↑
Tomorrow, I’ll be sharing a new investment idea with premium members that I’m excited to divulge…
With cash still being the largest holding in portfolios that I manage, I’m still positioned defensively with enough exposure to benefit if the market is able to keep grinding higher from here. Eventually, there will be another pullback and I will continue to be opportunistic by steadily increasing my ownership of core portfolio holdings over time. Investing is a marathon, not a sprint.
Bitcoin:
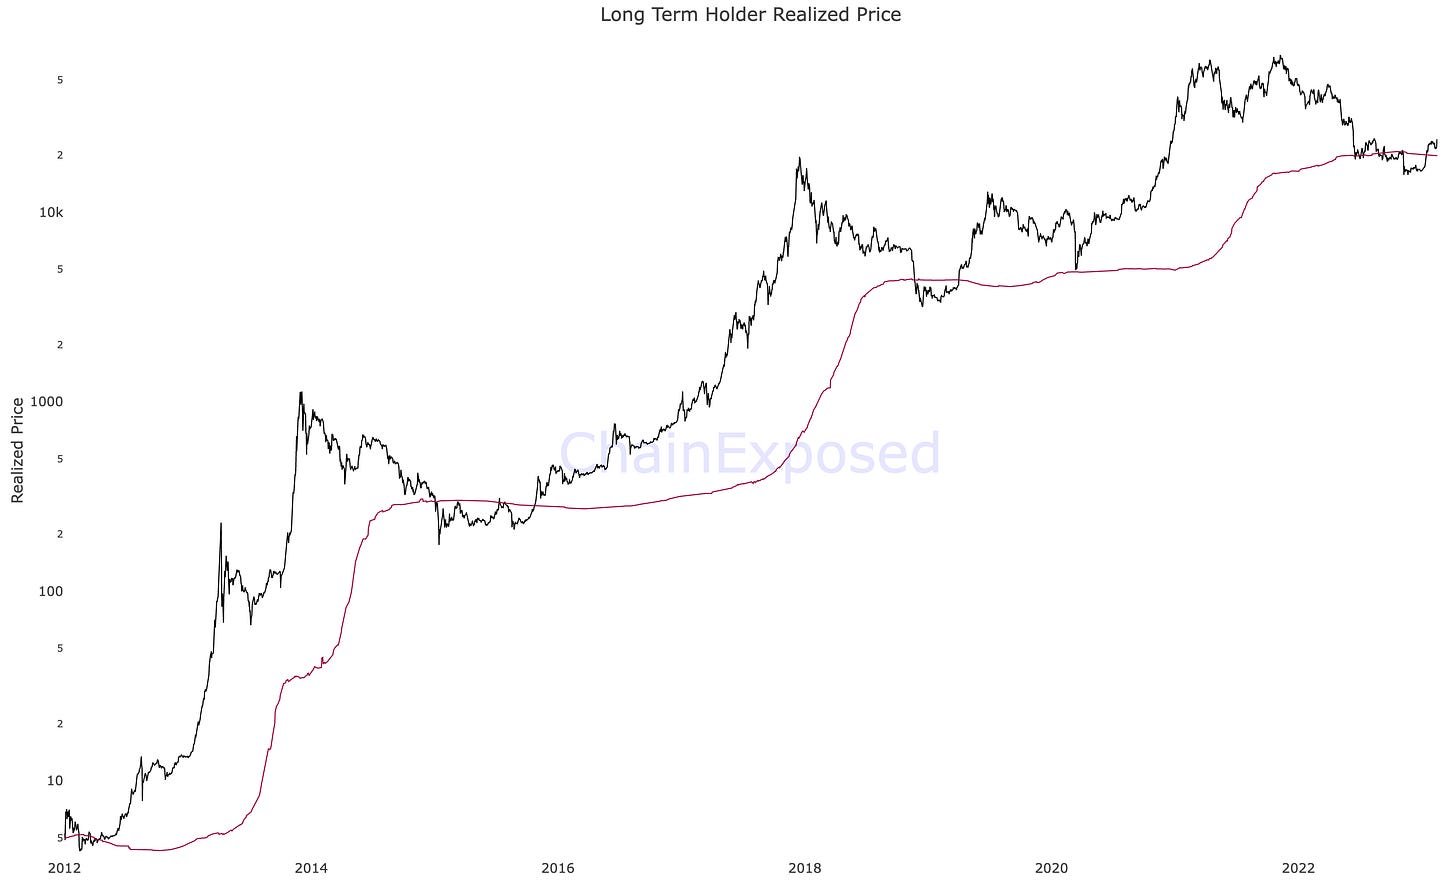
As mentioned above, the riskier assets performed the best this week. Relative to the prior Friday’s close through 4pm ET this Friday, BTC gained +13.6%. Bitcoin continues to remain above three important “lines in the sand”:
1. The 200-day exponential & simple moving average
2. The short-term holder realized price
3. The long-term holder realized price
In and of themselves, each of these indicators & dynamics are reflecting bullish behavior. We have long-term indicators, like the 12-month Williams%R oscillator and the first monthly Heikin Ashi candle that has also signaled an end to the bear market. At this point, I’m still waiting for two major signals to add more bullish fuel to the fire:
1. The price of Bitcoin breaking above the 200-week moving average cloud: Both the EMA & SMA are essentially equivalent at ~$25,000 vs. a price of $24,576 at the time of writing. BTC was rejected on this dynamic range for the first time in August 2022 and was briefly rejected on this level earlier in the week. While it be able to break above on this second attempt?
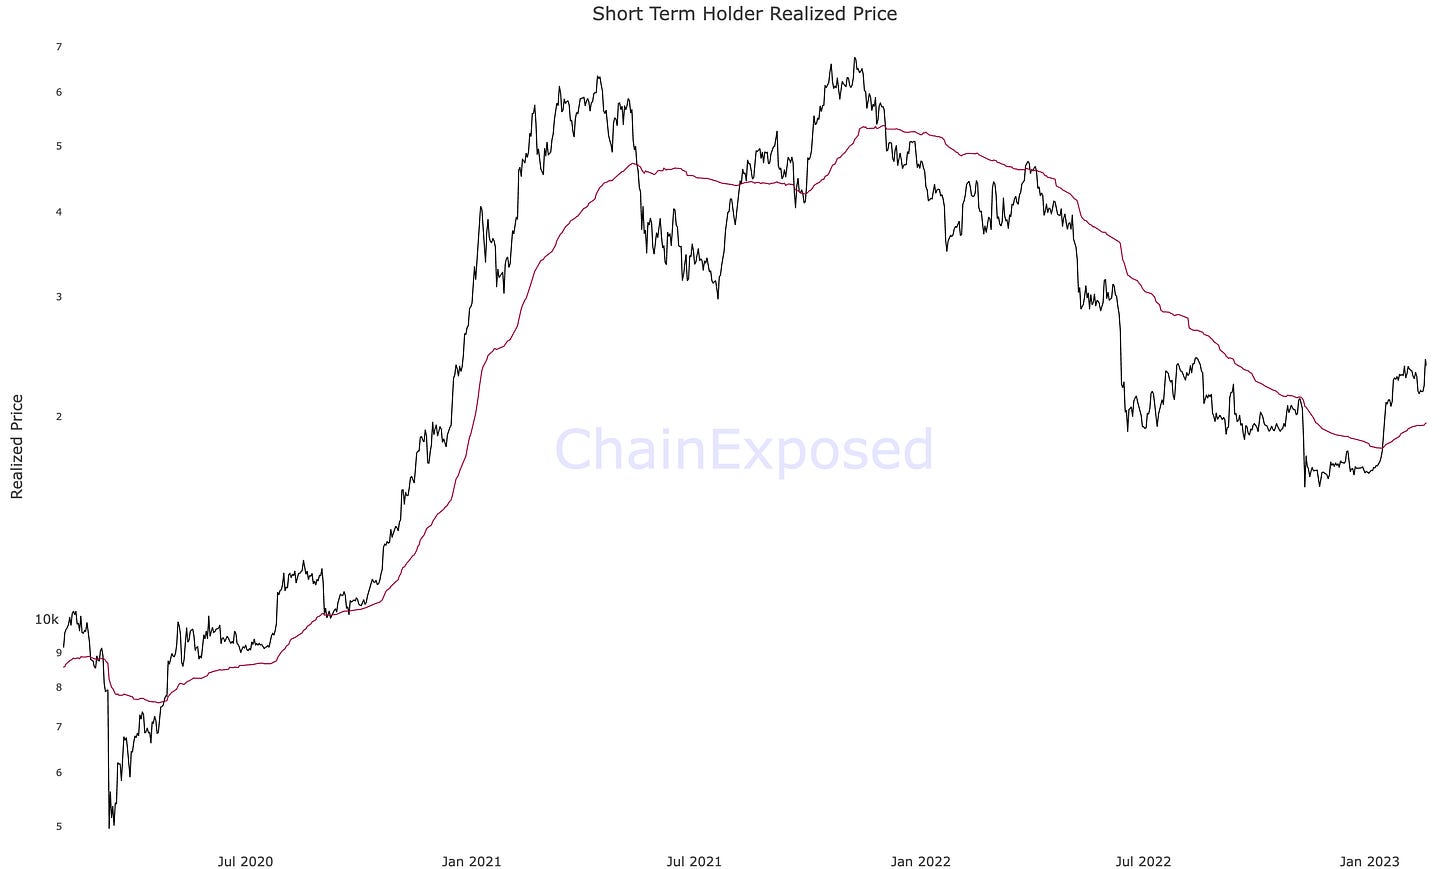
2. Short-term holder realized price > long-term holder realized price: Combining two of the three signals above, we can simply measure the relationship between the STHRP and LTHRP. Historically, bear markets are characterized by STHRP < LTHRP while bull markets are characterized by STHRP > LTHRP. At the present moment:
STHRP = $19.45k
LTHRP = $19.9k
This crossover could reasonably occur within the next few weeks to a month, or maybe longer depending on overall market dynamics. The chart below from Will Clemente highlights the bullish signal that is produced once this crossover occurs:
It’s hard to ignore the significance of each of these individual datapoints & signals; however, the cumulative signal from all of them flashing simultaneously is going to be impossible to ignore. We’re not there yet, but it could happen in the blink of an eye.
Best,
Caleb Franzen
DISCLAIMER:
This report expresses the views of the author as of the date it was published, and are subjected to change without notice. The investment thesis, security analysis, risk appetite, and time frames expressed above are strictly those of the author and are not intended to be interpreted as financial advice. As such, market views covered in this publication are not to be considered investment advice and should be regarded as information only. Everyone is responsible to conduct their own due diligence, understand the risks associated with any information that is reviewed, and to recognize that the information contained herein does not constitute and should be construed as a solicitation of advisory services. Cubic Analytics believes that the information & sources from which information is being taken are accurate, but cannot guarantee the accuracy of such information.
This report may not be copied, reproduced, republished or posted without the consent of Cubic Analytics and/or Caleb Franzen, without proper citation & reference.
As always, consult a registered financial advisor and/or certified financial planner before making any investment decisions.





What are your thoughts on the #bigflip narrative I keep seeing on Twitter, basically that (ironically) disinflation is transitory, and that inflation will roar back and that the real bear market hasn't really started?
https://twitter.com/INArteCarloDoss/status/1623253168678109185?t=G4YVjkJBCJgpaT_9ahoveA&s=19
https://twitter.com/INArteCarloDoss/status/1623019667026595840?t=yRode2p5DWneM9GSeIzVHQ&s=19
Very informative! Great analysis and explanation. Thank you!