Don't Overcomplicate Disinflation
Investors,
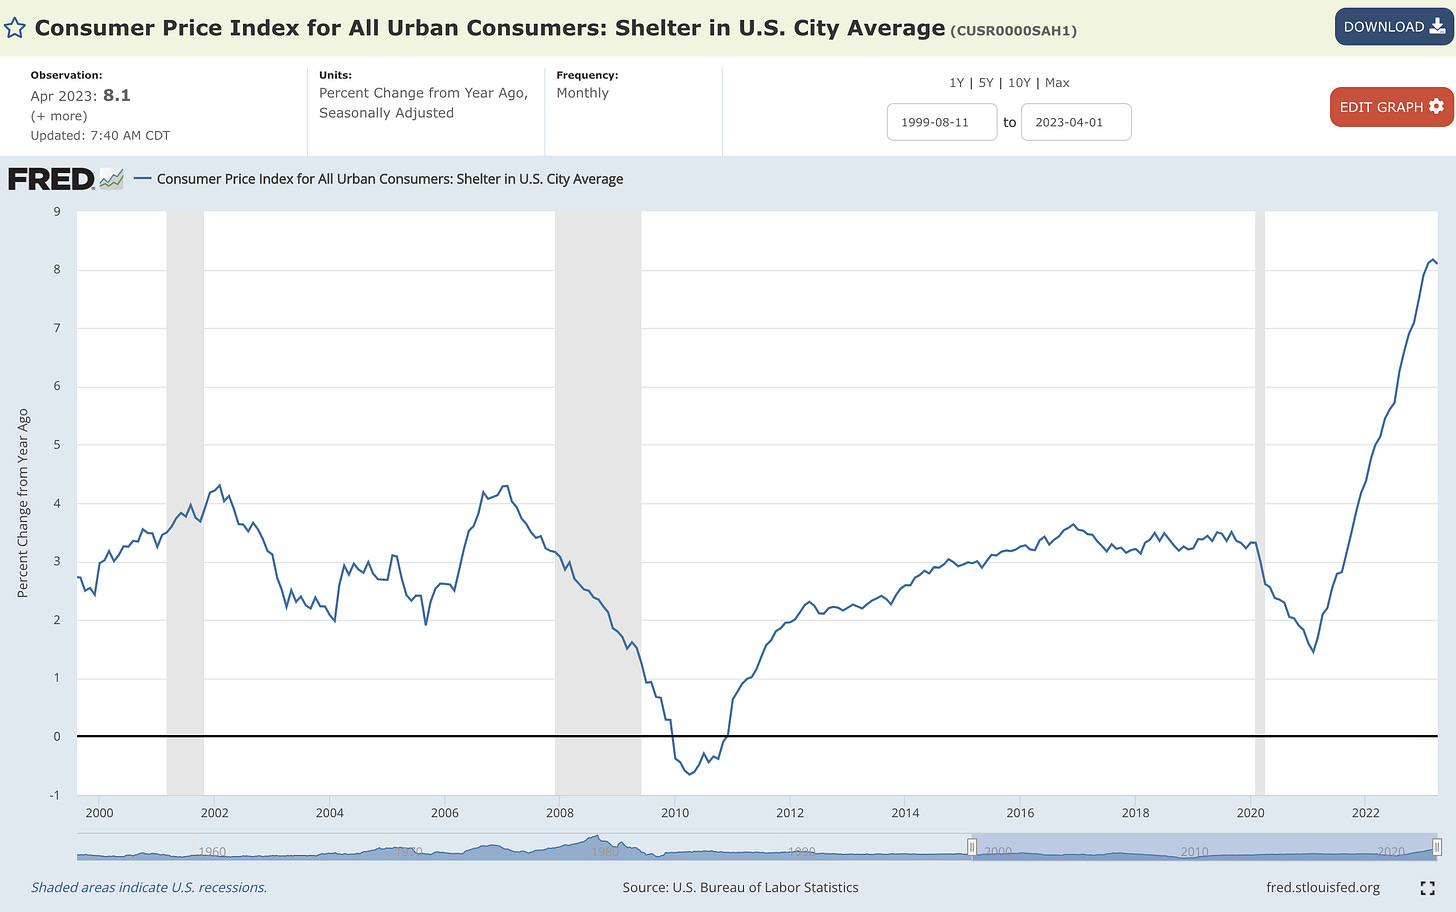
Inflation continues to decelerate, reaffirming my belief over the past 6 months that the U.S. economy will experience disinflation. The most substantial driver of my thesis was the expectation that the Shelter component of inflation would roll over between March 2023 and June 2023 data, which we now have evidence of in the latest CPI data for April 2023.
While this was a modest deceleration from +8.2% to +8.1% YoY, I expect to see more substantial declines in the months ahead, which will dramatically accelerate the ongoing trend of disinflation in headline CPI data. This is the first deceleration in YoY Shelter inflation since February 2021, which was then followed by a non-stop acceleration for 24+ months, despite the fact that the national real estate market peaked in June 2022.
It’s extremely important to remember the following:
Why have I been so confident in my outlook for disinflation? Recall the ideas that I shared in March, outlining the following macro dynamics:
“Energy prices are falling at an accelerated pace, producing outright deflation on a YoY and MoM basis.
YoY disinflation is well-underway, despite the continued acceleration of the Shelter component (33% of the CPI weight).
The Shelter component (OER) lags the housing/rental market by 8-12 months. What happens when Shelter starts to decelerate around June 2023? Hint: even faster disinflation.
YoY base effects will reduce the speed of YoY inflation, particularly as we approach June 2022 YoY comps.
Nominal wage growth is still high (good!), but decelerating.
Commercial loan growth is still high, but decelerating.
Supply chain pressures have evaporated.
The initial spending boom from pent-up demand is realistically behind us.
Rate hikes haven't had their full impact on the system (yet).
The inverse wealth effect takes time.
Peak fiscal & monetary stimulus are far in the rearview mirror.
Student loan payments will resume soon.
Gov't healthcare benefits will expire soon.
Fundamental uncertainties are rising, likely causing consumers to become more defensive or less amenable to spend frivolously.”
In this edition of Cubic Analytics, I’ll provide a thorough analysis on the following:
The key inflation data you need to know and what it means going forward.
Why leadership from the best/largest stocks in the world is actually bullish.
Reaffirming my bullishness on Bitcoin and the critical levels for bulls to defend.
But first, I’d like to thank the teams at MicroSectors and REX Shares for sponsoring this edition of Cubic Analytics. Their gold-related products have been extremely useful for me lately, as I currently own $GDXD, the 3x inverse gold miners ETN, which gained +15% this past week. They also have ETN’s tied directly to the performance of gold, which you can review in the thumbnail and link below:

Macroeconomics:
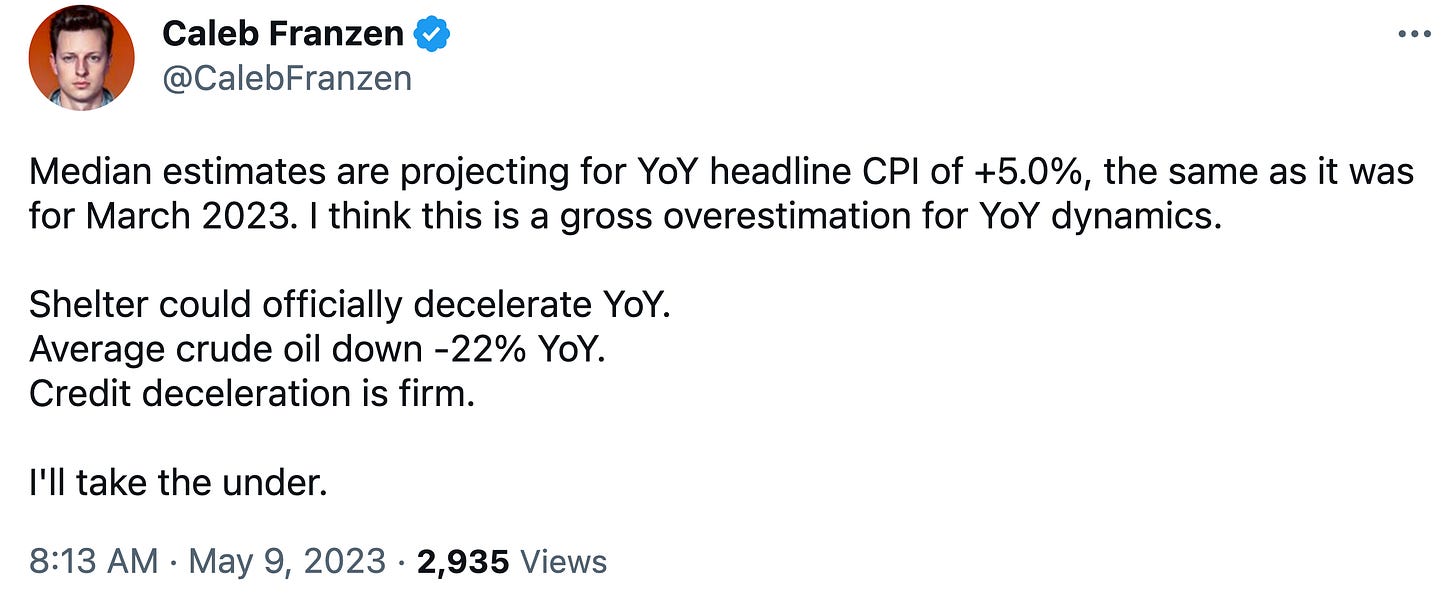
Just prior to the release of the April 2023 CPI data, median estimates were projecting for a YoY headline inflation rate of +5.0%. Recall, the prior month result was +5.0% after falling from +6.0% in February 2023, so analysts were expecting a stagnant YoY inflation rate. I thought this was a “gross overestimation” of inflation and posted the following on Twitter :
While I personally expected for the result to come in at +4.8% YoY, the result of +4.9% was an important win. Month-over-month figures remained hot, but were perfectly in line with estimates of +0.4%. The YoY change in Core CPI, which excludes food & energy prices (providing a less volatile version of inflation trends), was +5.5% and also came in lower than the prior month.
These surface-level datapoints are solid, but they weren’t amazing. Still, a win is a win.
However, when we look at the internals of the CPI data, I think there’s a tremendous amount to be encouraged by. Typically, the saying goes “the devil’s in the details”, but that doesn’t apply to the recent CPI data:
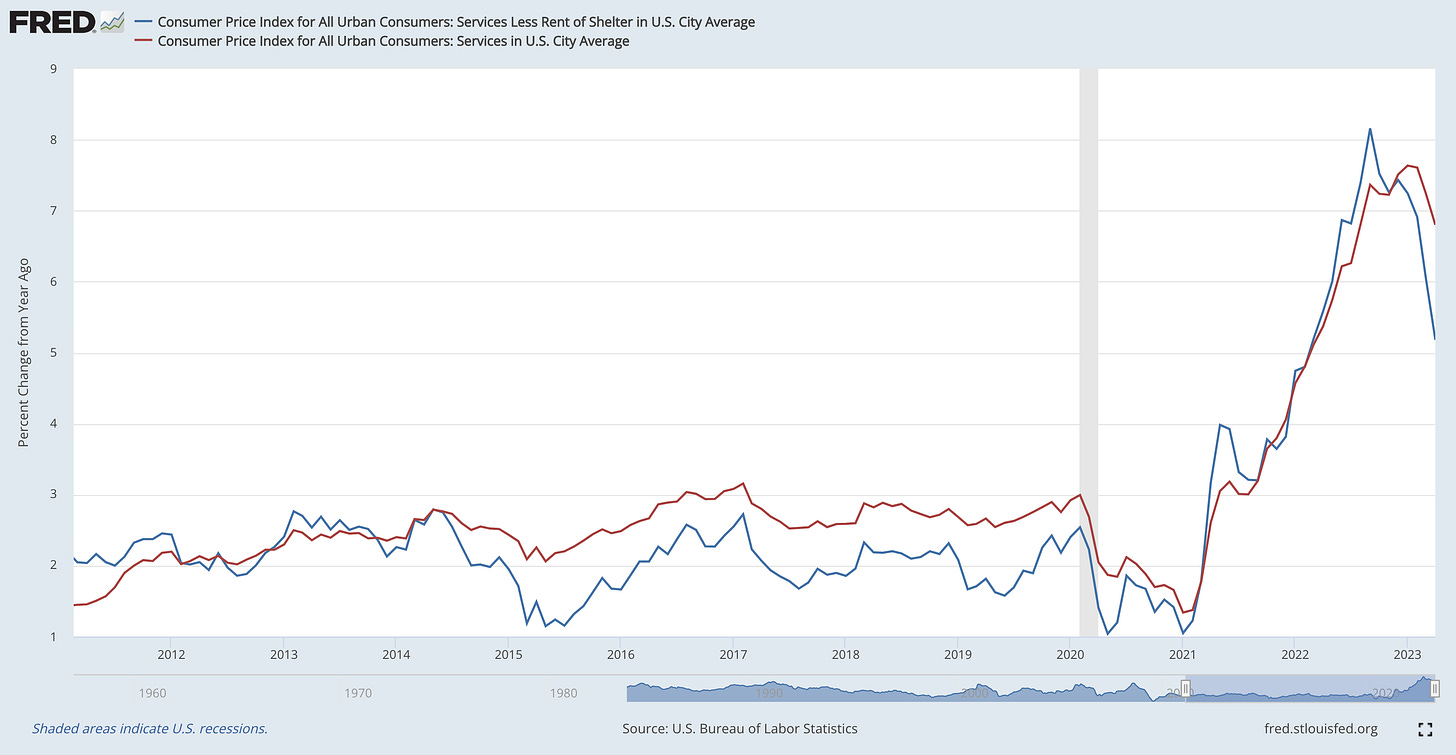
1. Services excluding Shelter is decelerating rapidly: The chart below compares the YoY inflation rate of Services ex-Shelter (blue) vs. Services (red). Considering that Shelter comprises a significant portion of the overall CPI weighting (and therefore even more of the Services aspect of CPI), the ex-shelter data is vital to assess the overall trend of service-related prices within the U.S. economy. Without question, it’s decelerating and nosediving at a rapid pace, sooner and faster than overall Services.
Inflation for services ex-Shelter was +5.18% YoY in April 2023 vs. +6.05% in Mar.’23.
With Shelter officially showing signs of a deceleration, I think that YoY pace of Service inflation is poised to decelerate expeditiously.
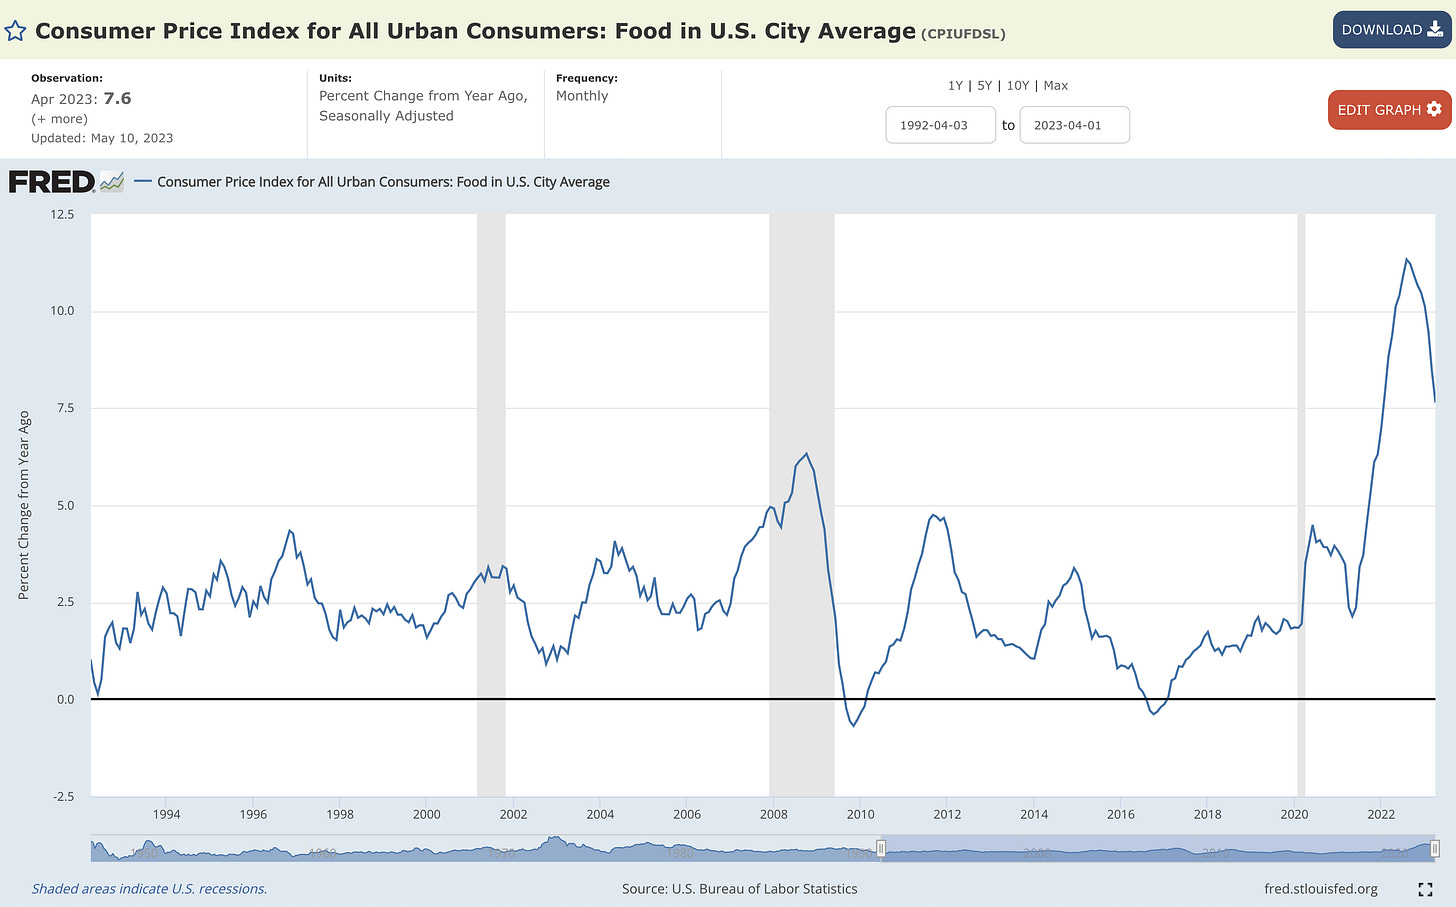
2. Inflation for Food is still high, but normalizing: I’ve been laser-focused on food inflation, because it represents a significant portion of expenses for Americans. Thankfully, after reaching historic highs, Food CPI is trending lower on a YoY basis.
Is it still too high? Absolutely.
Am I encouraged about where food inflation will be in the next 3 months? Absolutely.
Considering that food-related inflation peaked at +11.33% in August 2022, the current rate of +7.6% is indicative of great progress. I fully acknowledge that more progress needs to be made, but my outlook of consumption trends and the nature of inflation to partly be a psychological phenomenon gives me confidence that price pressures will abate. On a month-over-month basis, food price inflation has been +0.014% and +0.024% for the last two months (March & April 2023).
3. All of the broad measures of inflation are decelerating: While median CPI can more appropriately be described as stagnating in recent months, we did see a formal deceleration in each of the four broad-based measures of CPI on a YoY basis.
Notably, median CPI fell from +7.08% YoY in March to +6.98% in April while trimmed-mean CPI fell from +6.17% YoY to +6.07% in April.
On the aggregate, CPI data reflects strong underlying trends with broad-based disinflation. Some of the key components are decelerating at a substantial pace, firmly suggesting that disinflation is the current status of inflation in the United States. While we can criticize the somewhat underwhelming pace of disinflation for the latest data, I think investors should be careful to underestimate the disinflationary forces that are underway and simply celebrate the ongoing trend. The fact of the matter is, the recent decline in YoY CPI inflation is much better than a re-acceleration.
Take it or leave it.
Moving away from CPI data and turning to the wholesale measure of inflation, the Producer Price Index is plummeting at an even more rapid pace. PPI for April 2023 came in at +2.3% YoY, down significantly vs. the peak in March 2022 at +11.59%. It’s no secret that producer prices can ripple through to consumer prices, and there’s concrete evidence to suggest that CPI lags PPI by a few months.

With PPI roughly equivalent to the Fed’s target of +2.0% inflation, hard data suggests that CPI is going to decelerate rapidly over the coming months! Particularly given that the effective federal funds rate (5.08%) is now decisively greater than the YoY headline CPI (4.9%), I think that disinflation will become more entrenched in the months ahead.
Once again, I reiterate my expectation for disinflation going forward and I’m starting to see an increasing risk of outright deflation, particularly given ongoing stresses in the banking system and the potential for a broad-based economic downturn.
Stock Market:
Stocks were relatively choppy this past week, in light of more concerns about regional banks and Fed rhetoric that signaled more rate hikes, but they didn’t have a bad week by any stretch of the imagination. The S&P 500 $SPX closed down -0.3%, while the Nasdaq-100 gained +0.62% and continued to hit new YTD highs in four of the five trading sessions.
As I discussed in last week’s premium edition, the leadership from the largest (and therefore most important) stocks in the stock market has the potential to “put the team on their back” and carry the market higher.
I love to use basketball as an analogy for the market, so humor me with the following:
Imagine an NBA team with LeBron James, Kevin Durant, and Steph Curry on it, where these three players average a total of 90 point per game (PPG). The entire rest of the team only averages 30 points, totaling 120 PPG, and the team outscores their opponents by an average of 10 PPG. The team wins a lot of games.
Basketball pundits on TV then go out and criticize the team by focusing on the relative lack of production from the other players, despite the fact that the team has the best record in our imaginary league. These critics argue that the team will fail and that it’s not good for the best players in the world to be this dominant.
Instead, these critics are optimistic on another team that has a bunch of role players and no ball-dominant leading scorer or superstar(s). This team, with only a slight winning record, averages 110 PPG and is touted for its balance.
I think this analogy is so fitting because an inequality in performance is not necessarily bad, in and of itself, so long as the top-performers can execute at a high level. While these players could have a bad game, they account for 75% of their teams total points and have produced our league’s best record. They have a track-record of success and have clearly exhibited an ability to perform & deliver results.
And critics want to doubt them, or criticize their ability to perform? That’s asinine!
In this comparison, Apple, Microsoft and Alphabet (Google) are the equivalent of the NBA superstars, with their team being the S&P 500 or the Nasdaq-100. The team preferred by the critics is the Russell 2000, comprised of a diversified basket of companies that isn’t weighted heavily to any individual stock. Alternatively, the Russell 2000 could be swapped for the equal-weight basket of either the S&P 500 (RSP) or the Nasdaq-100 (QQQE).
Over the past month, these three MVP’s have generated the following returns:
Apple Inc. ($AAPL): +7.8%
Microsoft Corp ($MSFT): +8.97%
Alphabet Inc. ($GOOGL): +12.35%
The MVP’s of the market are delivering! While that may not be a complete reason to be bullish or optimistic on the market, it’s a terrible defense being used to support a bearish outlook. In 2022, the MVP’s of the market performed terribly, contributing to a terrible market environment. With MVP’s performing at tip-top shape in 2023, I think investors should view this development as a more preferred scenario.
The best of the best are doing exactly what we’d expect them to, and somehow this is being interpreted as bearish? I’d encourage you to avoid this perspective at all costs.
There’s a reason why I encouraged investors to be opportunistic on mega-cap tech in the second-half of 2022, highlighting how the best companies in the world had lost 30% to 50% of their market and were on sale. You can refer to the comments that I shared with Julia La Roche in August 2022 below:
Bitcoin:
With respect to the crypto markets, we’re seeing pullbacks across the board after the meme-bubble mania. The ridiculous explosion of “memecoins” is often considered a late-stage occurrence within a crypto rally, so many of the veterans in the crypto ecosystem haven’t been surprised to see Bitcoin and all other cryptocurrencies decline over the past week.
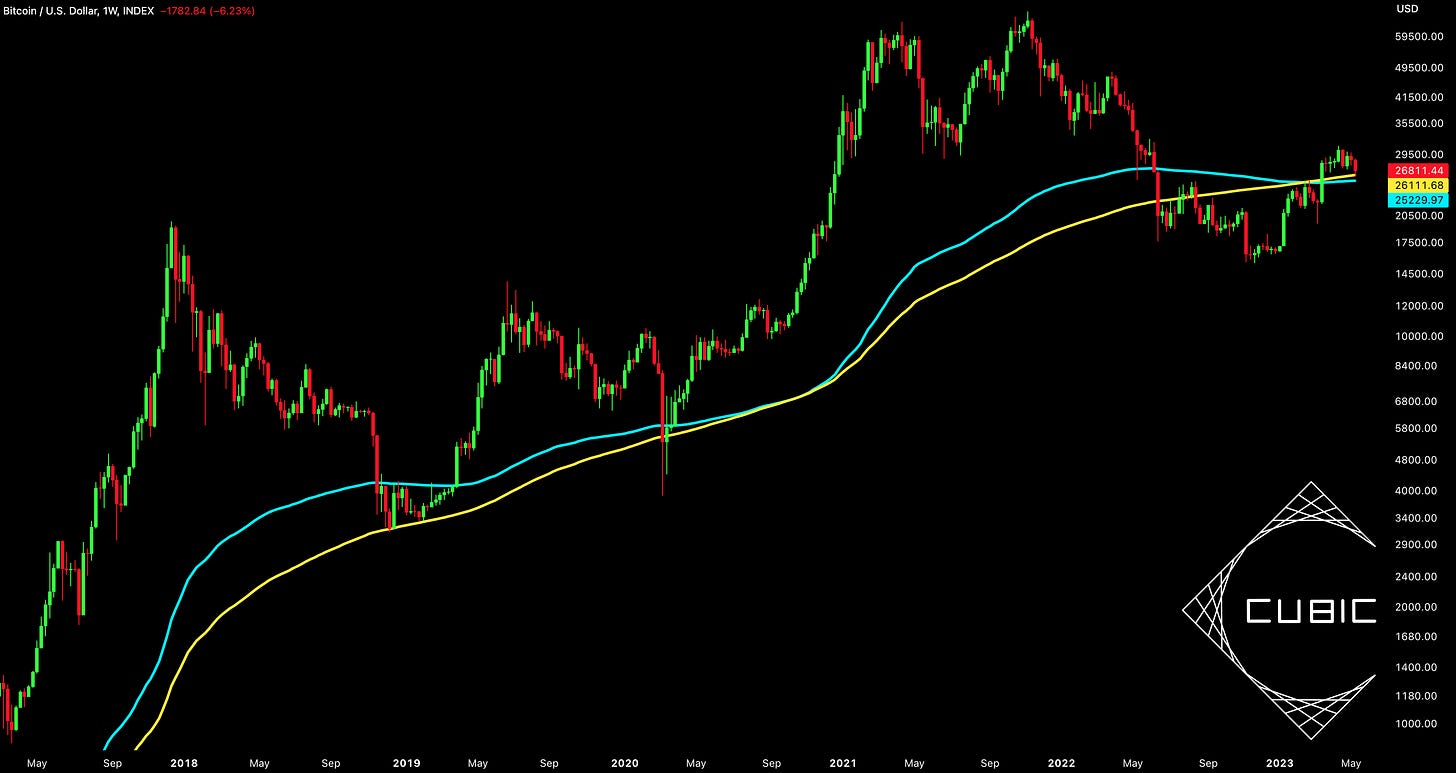
Personally, I’ve retained my bullish stance on Bitcoin during this pullback and I’m viewing these price pressures as a buying opportunity. One of my primary focuses has been the 200-week moving average cloud, combining both the 200-week simple and exponential moving averages.
Without surprise, we saw BTC retest this 200-week MA cloud on Friday!
As I outlined in last month’s video analysis on YouTube, “If we fall into that range, we shouldn’t be losing sleep over this. In fact, if we get down into [the 200-week moving average cloud], you better believe I’m going to be DCA’ing pretty significantly into BTC at that level. Selfishly, I’m almost hoping we get a little pullback into the [200-week moving average].”
The current range of the 200-week MA cloud is $25,230 - $26,112, relative to the current price of $26,811 on Saturday morning. Personally, I wouldn’t be surprised to see a deeper retest of the 200-week exponential moving average (teal), which is the lower-bound of the range I shared above.
I believe that this level in particular has a strong opportunity to act as support, strengthened by a key on-chain datapoint, the short-term holder realized price.
As of 5/11/23, the STHRP is $25,415. Considering that this is the aggregate cost basis of Bitcoin purchased within the past 12 months, I expect to see strong price memory if/when this level gets retested. If my thesis is incorrect, I think a breakdown below the STHRP (and also the 200W EMA) is an important bearish signal that should not be ignored.
My rule of thumb in this environment: If BTC is trading > 200-week EMA and the STHRP, bullish probabilities are favorable. If BTC is < these levels, bearish probabilities are favorable.
Best,
Caleb Franzen
DISCLAIMER:
This report expresses the views of the author as of the date it was published, and are subject to change without notice. The author believes that the information, data, and charts contained within this report are accurate, but cannot guarantee the accuracy of such information.
The investment thesis, security analysis, risk appetite, and time frames expressed above are strictly those of the author and are not intended to be interpreted as financial advice. As such, market views covered in this publication are not to be considered investment advice and should be regarded as information only. The mention, discussion, and/or analysis of individual securities is not a solicitation or recommendation to buy, sell, or hold said security.
Each investor is responsible to conduct their own due diligence and to understand the risks associated with any information that is reviewed. The information contained herein does not constitute and shouldn’t be construed as a solicitation of advisory services. Consult a registered financial advisor and/or certified financial planner before making any investment decisions.
This report may not be copied, reproduced, republished or posted without the consent of Cubic Analytics and/or Caleb Franzen, without proper citation.
Please be advised that this report contains a third party paid advertisement and links to third party websites. These advertisements do not constitute endorsements and are not necessarily representative of the views or opinions of the newsletter author. The advertisement contained herein did not influence the market views, analysis, or commentary expressed above and Cubic Analytics maintains its independence and full control over all ideas, thoughts, and expressions above. The mention, discussion, and/or analysis of individual securities is not a solicitation or recommendation to buy, sell, or hold said security. All investments carry risks and past performance is not necessarily indicative of future results/returns.


