You Didn't Panic, Did You?
Investors,
I facetiously told you to panic last weekend, followed by a calm reassurance and verification of the uptrend. Bears have been fighting this uptrend all year, unwilling to accept the fact that S&P 500 constituents are making new 20-day, 50-day, and 52-week highs day after day, week after week. If you missed that report, I’d strongly encourage you to read last week’s edition of Cubic Analytics using this link below:
Amidst an array of macroeconomic data, events, and earnings season, the S&P 500 managed to produce a weekly gain of +1.01%, despite Thursday’s -1.51% intraday reversal. What were the takeaways from the fundamental data?
More evidence of disinflation
A moderate +0.25% rate hike
Stronger than expected GDP growth
Better than expected corporate earnings
Stronger than expected labor market data
In other words, good things (or perhaps less worse things) keep happening.
As I was drinking coffee this morning, I was struck by the idea to look at how the monthly candlestick chart of the S&P 500 is manifesting with respect to the following annual moving averages:
🟡 12-month EMA (1-year trend)
🔵 24-month EMA (2-year trend)
🔴 36-month EMA (3-year trend)
Given the craziness of the past 36+ months, the relationship between these three EMA’s provides interesting & useful context in a few ways…
The price action during the Great Recession was starkly different than what we’ve experienced either during the COVID Recession or during 2022. During the GFC, we can see that the 1Y EMA fell below the 2Y EMA, which fell below the 3Y EMA. Additionally, each of these EMA’s developed a negative slope. During 2022’s downtrend, these EMA’s stayed in their bullish pattern (1Y > 2Y > 3Y) and the 3Y EMA never developed a negative slope.
At the present moment, all three of these EMA’s are rising, which is emblematic of a bullish market environment.
This bullish structure has been intact since April 2011, highlighting the strength of the market’s long-term trend. We can examine an alternative version of this chart by focusing on the annual EMA’s using weekly candles, but removing the candles entirely.
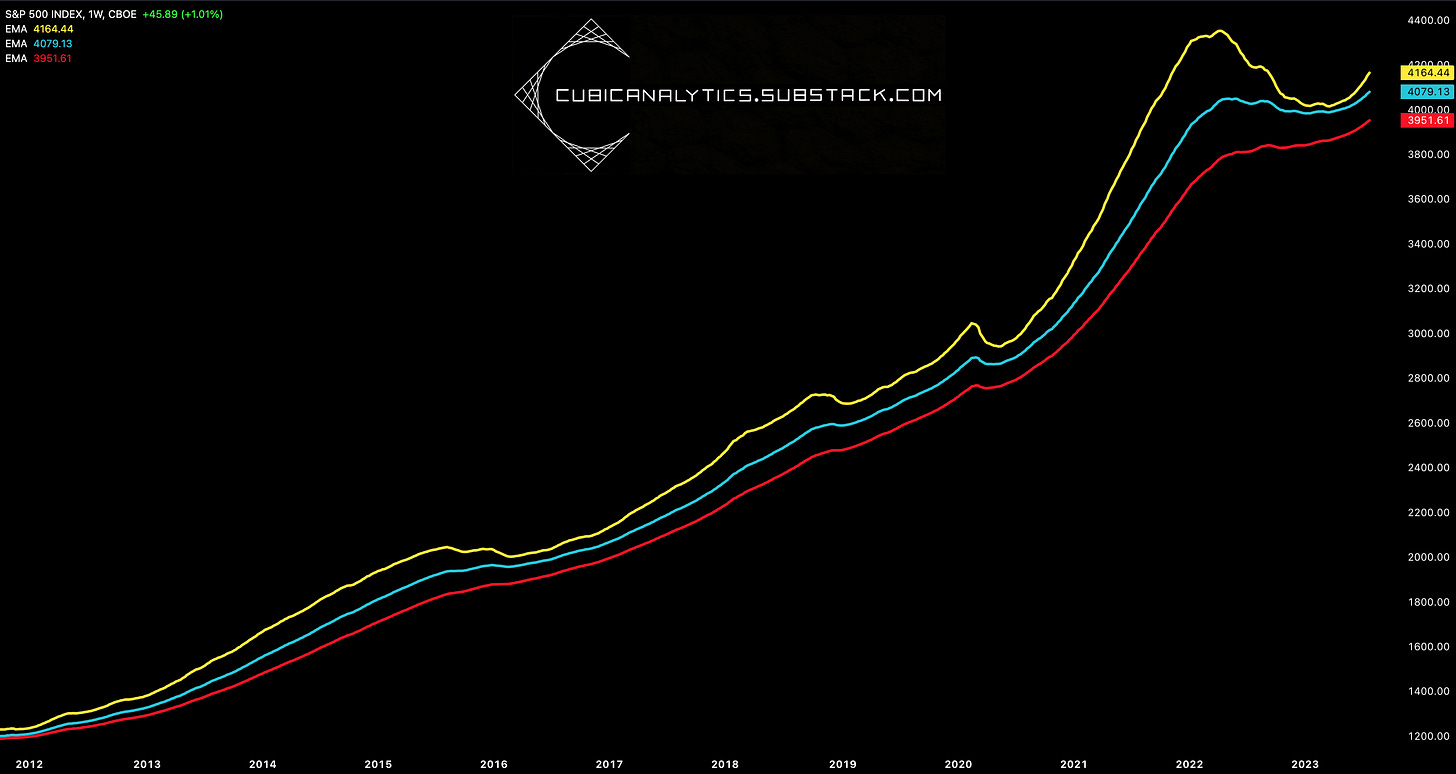
Using weekly candles, the lengths of the EMA’s have been adjusted to:
🟡 52-week EMA (1-year trend)
🔵 104-week EMA (2-year trend)
🔴 156-week EMA (3-year trend)
Even using this more sensitive version of the annual EMA’s, the formation remained in a bullish pattern throughout the 2022 bear market and is now firmly in a bull market behavior with all of the EMA’s rising higher.
Could this deteriorate at some point in the future? Yes, but the market is unequivocally in a long-term uptrend until this EMA structure deteriorates.
The remainder of this report will be extremely brief & concise, but I wanted to share that the team at MicroSectors has some really exciting announcements coming in the near future and I’d encourage you to follow them on Twitter for any updates!
Macroeconomics:
Disinflation.
That’s all. That’s literally all I’m going to say.
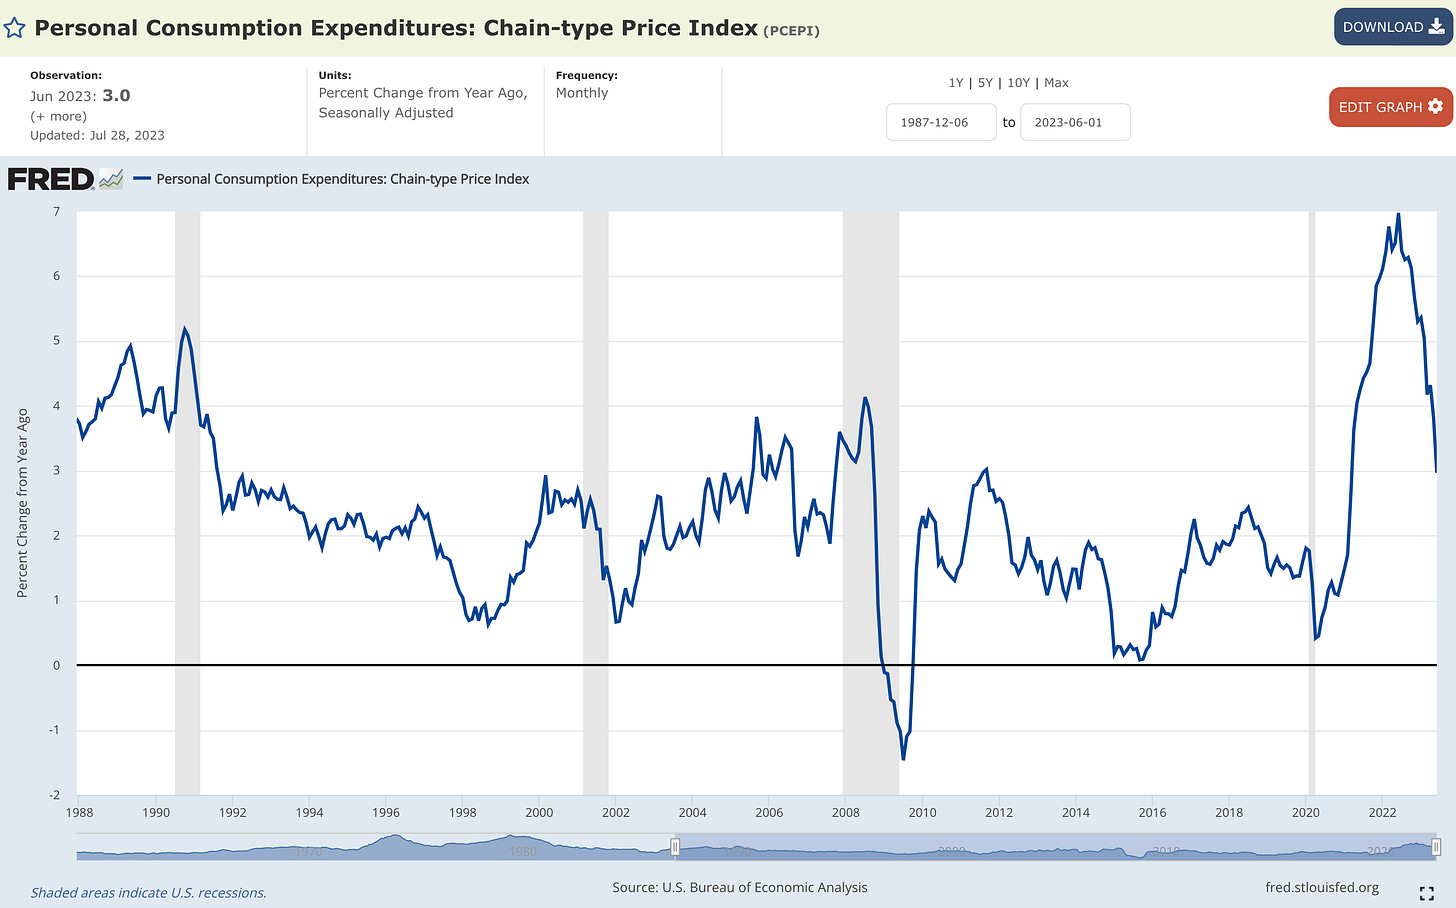
Here are a few charts regarding the Personal Consumption Expenditures (PCE) data, which is the Fed’s preferred inflation metric:
1. Personal Consumption Expenditures (PCE) Inflation = +3.0% YoY:
2. Core PCE Inflation = +4.1% YoY:
3. Median PCE Inflation = +5.0% YoY:
4. Trimmed-mean PCE Inflation = +4.2% YoY:
Disinflation.
Stock Market:
On Friday, the S&P 500 had the highest daily & weekly close YTD. The Dow Jones had the second highest daily close and the highest weekly close YTD. The Nasdaq-100 had the highest weekly close YTD. Industrial stocks ($XLI) had their highest weekly close YTD. Technology stocks ($XLK) had their highest weekly close YTD. Consumer discretionary stocks ($RSPD) had their highest weekly close YTD. Semiconductor stocks ($SMH) had their highest weekly close of all-time. Basic materials stocks ($XLB) had their highest weekly close YTD. The Dow Jones Transportation Average (not the Dow Jones Industrial Average) had the highest daily & weekly close YTD.
Even the DAX, which is an index comprised of the top 40 stocks in the German stock market, hit new all-time highs on Friday!
Emerging markets (excluding China) are also at new YTD & 52-week highs, given by the performance of $EMXC.
I don’t know what else people need to see or hear… stocks are in uptrends. Not just U.S. stocks. Not just mega-cap stocks. Not just technology stocks. Stocks.
While some sectors are certainly underperforming YTD, like real estate, utilities, consumer staples, and healthcare, there are an abundance of stocks that are performing extremely well in this market (and have been all year). Even the “weak” sectors that I mentioned above are all trading above their 2022 lows!
Similar to the macro section above, I’m going to keep my comments brief and let the information above speak for itself as much as possible. If you’re a bear who refuses to accept the facts expressed above, that’s your own fault. No one else’s.
Bitcoin:
I bought more Bitcoin yesterday.
I am completely comfortable with the possibility that I’m incorrect, but I’m gaining an increased level of confidence that Bitcoin is going to stay above two key levels:
🔴 AVWAP from former YTD highs (April 2023)
🟢 AVWAP from pre-BlackRock lows (mid-June 2023)
If this level fails to act as support, I could see further downside into the $26,000 range; though it’s worth noting that I’m 100% comfortable holding through that drawdown and even buying more if/when it happens.
Best,
Caleb Franzen
SPONSOR:
This edition was made possible by the support of MicroSectors, a financial services and investment company that creates an array of unique investment products and ETN’s. Their NYSE FANG+ products are the only one of their kind, allowing investors to gain exposure, leveraged/un-leveraged and direct/inverse, to the NYSE FANG+ Index. They have a suite of products ranging from big banks, to oil and gas, and even gold/gold miners.
I started a partnership with MicroSectors because I’ve been using their products for over a year and this was an organic and seamless fit with my views.
Please follow their Twitter and check out their website to learn more about their services and the different products that they offer.
DISCLAIMER:
This report expresses the views of the author as of the date it was published, and are subject to change without notice. The author believes that the information, data, and charts contained within this report are accurate, but cannot guarantee the accuracy of such information.
The investment thesis, security analysis, risk appetite, and time frames expressed above are strictly those of the author and are not intended to be interpreted as financial advice. As such, market views covered in this publication are not to be considered investment advice and should be regarded as information only. The mention, discussion, and/or analysis of individual securities is not a solicitation or recommendation to buy, sell, or hold said security.
Each investor is responsible to conduct their own due diligence and to understand the risks associated with any information that is reviewed. The information contained herein does not constitute and shouldn’t be construed as a solicitation of advisory services. Consult a registered financial advisor and/or certified financial planner before making any investment decisions.
This report may not be copied, reproduced, republished or posted without the consent of Cubic Analytics and/or Caleb Franzen, without proper citation.
Please be advised that this report contains a third party paid advertisement and links to third party websites. These advertisements do not constitute endorsements and are not necessarily representative of the views or opinions of the newsletter author. The advertisement contained herein did not influence the market views, analysis, or commentary expressed above and Cubic Analytics maintains its independence and full control over all ideas, thoughts, and expressions above. The mention, discussion, and/or analysis of individual securities is not a solicitation or recommendation to buy, sell, or hold said security. All investments carry risks and past performance is not necessarily indicative of future results/returns.


