

Investors,
Are rate cuts bullish or bearish?
Context matters.
I remember a certain cohort of investors told us throughout 2024 to “be careful what you wish for” as we (correctly) anticipated rate cuts in the 2nd half of the year.
They told us cuts were bearish.
They told us to look at historical data.
But they conveniently forgot to look at the most important data: returns after cuts.
On average, after the first cut, the S&P 500 is up +9.7% one year later, since 1957.
That’s just a fact.
Then consider two bifurcated paths that the economy could take:

Absent a recession, the S&P 500 has produced an average return of more than +20% one year after the first rate cut.
Understanding these dynamics led me to a simple conclusion:
“Disinflationary” or “non-recessionary” rate cuts aren’t bearish… they’re incredibly bullish!
So that’s exactly what I shared, at the time:

And that wasn’t the first time I said something along those lines:

Part of my entire bull thesis for 2024 was based on the fact that the Fed would cut interest rates, likely in the 2nd half of the year, and that these cuts would be in response to persistent disinflation rather than economic weakness or crisis events.
Of course, 2024 turned into a banner year for both stocks and Bitcoin.
And how have those assets performed since the first cut in mid-September 2024?
Extremely well…
Russell 2000 ($RUT) +7.8%
S&P 500 ($SPX) +14.9%
Nasdaq-100 ($NDX) +21.8%
Gold ($GLD) +40.6%
NYSE FANG+ Index ($NYFANG) +41.2%
Bitcoin ($BTC) +84.4%
Ethereum ($ETH) +164.0%
I think these returns speaks for themself — disinflationary or non-recessionary rate cuts weren’t bearish… On the contrary, they were incredibly bullish.
With the next first cut likely to occur on September 18th, how should our expectations for future returns evolve based on current macro data?
In other words, is the disinflationary and/or non-recessionary rate cut hypothesis still valid in the context of current macroeconomic data?
If it’s different, how should it impact our outlook for risk assets?
This report is 100% free, so I encourage you to share it with your colleagues:
Inflation Dynamics:
It will be vital to embrace nuance in this report.
Therefore we must understand, at a fundamental level, different types of inflation:
Inflationary regimes: prices are rising.
Deflationary regimes: prices are falling.
Disinflationary regimes: a form of an inflationary regime, where prices are rising at a slower pace.
Re-inflationary regimes: a form of an inflationary regime, where prices are rising at an accelerated pace.
If we create a simple analogy using a car, the regimes can be equated to the following:
Inflationary regime: a car is driving forwards.
Deflationary regime: a car is driving backwards.
Disinflationary regime: a car slows from 70 miles per hour to 50 miles per hour.
Re-inflationary regime: a car raises its speed from 50 mph to 70 mph.
Similar to the car analogy, it’s very rare that the U.S. economy experiences outright deflation, the same way that we rarely use the reverse gear when driving a car.
The fact of the matter is that the Federal Reserve has a “price stability” mandate, though I’ve often criticized this goal as an illusion because they actually have an inflation target mandate of +2% YoY inflation.
If the Fed wanted prices to be stable, they’d target 0% inflation, but the reality is that they want prices to rise by 2% per year every single year (which means that prices double every 35 years).
But my complaint over this nuance is a topic for another time…
When CPI inflation peaked at roughly +9% YoY in mid-2022, the Fed started to pursue a path of aggressive monetary tightening, in what we now know was the fastest pace of monetary tightening in modern monetary history.
The Fed needed to fight inflation, producing enough disinflation to drive the inflation rate back towards +2% YoY inflation — a target that is still out of reach today.
Their tightening, in addition to a variety of other factors, was successful at producing disinflation without causing undue harm to the U.S. economy.
Powell and various Fed officials reiterated that they wanted to “see the whites of inflation’s eyes” and to “have confidence” that inflation was moving “sustainably” back towards their +2% YoY inflation target.
In September 2024, based on the overwhelming evidence of disinflation and some moderate concerns about the direction of the labor market data, the Fed cut rates by 0.5% with the August 2024 headline CPI data showing +2.6% YoY inflation:
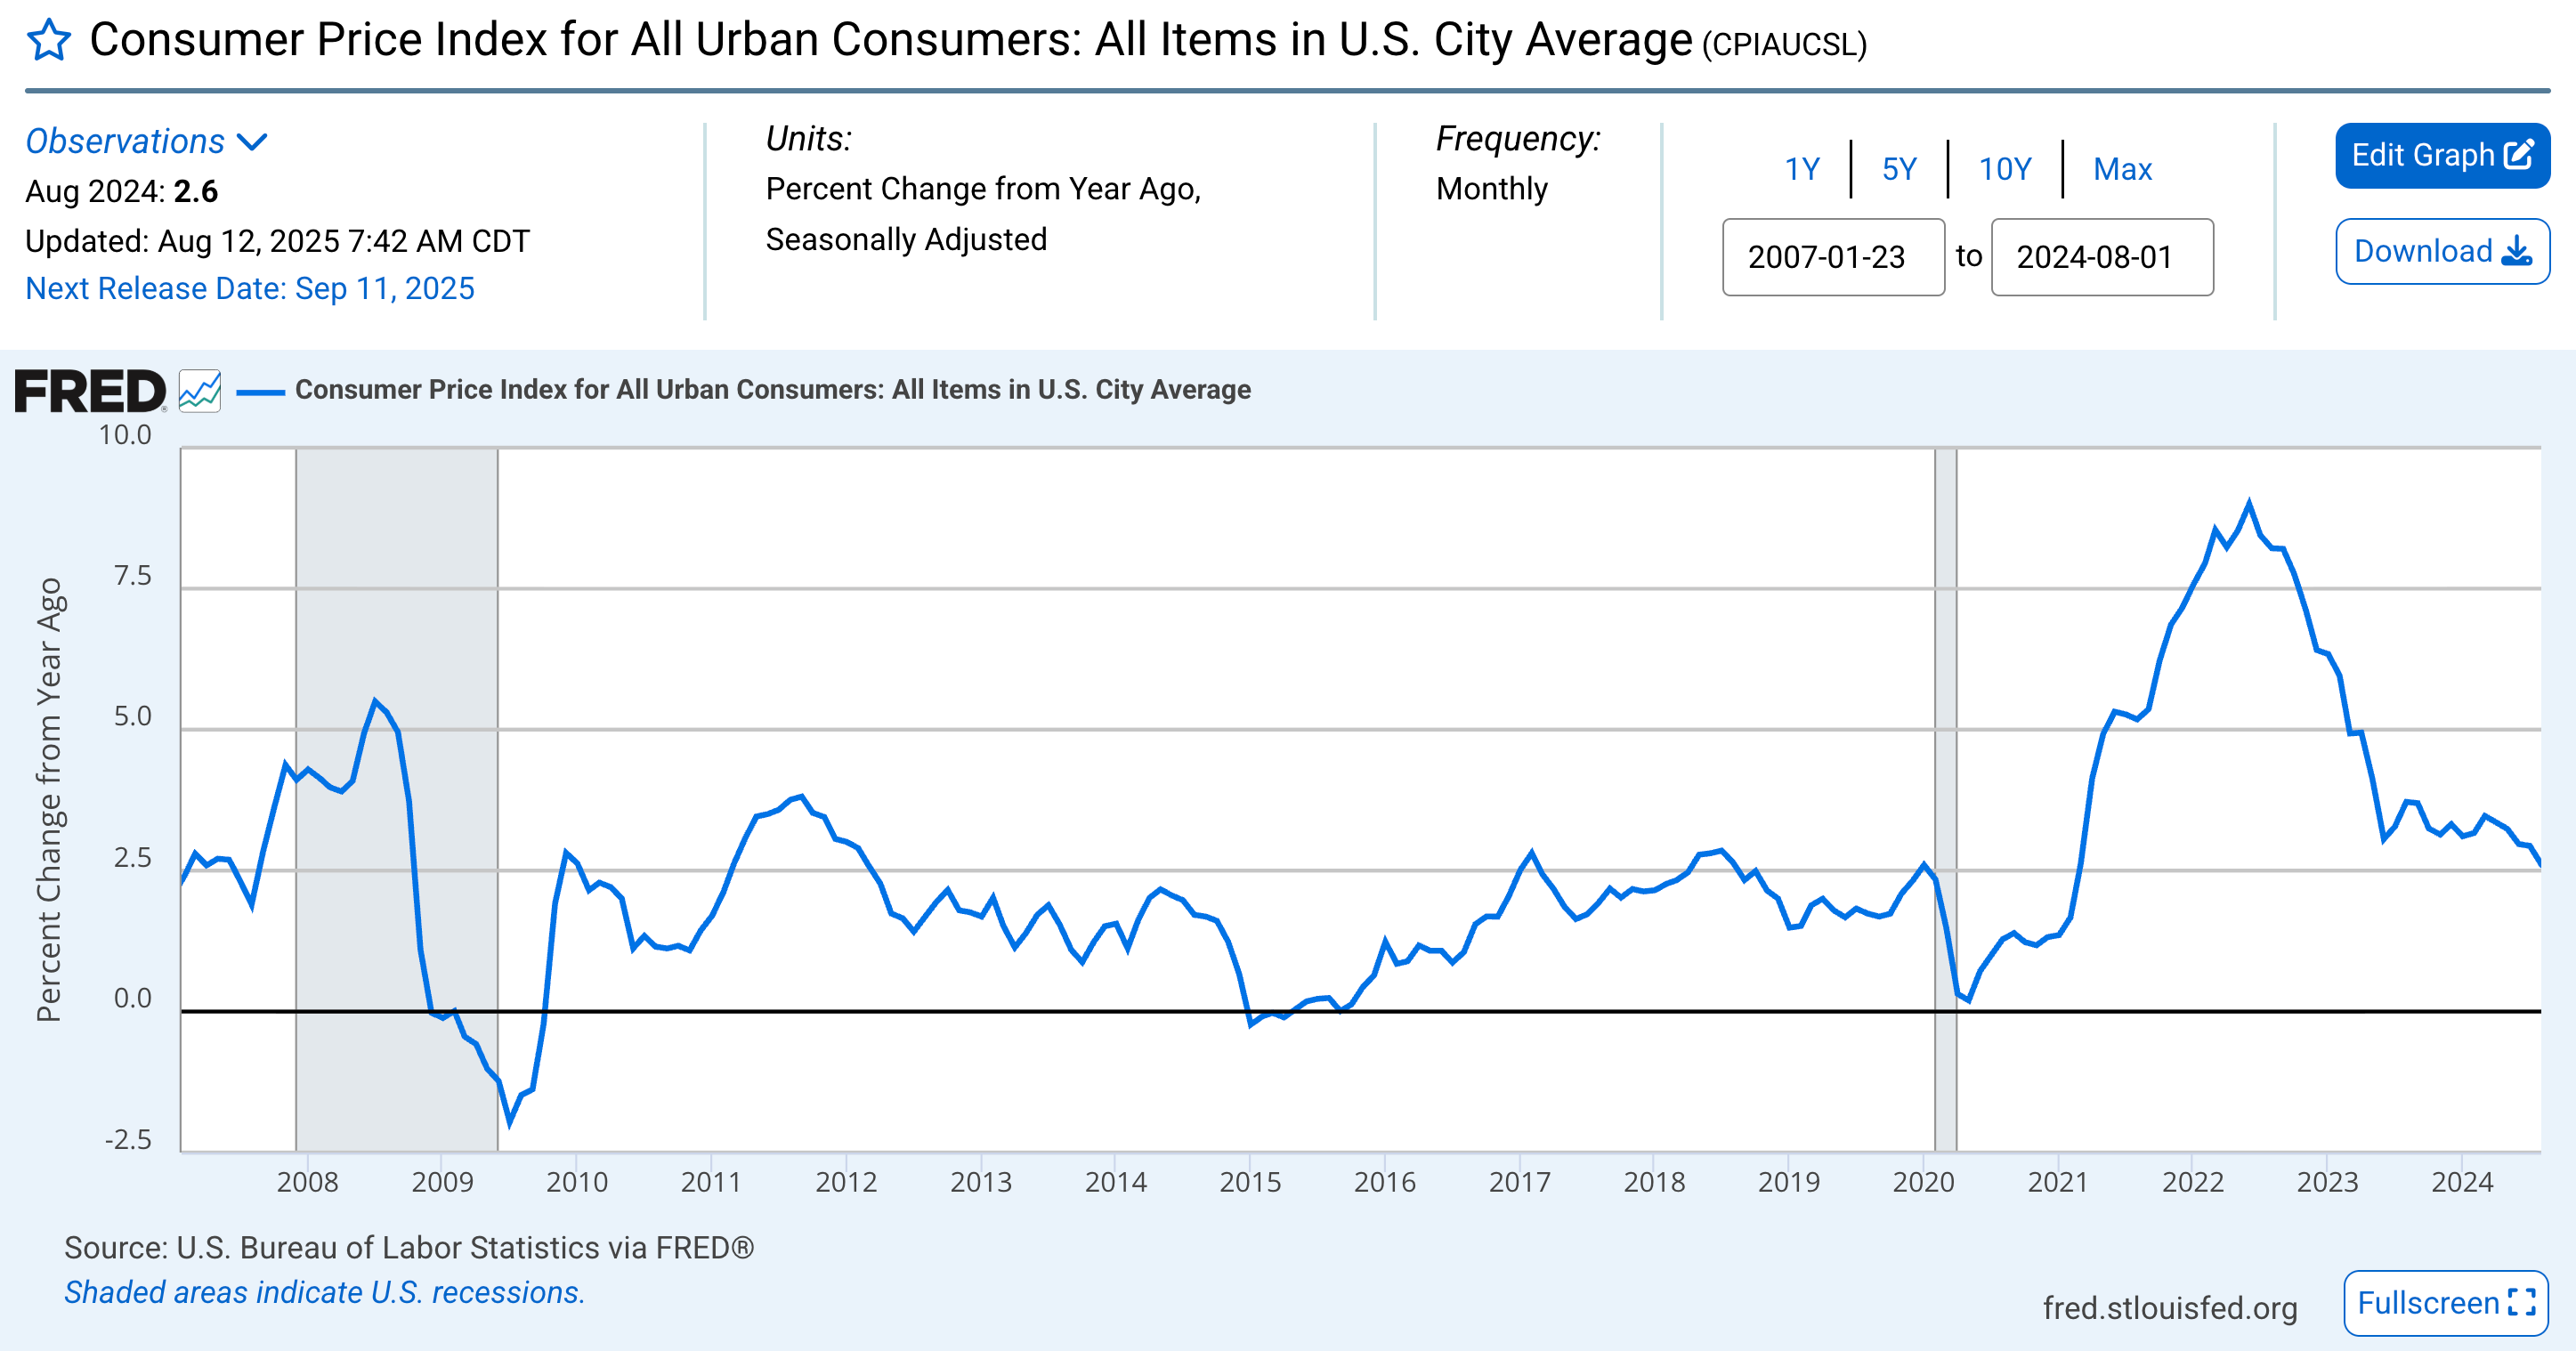
Inflation levels had returned to their pre-COVID levels and the trend of disinflation indicated a return below +2% inflation within a few months (or quarters, at the latest).
This wasn’t just a matter of disinflationary evidence for headline CPI — we saw overwhelming evidence of disinflation in all of the major components. Just look at the chart below, tracking median and trimmed-mean CPI inflation YoY as of August 2024:

This trend of persistent disinflation since the peak in 2022 is why I referred to the inevitable rate cuts as “disinflationary” rate cuts — the Fed had achieved a green light to cut interest rates based on the overwhelming evidence of persistent & sustained disinflation back towards their +2% YoY inflation target.
The key here was the direction of inflation, rather than the level of inflation itself.
Of course, prices were still rising… they were just rising at a pace that was closer to the Federal Reserve’s +2% inflation target.
And that’s all that mattered, for both the Fed and the stock market/Bitcoin.
Let’s contrast this against the current inflation backdrop and ask a simple question:
Is the direction of inflation consistent with a bullish disinflationary rate cut regime?
We can answer this in a few key charts:
1. Median & Trimmed-Mean CPI inflation are both accelerating: By definition, the recent acceleration in these datapoints indicate that disinflation is not intact. Both measures of broad-based inflation are higher today than they were in April 2025, when tariffs were enacted.
Median CPI inflation in April 2025: +3.46% YoY vs. +3.65% today
Trimmed-mean CPI inflation in April 2025: +2.97% YoY vs. +3.22% today

Of course, both headline & core CPI are also accelerating on a YoY basis since April.
2. Headline CPI ex-Shelter is accelerating again: I think it’s important to remove Shelter from the inflation data, not because Shelter is insignificant, but because of simple math. Let me explain… Shelter is the largest inflation component, roughly 33% of the total CPI basket; however, it’s also the laggiest component, per the Fed’s own admission. How significant is the lag? 6-18 months. So the largest component of the inflation basket is also the worst at measuring real-time inflation. That’s why I think it’s important to exclude it, so that we can measure the “rest” of the inflation basket with a better pulse.

This is important for three reasons:
Headline ex-Shelter inflation is currently +2.2% YoY, above the Fed’s target
Headline ex-Shelter inflation is higher than it was in August 2024 (+1.19% YoY), when the Fed cut for the first time last year.
Similar to the median & trimmed-mean components above, this measurement of inflation has also been accelerating since April 2025, when it was +1.39% YoY.
3. If we monitor the individual components within the CPI basket, we’re seeing the highest percentage of those components showing an inflation rate above 2%:

Per Gordon’s post, this is the highest amount of components above 2% since Oct.’22.
Even worse, this acceleration is taking place amidst a background of inflationary catalysts that imply that inflation is only going to keep accelerating!
For the sake of argument, since we can’t actually measure the direct impact of tariffs on inflation, we’ll exclude tariff dynamics. Some folks will argue that tariffs are deflationary, while others will argue that it’s inflationary… the reality is that we don’t know, until we know… and it’s too early to know for certain.
The current macroeconomic backdrop has the following inflationary catalysts:
Money supply growth is accelerating, while M2 itself is making new ATHs: On a YoY basis, M2 is growing at a pace of +4.5% as of June 2025, substantially higher than the +1.57% pace when the Fed cut rates in September 2024.

According to Milton Friedman, “inflation is always and everywhere a monetary phenomenon”. Even if you think those views are outdated, or perhaps insufficient on their own to justify a higher inflationary outlook, M2’s expansion certainly isn’t deflationary.
Credit creation is also accelerating, indicating that deposits in M2 are being distributed via banks through new loans to consumers & commercial entities: This is a key inflationary catalyst, explaining why high inflation didn’t occur after initial phases of QE following the Great Recession. The acceleration of credit in mid-2021 through the end of 2022, helped to ignite the wave of inflation during that period.

With the persistent & steady acceleration of credit creation, this means that more money is leaving the financial system and entering the “real” economy for spending and/or investing purposes. While it doesn’t guarantee higher inflation, it represents a risk that inflation could reaccelerate further than it already has in recent months.
Wage growth is very robust, with the latest round of nonfarm payrolls showing +3.7% YoY growth in average hourly earnings, while the Atlanta Fed’s Wage Growth Tracker is showing +4.1% wage growth.

With both measures trending higher than official headline CPI inflation on a YoY basis, the implication is that consumers can absorb higher prices in the event that producers/retailers are forced to raise prices.
Just look at the mid-2010’s, when both measures of wage growth were outpacing official headline CPI inflation on a YoY basis… the result was that inflation reaccelerated, even if inflation never got overheated.
Again, this is about direction — not level.
With wage growth higher than inflation, we could see inflation accelerate higher.
As a final point on inflationary catalysts, we must address deficit spending.
According to data from the U.S. Treasury and represented in this chart from Bipartisan Policy Center, deficit spending in 2025 is outpacing each of the prior three years:

I could easily argue that each of these components in a vacuum are not sufficient to cause re-inflation; however, on the aggregate, their effects compound and significantly increase the probability that inflation is going to reaccelerate further than it already has in recent months.
And again, all of these points are being considered without the (unclear) impact of tariffs on inflationary dynamics.
I still think it’s too soon to decisively say what the impact of tariffs are on inflation; however, I do want to point out the following…
Even if you believe that BLS data is rigged or inaccurate, therefore dismissing the YoY acceleration of inflation since April 2025, why is Truflation’s estimate of YoY inflation up so much since April?

While Truflation has its own flaws, the current estimate of +1.93% YoY is considerably higher than the +1.2% inflation level at the start of April 2025, when tariffs were enacted.
It’s important to remember that inflation is multi-variate.
Inflation is not caused by one single component, as there could be other dynamics in the economy that are causing deflation or reducing the impact of other inflationary catalysts.
However, when we assess the weight of the evidence and the general catalysts that contribute to inflation, we have a cocktail of re-inflationary risks.
The inflation regime today is much different than it was in the 2nd half of 2024.
We’ve transitioned from a disinflationary regime to a re-inflationary regime.
Especially if my analysis is correct and we see a moderate & sustained re-acceleration of inflation in the months/quarter ahead.
By definition, this means that the upcoming rate cut is NOT a disinflationary rate cut.
If disinflationary rate cuts were bullish in 2024, but the current environment is not emblematic of a disinflationary rate cut regime, then it’s harder to justify how this upcoming rate cut cycle will be bullish.
Macro & Labor Market Dynamics:
I want to start this section by noting that I don’t think a recession is probable over the next 12 months; however, the risk of a recession in the next 12 months is higher today than it was in September 2024.
I’ve been one of the loudest analysts proclaiming that the economy is resilient & dynamic, expressing my view that the economy will continue to be resilient & dynamic even in the light of some modest softening.
Even today, my belief is that economic data will continue to be resilient & dynamic.
In 2024, I shared my belief that some softening in the labor market would actually be perceived as bullish, allowing the Fed to use persistent disinflation as an opportunity to cut rates and avoid putting undue harm on the labor market.
This is why I also referred to those cuts as non-recessionary rate cuts!
They were preventative, in the face of modest softening (but an overall resilient & dynamic) U.S. economy.
Going into the first cut in September 2024, the unemployment rate over the preceding 12 months had steadily been rising, going from 3.7% in January 2024 to 4.2% in August.

The Sahm Rule had been triggered, initial unemployment claims were rising, and scary headlines about layoffs plagued the news.
I dismissed these concerns & reiterated that the labor market would be fine.
Even the creater of the Sahm Rule, Claudia Sahm, dismissed her own indicator’s warning at the time and said that we weren’t in a recession and a recession wasn’t even on our doorstep.
So I listened to the expert, in real-time, and also dismissed the indicator’s signal:

From my vantage point, both initial & continued unemployment claims were relatively muted and consistent with bull markets throughout history, so I wasn’t concerned about the labor market in so far as trying to evaluate future equity returns.
At the time, the September 2024 data showed that continued unemployment claims were decelerating on a YoY basis, reaching their lowest levels in 18+ months, at +1.9% YoY.
If we contrast that vs. the current environment, continued claims are up +4.9% YoY.

The unemployment rate has largely treaded water over the past 12 months; however it’s now trading at its highest levels since October 2021:

The key difference, of course, is that the unemployment rate in October 2021 was falling rapidly vs. the steady rise in today’s economy.
Direction, not level.
As we think about direction, we should also consider that the long-term unemployment rate (the unemployment rate for people who have been unemployment for at least 27 consecutive weeks) continues to reaccelerate to its highest levels in years:

But firing is only one half of the picture…
Let’s also consider the evolution in job creation, using ADP Private Payrolls (showing private market hiring via ADP) and Nonfarm Payrolls (showing public & private market hiring via the BLS).
At the Fed’s first rate cut in September 2024, job creation was robust.
On a trailing 6M basis, as of the August 2024 data:
ADP Private Payrolls were adding an average of +119.5k jobs per month
Nonfarm Payrolls were adding an average of +133.8k jobs per month
As of today, using the August 2025 data, the figures have drastically slowed down:
ADP Private Payrolls were adding an average of +62.1k jobs per month
Nonfarm Payrolls are adding an average of +64.1k jobs per month
Either way we measure it, job creation has basically decelerated by 50%.
Let’s also look at the trailing 3-month data:
As of the August 2024 data:
ADP Private Payrolls were adding an average of +119.3k jobs per month
Nonfarm Payrolls were adding an average of +82k jobs per month
As of today, using the August 2025 data:
ADP Private Payrolls were adding an average of +45.6k jobs per month
Nonfarm Payrolls are adding an average of +29.3k jobs per month
These datapoints aren’t recessionary (yet), but they show a notable deceleration in hiring activity. If less people are being added to the labor market, this means that aggregate income levels are likely to decelerate, which could cause pressure on spending activity.
So as we look at the aggregate labor market data, we see the following conclusions:
The unemployment rate is rising and making new multi-year highs.
Continued unemployment claims are accelerating on a YoY basis.
Job creation is decelerating at a considerable pace.
Wage growth is lower than it was one year ago, on both a nominal & real basis.
While we can make the case that the labor market is still resilient & dynamic, we must accept that it’s less true today than it was one year ago. With additional evidence of weakness in the labor market, this skews risks to be more elevated for the U.S. economy, particularly in an environment where consumers are likely to face more inflationary pressures.
Yes, current real GDP data is still robust; however, it’s less robust than one year ago.
The data below shows real GDP growth on a YoY basis and its ongoing deceleration:

Measured at +3.03% YoY in Q2 2024 (the most recent data at the Fed’s disposal last September) vs. the current pace of +2.1% YoY real GDP growth.
To be clear, +2.1% YoY growth is still sufficient to support an ongoing bull market, but I’m simply highlighting the fact that growth has been decelerating over the past year.
My point here is simple…
Conclusion:
Rate cuts are coming, according to the U.S. Treasury market, which finally gave the signal this week that imminent rate cuts are around the corner:

However, this is where we must embrace nuance…
Disinflationary rate cuts aren’t coming, because disinflation is not intact.
Non-recessionary rate cuts might still be on the table; however, the direction of macroeconomic data has deteriorated and recession risks seem more elevated today than they were in September 2024.
One year ago, we had a combination of disinflationary and non-recessionary rate cuts.
Today, we might only have one of them, at best, and there’s a risk of having neither.
That isn’t to say that the bull market is over, or that asset prices can’t be higher one year from now… but I am saying that the upcoming rate cut regime (likely) won’t be as accretive as it was over the past 12 months.
This is where we must choose how to prioritize data…
Are we going to emphasize macroeconomic data and try to discredit the bull market?
Or…
Will we align with the bull market and dismiss broader macro concerns, for now?
Objectively, we have stock prices at new all-time highs.
Bitcoin is firmly trading above $110k.
Risk appetite is strong & healthy.
We have broad-based participation in the stock market.
Cyclical economic sectors in the stock market (homebuilders, industrials, banks, retail, & consumer discretionary) are breaking out
Credit spreads are low and junk bonds are making new multi-year highs.
Let’s also consider the following, in addition to what I’ve said above…
Any macroeconomic justification to fade this bull market over the past 3 years has been the wrong decision, by the very fact that the market is at all-time highs.
Remember the banking crisis?
Remember student loan repayments?
Remember the record low savings rate?
Remember the geopolitical conflicts around the world?
Remember the acceleration of auto loan defaults?
Remember the UK gilt crisis?
Remember the rise of initial unemployment claims?
Remember the unwind of the Yen carry trade?
Remember when Warren Buffett was raising cash?
Remember the commercial real estate crisis?
All of these risks were cited by macro talking heads to justify a bearish outlook.
All of these risks were terrible justifications to sell stocks…
On the contrary, all of these risks were a GREAT reason to buy stocks!
It goes back to the famous saying on Wall Street: “bull markets climb a wall of worry”.
The only one that worked was the tariff tantrum, but that was a short-lived bear market over the course of 6 weeks that immediately produced new all-time highs.
Despite all of the criticisms, the Federal Reserve has been able to manufacture the soft-landing against all odds, with many folks even calling it a “no landing”.
Have they been perfect? No… they’ve made mistakes.
But, they’ve been able to provide conditions sufficient for asset prices to go up, even if that wasn’t their direct goal.
Who’s to say that they can’t pull this off?
Who’s to say that the labor market can’t stay resilient & dynamic?
Who’s to say that the economy is going to contract?
Who’s to say that disinflation won’t return?
Maybe I’m playing devil’s advocate against myself and all of the data that I’ve reviewed within this report, but what are we supposed to do as investors in light of this evidence that I’ve presented?
Are we supposed to sell all of our stocks and Bitcoin?
Are we supposed to short the market?
Are we supposed to fight the trend?
My response to these questions is very simple: not yet.
If/when the market cares, I will care and make necessary adjustments.
But right now, the market doesn’t care.
The data that I’ve presented in this report is material and could become increasingly significant in the months ahead, which is why I think it’s our job as investors to be aware of the unfolding risks.
Some of us might look at this data and think portfolio adjustments are necessary.
Some of us might look at this data and think that it’s all insignificant.
But all of us should look at this data, be aware of it, and see how markets unfold.
We should use this data as a way to be objective about the reality of broader market conditions, rather than pretending to live in an environment where disinflation is intact and that 2025’s rate cuts will yield the same results as 2024’s.
That’s the point of this report: to understand that the context of today’s cuts are different than the cuts from last year, which went on to produce great results, as I predicted.
While I forecasted 2024’s rate cuts to be unequivocally bullish, I’m unable to come to the same conclusion about this upcoming rate cut cycle.
I don’t know if that means we should expect higher volatility.
I don’t know if that means we should expect lower nominal returns.
I don’t know if that means we should expect lower risk-adjusted returns.
All I know is that we don’t have the same bullish criteria today as we did one year ago.
I hope, for all of our sakes, that my concerns are unwarranted.
I’ll keep doing my best to make this bull market count, while it lasts, and be flexible enough to adapt if/when the the market tells me that it’s time to adapt.
Best,
Caleb Franzen,
Founder of Cubic Analytics
This was a free edition of Cubic Analytics, a publication that I write independently and send out to ~14,000 investors every Saturday. Feel free to share this post!
To support my work as an independent analyst and access even more exclusive & in-depth research on the markets, consider upgrading to a premium membership with either a monthly or annual plan using the link below:
There are currently ~1,100 investors who are on a premium plan, accessing the exclusive alpha and benefits that I share with them regarding the stock market, Bitcoin, and my own personal portfolio.
DISCLAIMER:
This report expresses the views of the author as of the date it was published, and are subject to change without notice. The author believes that the information, data, and charts contained within this report are accurate, but cannot guarantee the accuracy of such information.
The investment thesis, security analysis, risk appetite, and time frames expressed above are strictly those of the author and are not intended to be interpreted as financial advice. As such, market views covered in this publication are not to be considered investment advice and should be regarded as information only. The mention, discussion, and/or analysis of individual securities is not a solicitation or recommendation to buy, sell, or hold said security.
Each investor is responsible to conduct their own due diligence and to understand the risks associated with any information that is reviewed. The information contained herein does not constitute and shouldn’t be construed as a solicitation of advisory services. Consult a registered financial advisor and/or certified financial planner before making any investment decisions.
Each investor is responsible to understand the investment risks of the market & individual securities, which is subjective and will also vary in terms of magnitude and duration.
Fantastic analysis. Intellectual honesty is rare these days. Can you comment on two points that are making me slightly more bullish: (1) new orders minus inventories in the pmi are up a lot and part time employment (which usually leads full time employment) is also up. Thanks.
Great write up bro, really appreciate how in depth you go with nuance. Lets hope we get good data going forward 🙏🏻