Investors,
Next Wednesday, February 1st, will be the first edition of my newest series, where I’ll be conducting a deep dive on a subscriber-voted stock! These reports will be exclusive for premium/paid members and the first edition will be focused on Chevron ($CVX)! The company reported earnings earlier this past week, so there will be a bunch of juicy new details to discuss as it pertains to the oil giant! To receive that analysis on Wednesday, please consider upgrading your subscription using the link below, which will provide a 20% discount!
Macroeconomics:
The Federal Reserve’s preferred method of measuring inflation has decisively peaked. The Personal Consumption Expenditures (PCE) data for December 2022 was released on Friday morning, showing a +5.0% year-over-year rate of change. With median estimates projecting a +5.0% increase and the November 2022 data showing a +5.5% increase, this is yet another win for the Peak Inflation team.
Core PCE also decelerated from 4.7% YoY in November 2022 to +4.4% in December:
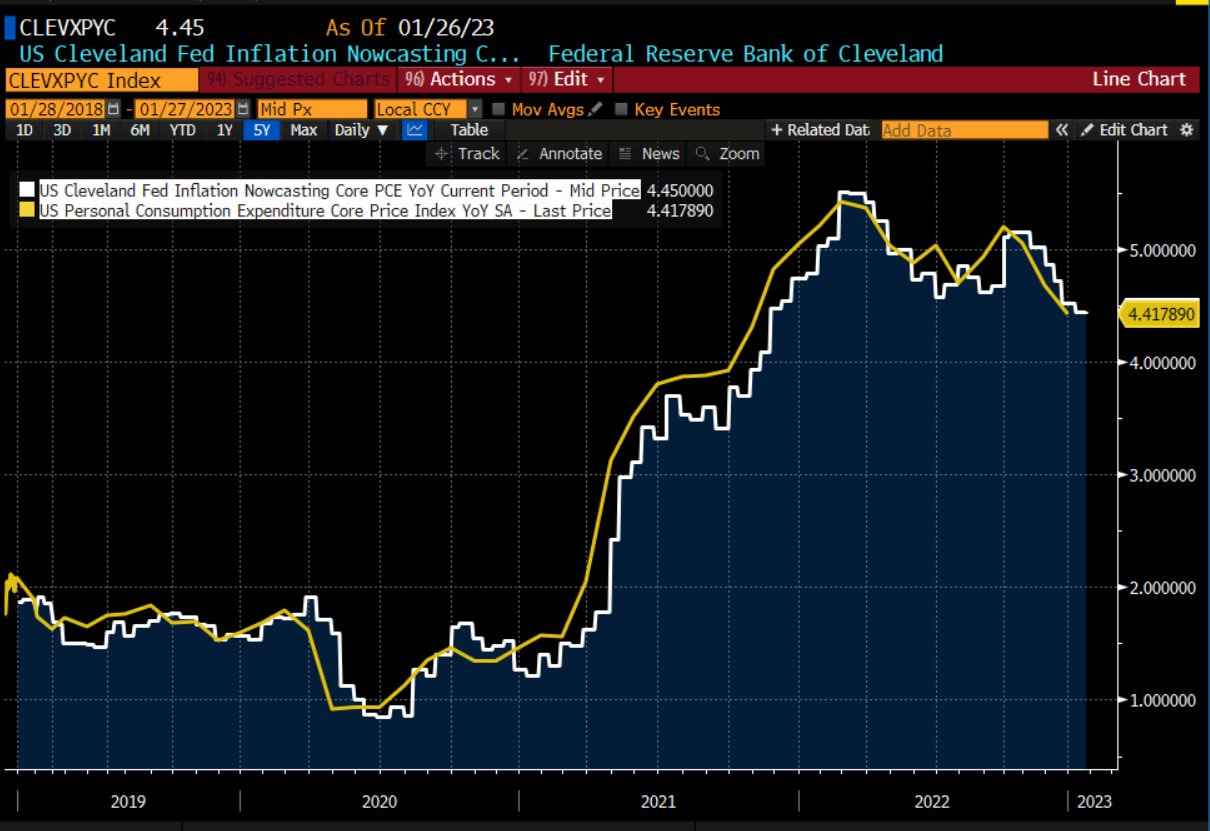
In my eyes, this is the proverbial “nail in the coffin” to confirm that inflation is trending lower and is likely to continue trending lower. Based on the alternative measures of the PCE data, shown in the chart below from the Cleveland Fed, the aggregate factors influencing price increases are decelerating.
Unlike any time during the inflationary boom of 2020 to 2022, we’re seeing each of these variables start to decelerate and roll over. It can’t be understated how important of a win this is for the Federal Reserve! This deceleration has truly been notable over the past 3 months, highlighting the fact that disinflation became the theme of the fourth quarter of 2022. In fact, the Q4 GDP data released on Thursday morning confirms that this is true!
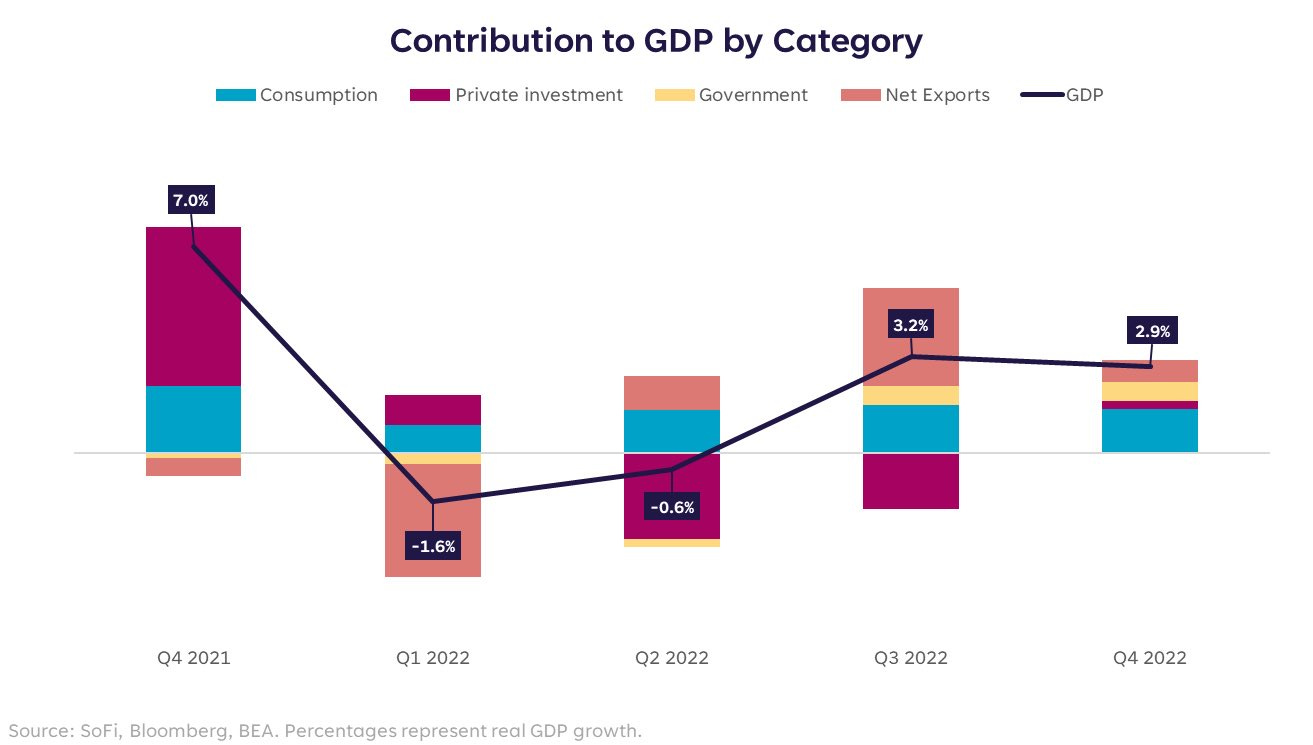
Here are some highlights from the report:
Q4 2022 real GDP grew at an annualized pace of +2.9% vs. estimates of +2.8%.
This was a moderate deceleration vs. real GDP growth of +3.2% in Q3’22.
The deceleration can be attributed to “a downturn in exports and decelerations in nonresidential fixed investment, state and local government spending, and consumer spending.”
For calendar year 2022, real GDP grew by +2.1% vs. +5.9% in 2021.
Looking at the individual components of the GDP calculation, it’s interesting to see private investment make a substantial comeback relative to the lull in Q2 and Q3 2022. Fundamentally, the recovery in private investment is a positive development for the overall economy, but will take time for the effects to be felt.
These are the facts, but what are the implications?
To be frank, it’s difficult to pinpoint exactly what this means going forward considering that we’re talking about economic growth that occurred in October through December 2022. Backward-looking economic data only tells us where we’ve been, not necessarily where we’re going. Essentially, you can’t drive a car by utilizing only the rear-view and side mirrors. Forward-looking economic data still appears bleak, in my view, though I certainly acknowledge that the likelihood of the Fed achieving a soft landing is at an all-time high. At the end of the day, we should all be rooting for the soft landing outcome, wherein growth either decelerates or is anemic (see Q1 & Q2 2022) while inflation moderates.
With increasing announcements about layoffs, particularly in the tech sector, we should likely see some softness materialize in the labor market. Notably, we’ve seen recent layoff announcements by the following companies:
Amazon AMZN 0.00%↑ (18,000 jobs)
Alphabet GOOGL 0.00%↑ (12,000 jobs)
Microsoft MSFT 0.00%↑ (10,000 jobs)
Salesforce CRM 0.00%↑ (8,000 jobs)
International Business Machine IBM 0.00%↑ (3,900 jobs)
Goldman Sachs GS 0.00%↑ (3,200 jobs)
Lam Research LRCX 0.00%↑ (1,300 jobs)
Hasbro HAS 0.00%↑ (1,000 jobs)
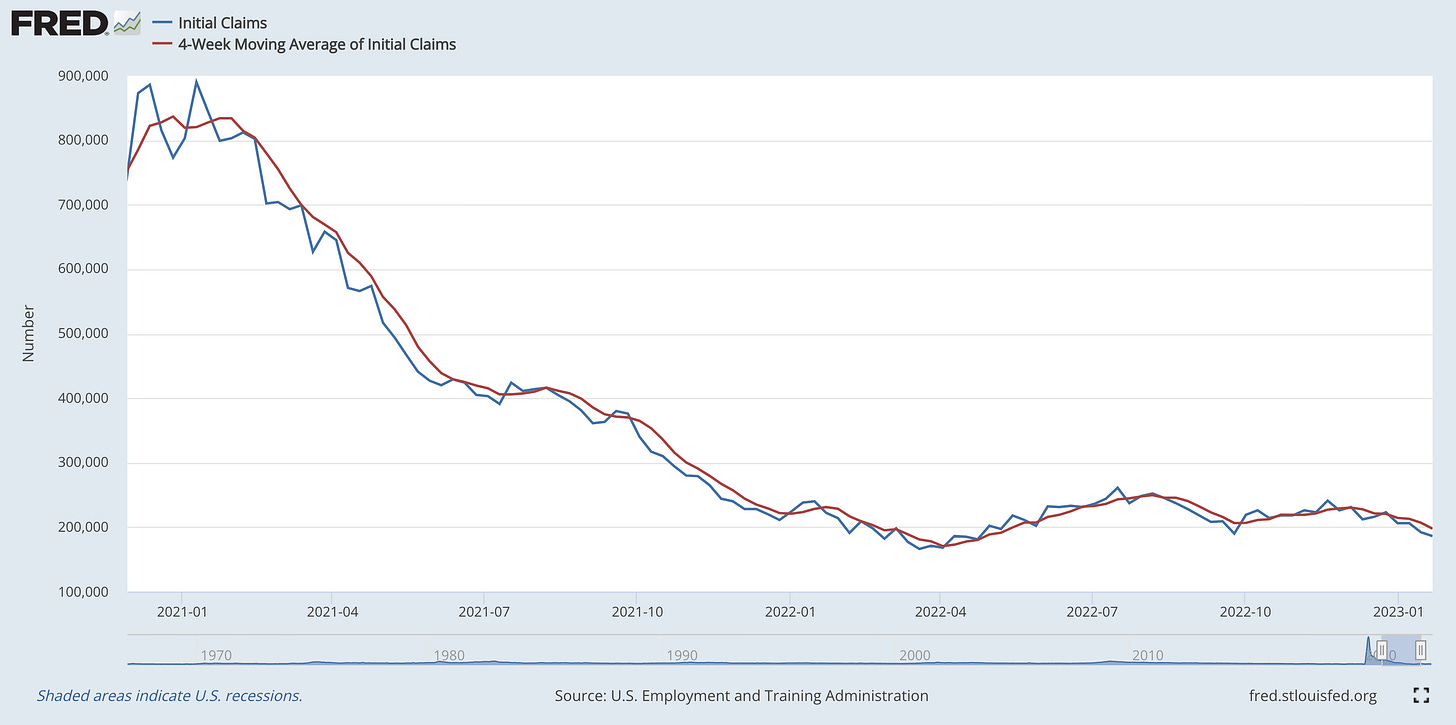
With all of these announcements predominantly occurring within the past several weeks, we haven’t seen initial unemployment claims increase. In fact, initial claims have been falling and are at historically low levels!
Weekly initial unemployment claims were 186,000 in the most recent week, falling from 192,000 in the week prior. The 4-week moving average of initial claims has declined from 219,250 in mid-October 2022 to 197,500 in the latest report for January 21st, 2023. It will be vital to watch this data in particular over the coming weeks; however, the latest announcements of layoffs appear to be fueling a “White Collar” labor market deterioration for now. I don’t think there’s cause for concern regarding the labor market (right now) considering that these are some of the most marketable & skilled people within our workforce.
Stock Market:
I want to keep this short and sweet, because I have some big alpha to drop in tomorrow’s premium newsletter. I think there’s one thing everyone should have on their radar, which is the fact that each of the major U.S. indexes are now trading above their respective 200-day moving average clouds.
Statistically, this represents a massive shift in market dynamics. The last time each of the indexes were trading above their respective MA’s was during the first trading week of 2022, when the S&P 500 and Dow Jones Industrial Average were hitting all-time highs. By the end of January 2022, each of the indexes fell below their respective 200-day MA’s and the bear market ensued. Therefore, the 200-day moving average provides a simple & concise method for measuring the pulse of the market and the potential (key word) strength of the trend.
With each of the major indexes now trading above their 200-day MA’s, I think probabilities remain to the upside, so long as we remain above the 200-day MA’s. Therefore, if/when the indexes fall below these dynamic levels, that would be sign for caution and concern. Until then, party on.
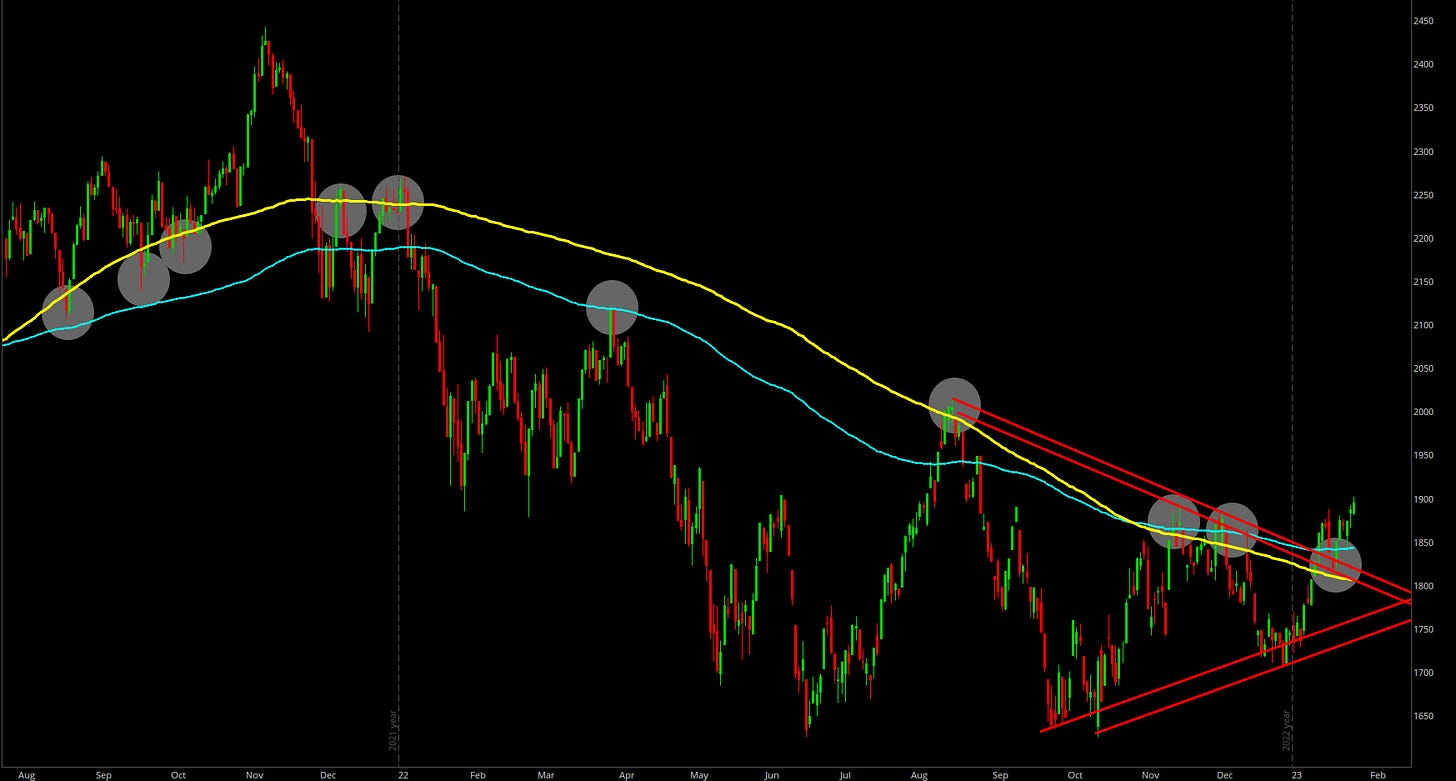
Let’s briefly look at each of the major indexes, with the 200-day exponential moving average in teal and the 200-day simple moving average in yellow:
1. Dow Jones Industrial Average $DJX: The Dow flipped above the 200 MA cloud in November and already flipped it into dynamic support in December. This retest happened to align perfectly with the upper-bound of the descending channel. Overall, this is a bullish setup and price action has continued to develop in a bullish manner. The index is now trading within a green wedge, which could provide further clues about future market direction depending on if we break above or below the wedge.
2. S&P 500 $SPX: The S&P 500 closed the week by officially breaking & closing above the red channel for the first time. The index closed above this level on Thursday & confirmed the breakout during Friday’s session. The index has now closed above the 200-day moving average cloud for 5 consecutive trading sessions, a pivotal accomplishment for the market. However, this doesn’t mean that we’re out of the woods! As we can see, market dynamics in February, March, December 2022 had multiple trading days were the index traded above the 200-day moving average cloud. Once the index fell back below this dynamic range, notably in February & March, the market experienced a deep drawdown. Everyone and their mother is watching the channel breakout that occurred on Thursday & Friday, so I wouldn’t be surprised if this is a “fake breakout” which reverses course. I might eat my words on that, but I think it’s objectively diligent to remain flexible and nimble around this area. The 200-day moving average is the line in the sand, for me personally.
3. Nasdaq-100 $NDX: The tech-focused index had a massive week, generating a weekly return of +4.7%. It was the weakest index in 2022, so it has the weakest trend relative to the 200-day moving average. Nonetheless, the index managed to close above the 200-day MA cloud on Friday’s session while closing above the descending channel for each day of the week! This is a massive win for tech stocks, on the aggregate. However, similar to the S&P 500, this doesn’t mean that we’re out of the woods. One might notice that the last time the Nasdaq secured a daily close above the 200-day MA cloud was on March 29th, just prior to falling -27.5% over the subsequent 56 trading days. To repeat, there is nothing magical or guaranteed about closing above the 200-day MA cloud. The only thing that matters is that the indexes stay above them! Friday’s close secured step #1 of this process (getting above it), but now we need to secure step #2 by staying above it. As of Friday, the index is trading at its highest level since September 13, 2022.
4. Russell 2000 $RUT: Small cap stocks are also performing very well in this environment, with the Russell having closed above its 200-day moving average cloud for 9 days in 2023 so far. In fact, the Russell even used the dynamic range as perfect support (similar to the Dow Jones) before continuing to extend higher. Quite clearly, we can see that the Russell has behaved very consistently around the 200-day MA cloud range, both as support and resistance since August 2021. With the latest breakout, retest, and rebound, the market is providing us a clear signal that the Russell wants to keep grinding higher. Whether it actually delivers on this desire is certainly up for question, but the 200-day MA cloud will continue to provide meaningful signals to market participants who are utilizing it. The recent price action appears to have broken out of an interesting wedge as well, which was then flipped into support at the same time as the 200-day MA cloud. This is called “confluence”, where multiple structural levels & indicators align at the same level. Typically, these provide a strong signal depending on the direction of the market… this one just happens to be a bullish.
Bitcoin:
With risk assets generally performing well this past week, Bitcoin continued to exhibit upside momentum as well. The premier digital currency managed to produce a gain of +1.85% Friday-over-Friday. At the time of writing, BTC’s exchange rate is equivalent to $23,100. Notably, while Bitcoin did produce a weekly gain, it didn’t experience the same momentum as the broader stock market indexes!
In fact, BTC denominated by each of the 4 major indexes actually produced a negative weekly return, indicating that stocks outperformed Bitcoin this past week.
Regarding BTC relative to stocks, there are two particular charts I want to highlight:
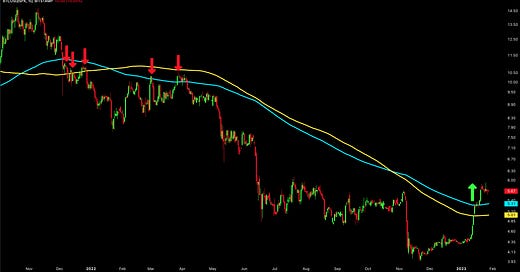
1. Bitcoin vs. the S&P 500, with the 200-day moving average cloud: If you haven’t noticed already, I like using this indicator quite a bit. Similar to the developments we’re seeing in the stock market, breaking above the 200-day MA for the first time in a long time, BTC vs. the S&P 500 is doing the same thing. However, it’s an even more resounding trend reversal considering that it acted as resistance so clearly during the bear market downtrend. Now that BTC/SPX has broken above the 200-day MA cloud, there’s a strong chance that it acts as support if/when we retest it again in the near future. However, if BTC/SPX fails to rebound on this dynamic support & resistance range, that could provide an important signal that BTC is going to lose even more momentum relative to the S&P 500.
2. Bitcoin vs. the Nasdaq-100: The chart below is looking at more long-term market dynamics, highlighting the pivotal support/resistance range that was derived from the peak in 2019. We can see that this level (red range) acted as a breakout launchpad in late-2020/early-2021, support in mid-2021, and resistance in the second-half of 2022. With BTC/NDX coming back into this potential resistance area, it just so happens to align perfectly with the 200-week moving average cloud. Historically this 200-week MA cloud has acted as near-perfect support within a macro uptrend; however, it flipped into resistance for the first time in Bitcoin’s history during 2022. We were rejected on this dynamic range 2x last year, both of which aligned perfectly within the red range. Again, this is called confluence; however, it’s materializing in a bearish manner this time. As such, I think it’s diligent to be cautious on Bitcoin relative to technology stocks until BTC/NDX can break above this red range & the 200-week MA cloud. There’s still reason to be optimistic, but I always like to focus on the potential risks associated with any given market.
Fundamentally, the value of the Bitcoin monetary network continues to improve as the adoption of BTC continues to grow over time. While the exchange rate of Bitcoin has been volatile, perhaps by design, it’s important to remember that we’re talking about a nascent technology that’s 14-years old. The network was designed to operate and grow into the bedrock of the future monetary system, hopefully to persist for decades and centuries to come. In many ways, Bitcoin’s volatility at this stage of its lifecycle is a feature, not a bug. For those investors who continue to believe in the fundamental value proposition of a permissionless, decentralized, immutable, and programmatic monetary network with a capped maximum supply and a supply schedule engineered to become increasingly scarce over time, this volatility feature provides opportunity.
Best,
Caleb Franzen
DISCLAIMER:
This report expresses the views of the author as of the date it was published, and are subjected to change without notice. The investment thesis, security analysis, risk appetite, and time frames expressed above are strictly those of the author and are not intended to be interpreted as financial advice. As such, market views covered in this publication are not to be considered investment advice and should be regarded as information only. Everyone is responsible to conduct their own due diligence, understand the risks associated with any information that is reviewed, and to recognize that the information contained herein does not constitute and should be construed as a solicitation of advisory services. Cubic Analytics believes that the information & sources from which information is being taken are accurate, but cannot guarantee the accuracy of such information.
This report may not be copied, reproduced, republished or posted without the consent of Cubic Analytics and/or Caleb Franzen, without proper citation & reference.
As always, consult a registered financial advisor and/or certified financial planner before making any investment decisions.







Great article Caleb, do you expect any new SPX lows late 23 or early 24 ? Darius dale speaking of goldi lock problem is also considerably interesting