Investors,
Roughly 37% of stocks in the S&P 500 have reported their Q3’24 earnings.
Of this cohort of companies, 75% of them are beating net income expectations & 59% of them are beating revenue expectations, with a blended net profit margin of 12%.
The fact of the matter is that U.S. corporations have rock-solid fundamentals & are the best companies in the world at creating value for shareholders.

Is the stock market cheap?
At 21.7x forward 12M earnings, the S&P 500 is certainly not cheap.
In fact, I’ll even concede that the stock market is expensive… and yet, I’m still bullish because I recognize one simple truth: things are usually expensive for a reason.
In fact, the best products in the world are expensive (on both an absolute basis and relative to their competitors).
Do you know what else is expensive?
Patek Philippe, Loro Piana, Rolls Royce, Cartier, real estate in Beverly Hills.
They are expensive because there is so much demand to own them.
Of course, branding & marketing help to elevate the reputation and create an allure around their ownership; however, expensive things are typically expensive for a reason.
The artisanship & exclusivity of a Patek Philippe Nautilus with a perpetual calendar, which sells on the secondary market for more than $200k, is infinitely more desirable than a Casio G-Shock, even though they both tell the same time.
Why? The craftsmanship, the design, the materials, the rarity, etc.
A Rolls Royce Phantom, which retails $475k, will still take you from point A to point B the same way as a Honda Civic; however, a wide range of reasons make it 20x more expensive than a Civic.
Does a Rolls Royce necessarily command a 20x premium vs. a Civic?
Are all of the materials & components worth 20x more than that of a Civic?
I don’t necessarily think so (or know for that matter), but the numbers don’t lie…
The trend of Rolls Royce sales from Statista speaks for itself:
Rolls Royce is expensive, but that doesn’t mean that demand is weak or stale.
On the contrary, as the data shows, demand is strong & accelerating!
So when U.S. stocks have the best earnings, the best access to capital, the best management teams, the best balance sheets, and the best opportunities for future growth, why shouldn’t they be expensive?
The S&P 500 is the Rolls Royce of the stock market.
By definition, the S&P 500 should be expensive!
In the remainder of this report, I’m going to cover the key charts & data that I saw this week that are helping me to understand broader market conditions.
But first, I want to thank the amazing team at REX Shares for their continued support of Cubic Analytics, so please be sure to send them a visit and read about their amazing list of exchange-traded products here.
Let’s begin.
Macroeconomics:
The Citigroup Economic Surprise Index is making new highs, hitting the highest levels since April 2024:

After dipping into negative territory in Q2 & Q3’24, indicating that economic data was softer and/or weaker than expected, the index has rapidly reaccelerated since the July 2024 lows.
This means that macro data is coming in better and/or stronger than expected.
Typically, good things happen when at least one of two things are true:
The Economic Surprise Index is positive.
The Economic Surprise Index is accelerating.
Right now, both are true.
Given the sharp acceleration since the July 4th lows (literally the start of Q3’24), I think the Q3’24 real GDP data is going to be a great report. The Q3 data will be published this upcoming week, which will be sure to move markets. At the present moment, the Atlanta Fed’s GDPNow estimate is forecasting +3.3% annualized growth.
Meanwhile, the New York Fed’s Nowcast is predicting +2.91% growth.
Either way, real growth is 99.9% certain to remain in firmly positive territory in Q3.
By definition, that means we aren’t in a recession, despite the endless “the sky is falling!” remarks from Doomers and macro bears.
Stock Market:
The market experienced a bit of pressure this week, but nothing out of the ordinary.
While the S&P 500 fell -0.92% during the week, more sensitive tech indices like the Nasdaq-100 actually managed to squeak out a gain of +0.17%.
To me, this illustrates two things:
Growth is outperforming value.
Mega caps are outperforming small caps.
But let’s take a minute & just verify that these dynamics are true.
Growth vs. Value (VUG/VTV):
Looks like an uptrend to me, rebounding on its 200-day EMA band and reaching the highest levels since mid-July 2024.
Mega Caps vs. Small Caps (MGC/VB):
Structurally, this looks very similar (though not identical), illustrating how mega caps are trying to regain upward momentum vs. small caps.
In my view, both of these charts can be merged into the relationship between mega-cap growth and the Russell 2000 (MGK/IWM):
Premium members know that I’ve been steadfast in my belief that mega caps & growth will regain their momentum vs. their alternatives and it looks like we’re seeing that follow-through take place right now.
The next step: new highs for growth relative to value & for mega caps relative to small caps.
Bitcoin:
I think it’s important to zoom out & think, objectively, about where Bitcoin is trading.
First of all, Bitcoin is currently trading right around $67,000.
The market is bored & there’s hardly any enthusiasm, from bulls or bears alike.
It’s almost like no one even cares that a single Bitcoin is trading for $67k with a total market capitalization of $1.325Tn (yes, trillion with a “t”).
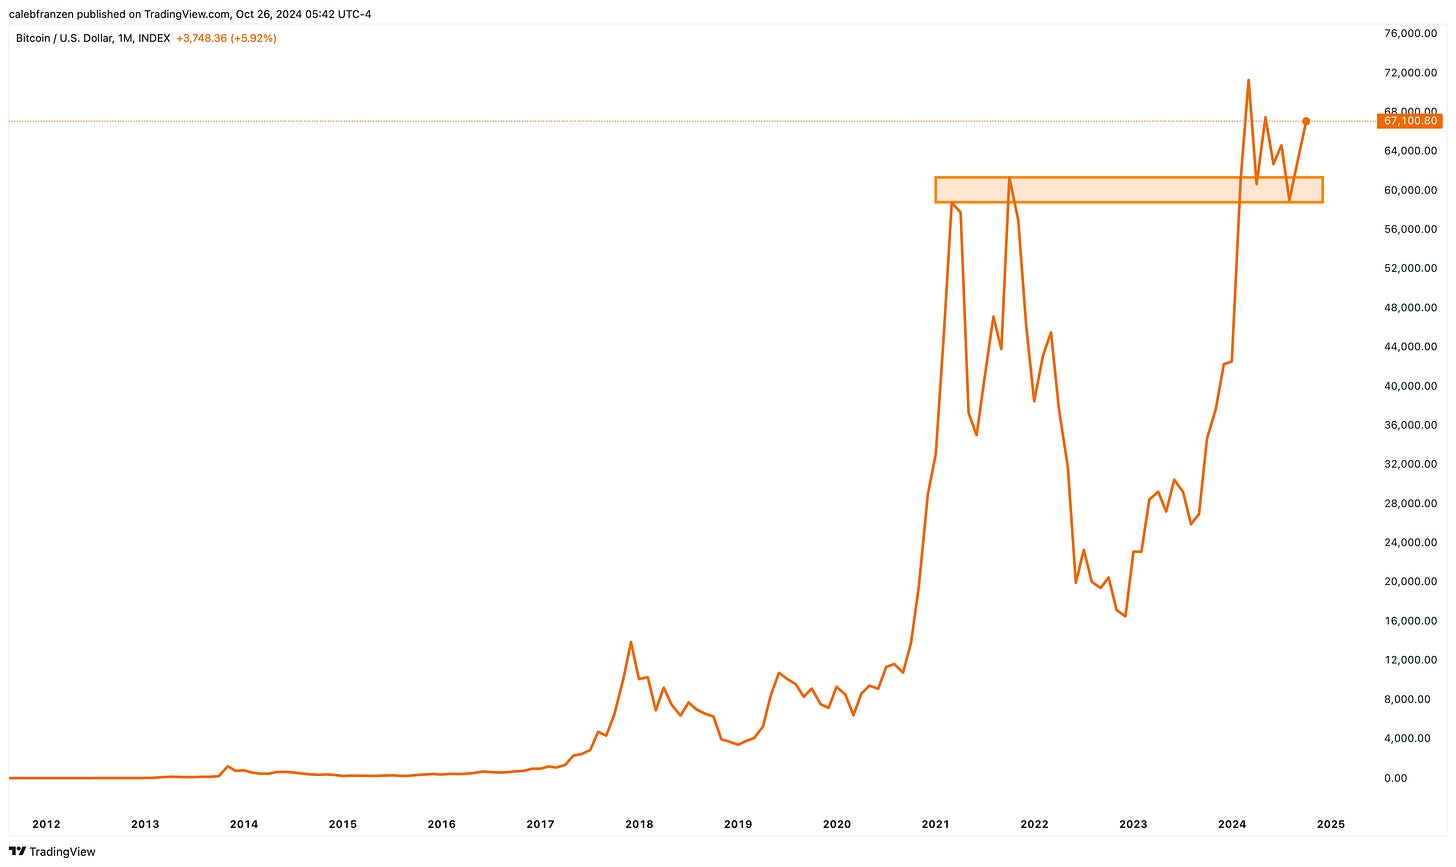
Either way, let’s zoom out and evaluate Bitcoin’s price structure with monthly candles:
All I see is that former resistance (2021 ATH monthly closes) is turning into support.
If we remove the noise from the intra-month wicks and just look at the monthly closing levels, we see a much cleaner version of the price action:
I think there is sufficient justification to be hyper-bullish on BTC so long as price stays above this orange zone, essentially remaining above $59k. If $58.8k is lost at a monthly close, then I think objective investors and traders should recognize that the trend has materially shifted and that the bullish “breakout, retest, rebound” setup has failed.
Until then, party on.
Best,
Caleb Franzen,
Founder of Cubic Analytics
This was a free edition of Cubic Analytics, a publication that I write independently and send out to 11,000 investors every Saturday. Feel free to share this post!
To support my work as an independent analyst and access even more exclusive & in-depth research on the markets, consider upgrading to a premium membership with either a monthly or annual plan using the link below:
SPONSOR:
This edition was made possible by the support of REX Shares, a financial services and investment company that creates an array of unique investment products and ETNs.
I first collaborated with the REX Shares team in 2023 because I’ve been using their products as trading vehicles since 2022 and it was an organic & seamless fit. They have a unique product-suite, ranging from leveraged products, to inverse products, and income-generating products.
They recently listed their brand new and unique funds, providing directional leveraged exposure to Microstrategy. Whether you’re a bull or a bear on BTC or MSTR, these funds could provide significant opportunities, especially because there’s nothing like it in the rest of the market.
Please follow their X/Twitter and check out their website to learn more about their services and the different products that they offer. The REX Shares team did not have any say about the specific language, analysis, or commentary contained in this report
DISCLAIMER:
This report expresses the views of the author as of the date it was published, and are subject to change without notice. The author believes that the information, data, and charts contained within this report are accurate, but cannot guarantee the accuracy of such information.
The investment thesis, security analysis, risk appetite, and time frames expressed above are strictly those of the author and are not intended to be interpreted as financial advice. As such, market views covered in this publication are not to be considered investment advice and should be regarded as information only. The mention, discussion, and/or analysis of individual securities is not a solicitation or recommendation to buy, sell, or hold said security.
Each investor is responsible to conduct their own due diligence and to understand the risks associated with any information that is reviewed. The information contained herein does not constitute and shouldn’t be construed as a solicitation of advisory services. Consult a registered financial advisor and/or certified financial planner before making any investment decisions.
Please be advised that this report contains a third party paid advertisement and links to third party websites. The advertisement contained herein did not influence the market views, analysis, or commentary expressed above and Cubic Analytics maintains its independence and full control over all ideas, thoughts, and expressions above. The mention, discussion, and/or analysis of individual securities is not a solicitation or recommendation to buy, sell, or hold said security. All investments carry risks and past performance is not necessarily indicative of future results/returns.
Each investor is responsible to understand the investment risks of the market & individual securities, which is subjective and will also vary in terms of magnitude and duration.


Nice write up. thanks!
RE: Bitcoin, we might want to move past the "crypto-enthusiast" lens and apply a more "real-world" lens to future price projections. The approval of spot ETFs was both a blessing and a curse. It brought in many more new buyers and owners who are not necessarily HODLers who will buy the dip en masse...unless they see a strong reason to do so. Without any data to back up this POV, I would contend that most of the trading volume in BTC is spot ETFs and it is dependent on AUM flows in these ETFs. US investors of all ages, retirement funds etc...they are not diamond hands and laser eyes...they will not see a chart like this and jump all in. They will move in and out of BTC based on broader macro signals and asset allocation goals. At this time I own BTC as a geopolitical hedge...will evaluate what to do with my position in Q1 2025...based on geopolitics at that time..based on the macro signals of that time.
Cheers and thanks again for a very nice write up! Keep them coming please.
Timely bullishness!