Investors,
After a week of intense downside at the start of April and then a week of intense upside, it was nice to see the market calm down and actually be relatively uneventful.
In the past three weeks, the S&P 500 has generated the following weekly returns:
March 31st - April 4th: -9.1%
April 7th - April 11th: +5.6%
April 14th - April 17th: -1.5%
While a loss of -1.5% isn’t something to celebrate in a vacuum, this past week felt like a period of digestion & indecision as the market fluctuated between “up a little” and then “down a little”.
While the dust eventually settled on “down a more than just a little”, a loss of -1.5% is more favorable than the precipitous declines over the past two months.
But here’s the weird (and potentially concerning) thing…
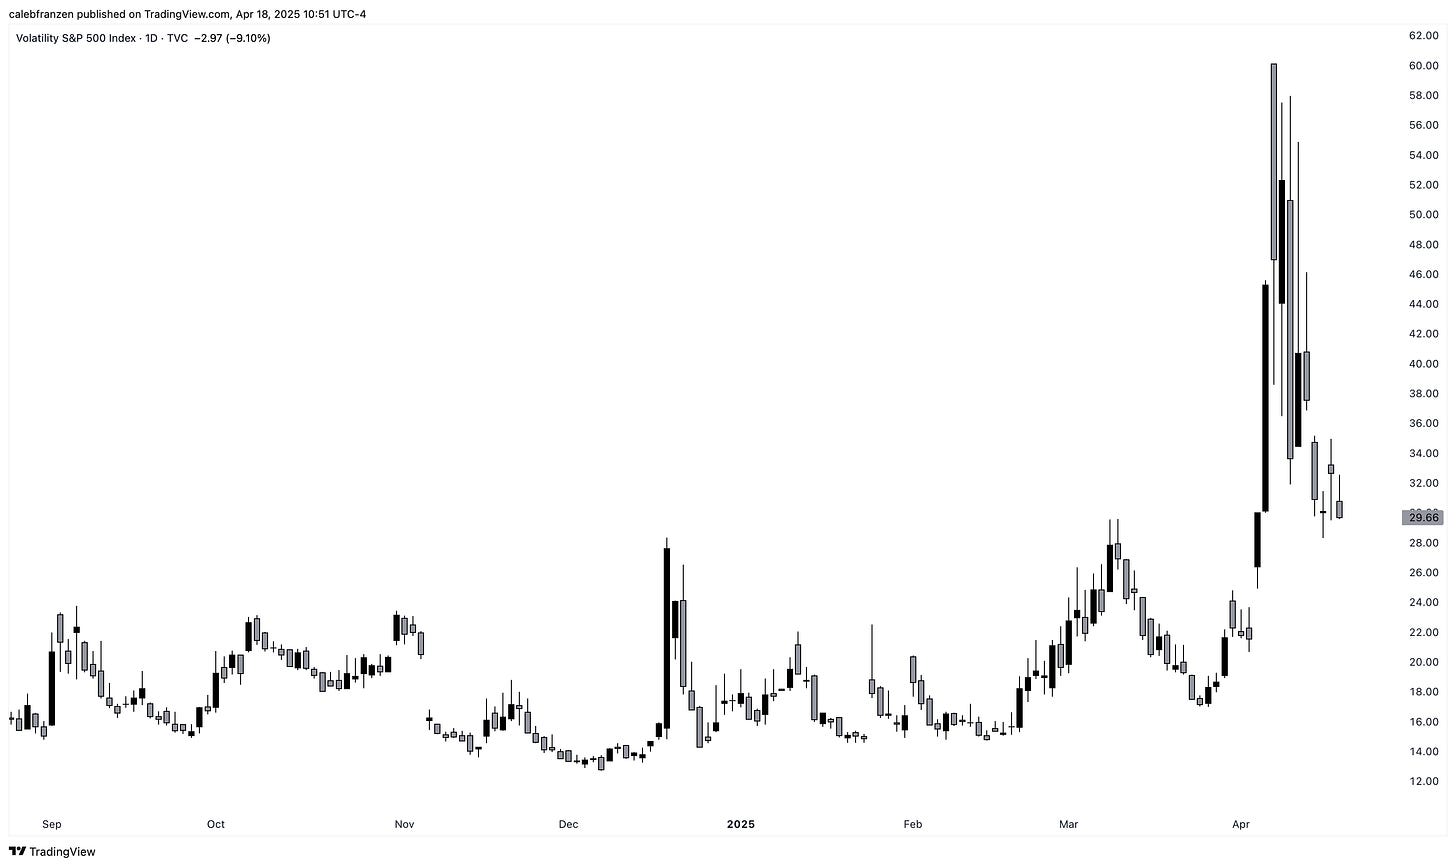
The market failed to rally in a week where the Volatility Index ($VIX) plummeted!
Specifically, the VIX fell -21% this past week.
Yet investors weren’t able to push the market higher amidst lower volatility?
Weird…
Something doesn’t add up!
Risk-on vs. risk-off ratios also haven’t been able to improve materially over the past two weeks, highlighting a lack of conviction in the sustainability of the recovery.
Look at high beta stocks relative to low volatility stocks (SPHB/SPLV):
This ratio has barely recovered off the lows, indicating suppressed risk appetite, with a clear shift in character from producing higher lows to producing lower lows on multiple timeframes.
Why is this particular ratio so important?
Because it has a strong correlation with the stock market, particularly the Russell 2000:
⚫ SPHB/SPLV
🔴 Russell 2000 (IWM)
When high beta stocks outperform low volatility stocks, the Russell 2000 rises.
When high beta stocks underperform low volatility stocks, the Russell 2000 falls.
But the Russell 2000 isn’t the only index correlated to SPHB/SPLV, as the relationship has been extremely effective for the S&P 500 on a shorter timeframe:
⚫ SPHB/SPLV
🔵 S&P 500 (SPY)
With both continuing to look heavy, as if they want to sweep back to the local lows from early April, I see too many investors throwing money at the market as they attempt to catch a falling knife.
Maybe that strategy will pay off.
In fact, over a long enough time frame, I’m quite certain that it will pay off.
Whether it takes 6 months, 1 year, 3 years, or 5 years, I’m confident that the S&P 500 will make new all-time highs again at some point.
But what is the cost associated with making that bet right now?
In other words, there’s a platter of gold and cash with a hidden blade waiting to fall on an unsuspecting hand that tries to grab the money. Even if you think that a blade might be ready to fall towards your hand, is it worth the risk to grab the money?
Even if it only chops off one of your fingers, is the risk worth the reward?
Or instead, would it be safer to use a fake hand to trigger the blade and then reach in and grab the money after the trap is nullified?
For some of you, it might be worth the risk to grab as much money as you possibly can, as quickly as you can. For others, it’s more prudent to be tactical and wait.
I won’t tell you what your right answer is — only you can answer that.
But I’m encouraging you to look yourself in the mirror and be honest about which path you want to take and which one you’re better suited to endure.
For me, I’m opting for a tactical approach.
I need one of the following to occur:
More money needs to be added to the platter
The blade needs to be deactivated or neutralized
In other words, increase the returns or decrease the risk.
The same goes for Bitcoin, which is why I’ve paused DCA purchases in this range until we have further clarity on the nature of the trend. Premium members know exactly what I’m talking about and the criteria that I’ve laid out to determine if the uptrend is intact or if we’re officially entering a downtrend.
You can read that report here.
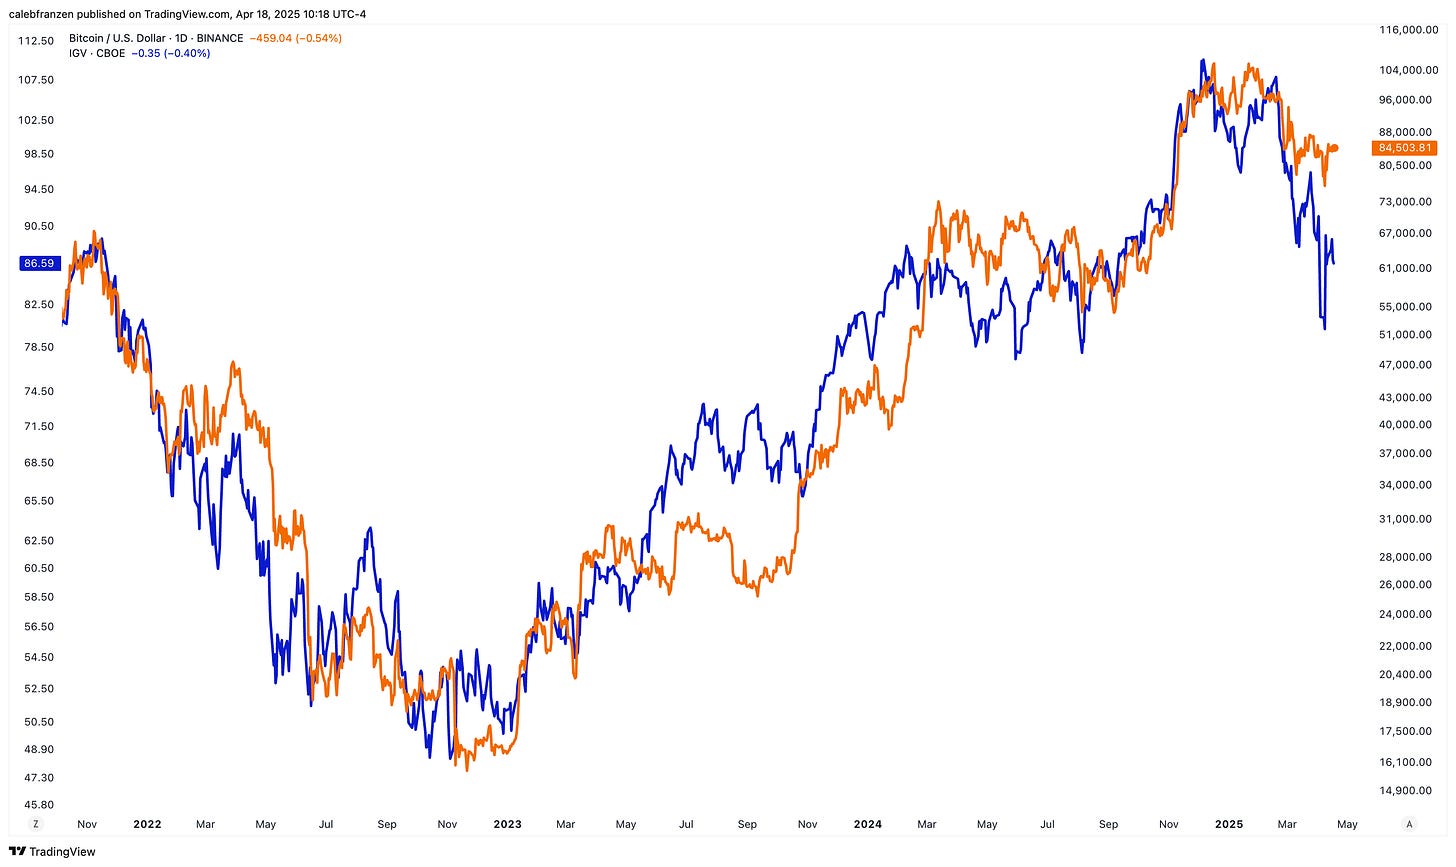
While I’ve been pleased with Bitcoin’s resilience in recent weeks, its long-term relationship vs. software stocks continues to be an effective tool for investors to use:
🟠 Bitcoin (BTCUSD)
🔵 Software stocks (IGV)
The widening gap can be interpreted in one of two ways. Either:
Bitcoin’s “strength” (really just “less downside”) is a leading indicator, suggesting that risk assets will regain upside momentum and ignite another rally.
Software stocks, which are also high-risk assets, are foreshadowing where Bitcoin is likely to go next, particularly if risk-off dynamics continue to persist.
Unfortunately, there is no in between.
For someone like me, who holds the significant majority of their net worth in Bitcoin, I don’t feel the need to buy more Bitcoin around these levels with the expectation of the foremost scenario.
If the upside scenario occurs and Bitcoin rallies higher, great — I’m allocated!
If the downside scenario occurs and Bitcoin falls more, my net worth falls even more!
At this stage, I’m focused on wealth preservation rather than wealth creation.
That’s how I’ve been since February when I first shared “The Charts That Scare Me” and immediately started to deploy a new strategy for a shifting market environment.
So far, that’s been the correct decision.
Thankfully, I have criteria in place to identify when we’ve returned back to a wealth creation environment, but I don’t have evidence of that yet, which is why I’ve been pounding the table on the fact that I’d rather be late and right than early and wrong.
I’m comfortable with my positioning, my outlook, and my process.
Can you say the same about your own?
Best,
Caleb Franzen,
Founder of Cubic Analytics
This was a free edition of Cubic Analytics, a publication that I write independently and send out to 13,500+ investors every Saturday. Feel free to share this post!
To support my work as an independent analyst and access even more exclusive & in-depth research on the markets, consider upgrading to a premium membership with either a monthly or annual plan using the link below:
There are currently 1,070+ investors who are on a premium plan, accessing the exclusive alpha and benefits that I share with them regarding the stock market, Bitcoin, and my own personal portfolio.
DISCLAIMER:
This report expresses the views of the author as of the date it was published, and are subject to change without notice. The author believes that the information, data, and charts contained within this report are accurate, but cannot guarantee the accuracy of such information.
The investment thesis, security analysis, risk appetite, and time frames expressed above are strictly those of the author and are not intended to be interpreted as financial advice. As such, market views covered in this publication are not to be considered investment advice and should be regarded as information only. The mention, discussion, and/or analysis of individual securities is not a solicitation or recommendation to buy, sell, or hold said security.
Each investor is responsible to conduct their own due diligence and to understand the risks associated with any information that is reviewed. The information contained herein does not constitute and shouldn’t be construed as a solicitation of advisory services. Consult a registered financial advisor and/or certified financial planner before making any investment decisions.
Each investor is responsible to understand the investment risks of the market & individual securities, which is subjective and will also vary in terms of magnitude and duration.


