Investors,
For the first time since I made my disinflationary call in December 2022, I’m concerned about the accuracy of my forecast.
No, that isn’t a joke.
Inflationary trends have implications for asset prices, and I intend on being on the right side of the market trend and helping to guide Cubic Analytics members on the best way to navigate the market.
As you all know, my fundamental belief in disinflation was one of the reasons why I was able to flip (and stay) bullish for the majority of 2023 — because disinflation is a bullish catalyst for stocks, historically.
I’m not in the business of being an accurate economist.
I’m in the business of making money as an investor, who uses macro as one of the tools within my toolkit to maximize my returns and take advantage of opportunities.
That’s why we’re all here, isn’t it? To make money?
Thankfully, that’s exactly what Cubic Analytics members have been doing, based on these two messages that I recently received from long-time clients.
With that being said, let’s get into the data and answer the question of whether or not re-accelerating inflation could actually be bullish for asset prices going forward…
Macroeconomics:
There are three major concerns that I have with the March 2024 CPI data:
The ongoing re-acceleration in Services Ex-Shelter inflation.
The first YoY re-acceleration in trimmed-mean CPI & stagnant median CPI.
The first YoY re-acceleration in Headline CPI Ex-Energy inflation.
Quickly, these are the three corresponding charts:
1. Services Ex-Shelter inflation was +4.77% YoY in March vs. +3.94% in February.
This marks the 5th of the past 6 months where the YoY figure has accelerated and it’s now rising at the fastest pace since April 2023, when it was decelerating.
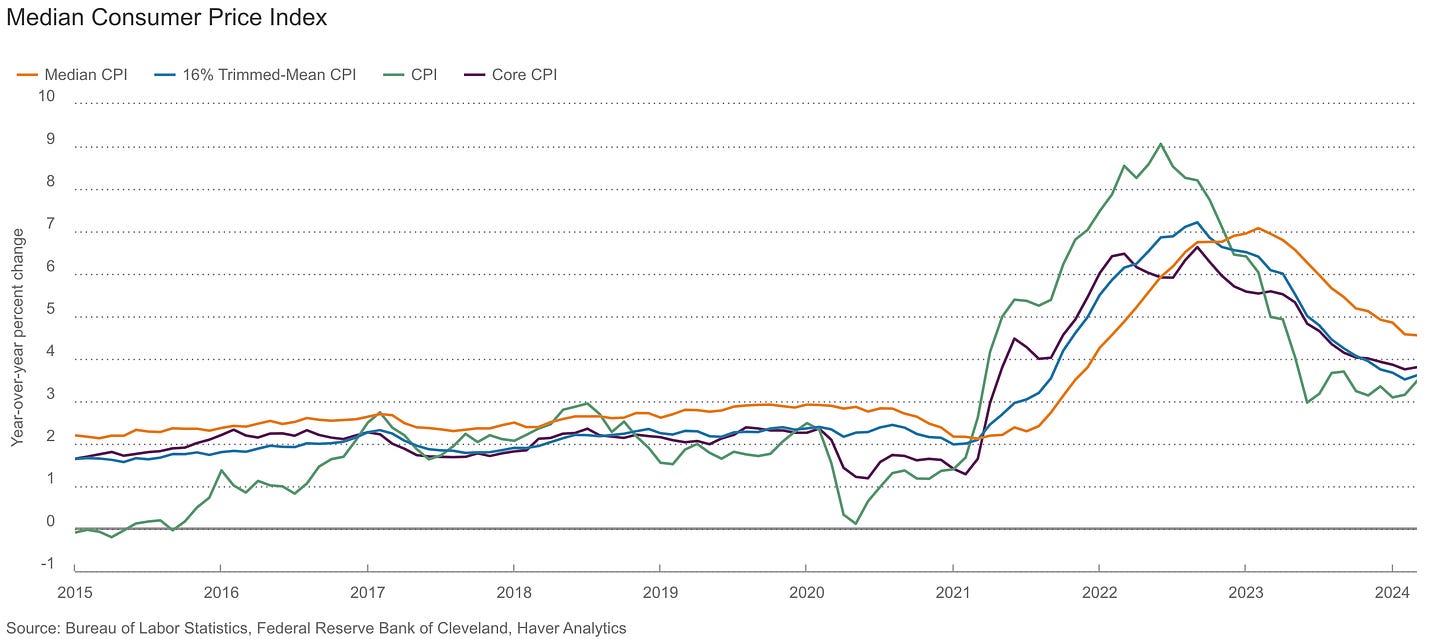
2. In the data below, focus on the orange and blue lines:
🟠 Median CPI was +4.55% YoY in March vs. +4.58% in February.
🔵 Trimmed-mean CPI was +3.61% YoY in March vs. +3.51% in February.
The stagnant evolution of median CPI is a concern for the disinflationary trend, especially because the stagnation during the September - November 2022 acceleration was one of the key reasons why I joined team disinflation in Q4’22.
Similarly, the uptick in the trimmed-mean CPI basket indicates that average CPI components are experiencing faster rates of inflation.
Clearly, it’s too early to tell (one month of re-acceleration doesn’t outweigh the trend), but this is unequivocally a concern for me and a win for Team Re-Inflation.
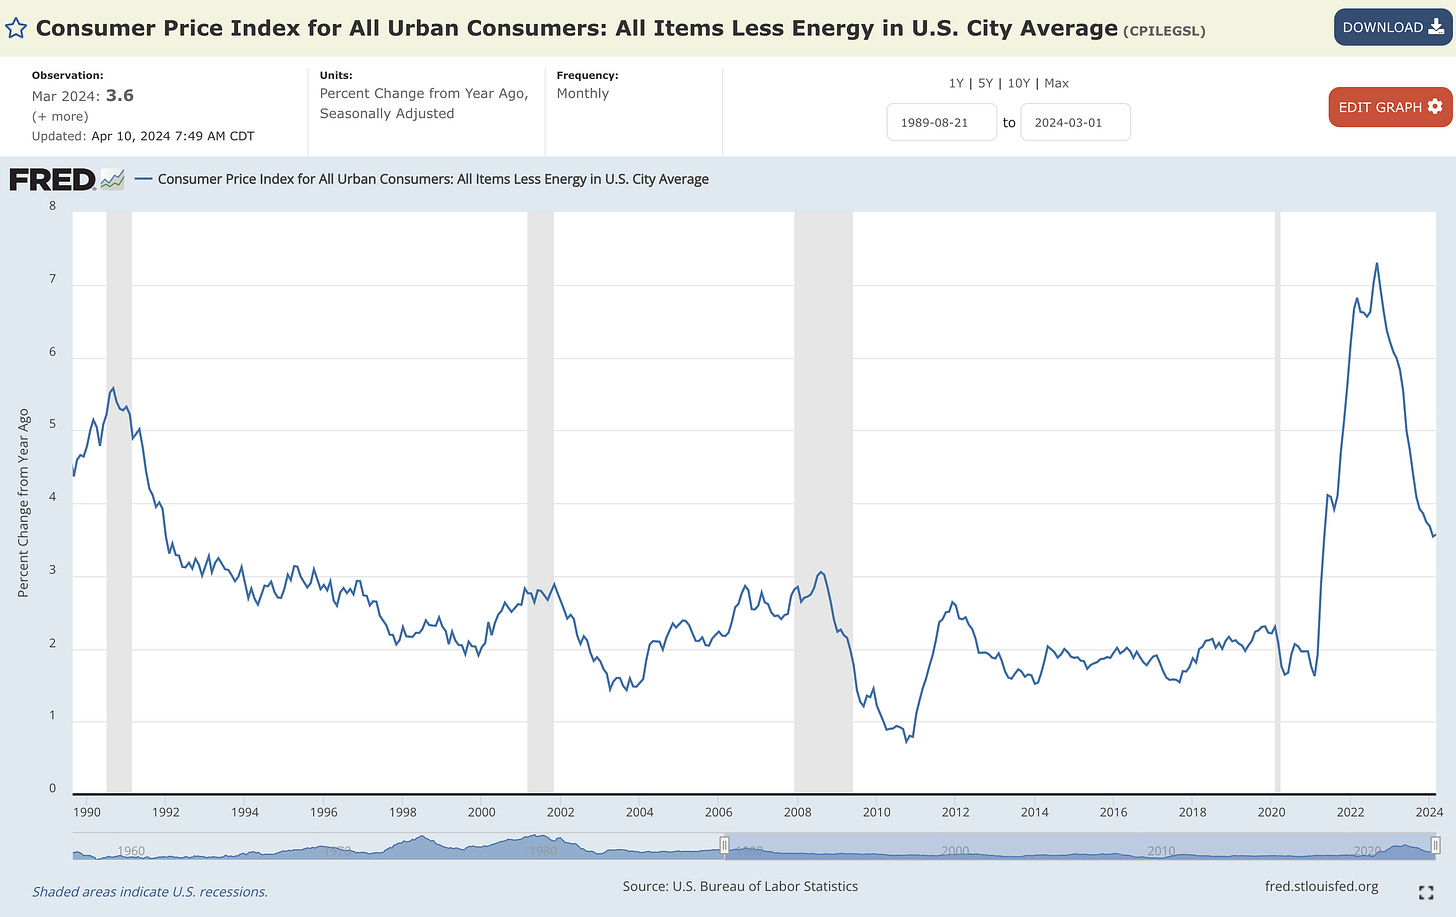
3. Headline CPI Ex-Energy inflation was +3.57% YoY in March vs. +3.54% in February.
This was a very modest acceleration, more akin to a stagnation, but it was the first increase in the YoY inflation rate from one month to the next since the figure peaked in September 2022. After decelerating for 17 consecutive months, this first uptick could be a sign that downtrend is ending.
On the aggregate, this data firmly suggests that:
Inflation is sticky
Disinflation is slowing
Inflation is accelerating
It’s clear that energy & commodity price dynamics are the primary catalyst for the recent re-acceleration (crude oil prices have gained +26% since their December lows); however, it’s also clear that the recent rise in energy prices is having a ripple effect on broader CPI components.
Whether or not energy prices will continue to rise is an unknown, and anyone who tells you that they have an answer is just outright lying or overflowing with hubris.
This is the exact same message that I said throughout Q3’23, when FinX was flooded with commentary that oil was going much higher and would cause inflation to re-accelerate.
Sure enough, crude oil rolled over, inflation cooled off again, and assets rallied.
While I am concerned about the recent inflation data, as I expressed in last month’s piece, I’m not ready to “call it quits” on disinflation yet.
Instead, here’s how I’m approaching this (for now):
There is a lower probability of disinflation going forward
There is a higher probability of accelerating inflation going forward
In turn, this reassessment of probabilities means that I should be reducing my bullishness on asset returns going forward, right?
Perhaps, but it’s not so clear…
Stock Market:
The reason why I said “it’s not so clear” regarding the impact of accelerating inflation on asset returns is because I simply looked at the historical data, which requires an important piece of nuance.
Rising inflation is not necessarily bad for asset prices.
High levels of rising inflation is certainly bad for asset prices.
Here’s what I mean:
🔵 Headline CPI ex-Shelter inflation on a YoY basis (left axis)
🔴 Nasdaq Composite Index (right axis)
Specifically, look at the periods from 1998-2000, 2002-2008, 2015-2020, and 2020-2021.
You’ll notice that each of these periods were characterized by accelerating inflation and a simultaneous uptrend for the Nasdaq Composite Index!
The Keynesian school of economics highlights how there is a positive relationship between economic growth and inflation, implying that rising prices are a result of strong demand and strong demand is a sign of a strong economy.
This chart provides quantitative proof that modest levels of accelerating inflation, which are correlated with periods of economic growth, are bullish for stocks!
The key caveat here is that inflation cannot get out of control or historically high.
During each of the periods where inflation and the Nasdaq Composite moved higher together, Headline CPI Ex-Shelter inflation stayed below +5% YoY for all but two months and it rarely ever exceeded +4%.
Therefore, based on this study, accelerating inflation between the rates of +1% and +4% seem to have bullish implications for asset prices.
With Headline CPI Ex-Shelter currently running at a rate of +2.3% YoY (up from +1.8% in the prior month), this suggests that upward momentum could actually be a positive catalyst for asset prices, so long as re-inflation doesn’t get out of control.
Given the market’s reaction on Wednesday and Thursday’s trading session, following the release of the CPI and PPI data, I think this theory isn’t unreasonable.
I will need to sit with these implications for a bit longer to make up my mind, but this was an extremely interesting datapoint that made me question the impact that rising inflation can have on asset prices.
Bitcoin:
Brutal consolidation on Friday, which was widespread across the entire crypto market and even in the stock market too.
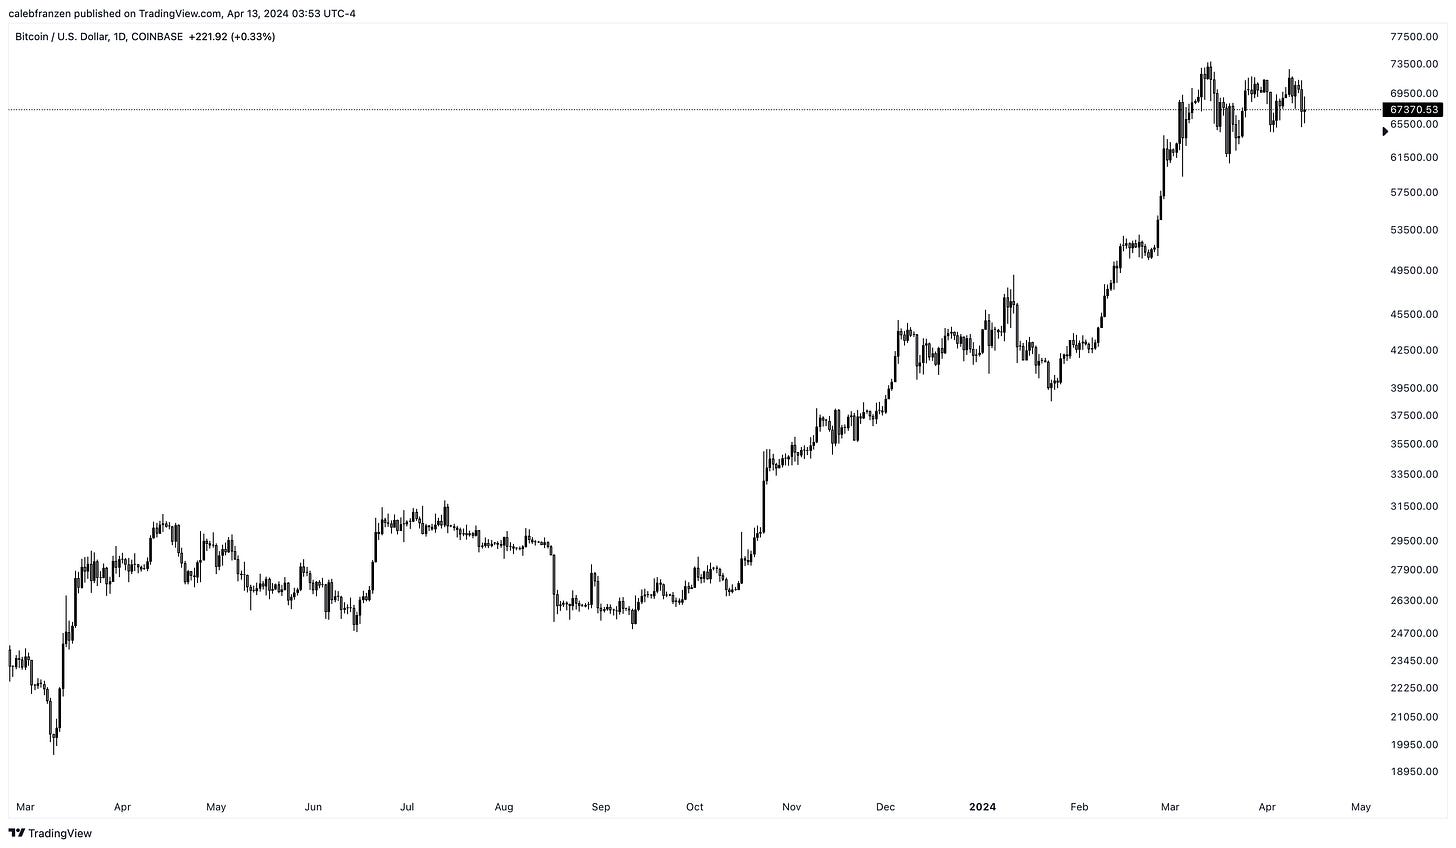
Bitcoin was not immune to the selling pressure, falling to $65,200 at the lows.
Sixty-five thousand, two hundred.
I think that context is important, especially because bears have been trying to take victory laps as if the asset isn’t up +60% YTD and +125% YoY.
Even now as I write this report, BTCUSD is trading at a respectable $67,370.
Selling pressure has abated (for now) and I’m optimistic that a higher low has formed.
In real-time on X, I foreshadowed that the decline was simply another opportunity for bulls to defend the uptrend structure and produce a higher low:
So far, that higher low has formed.
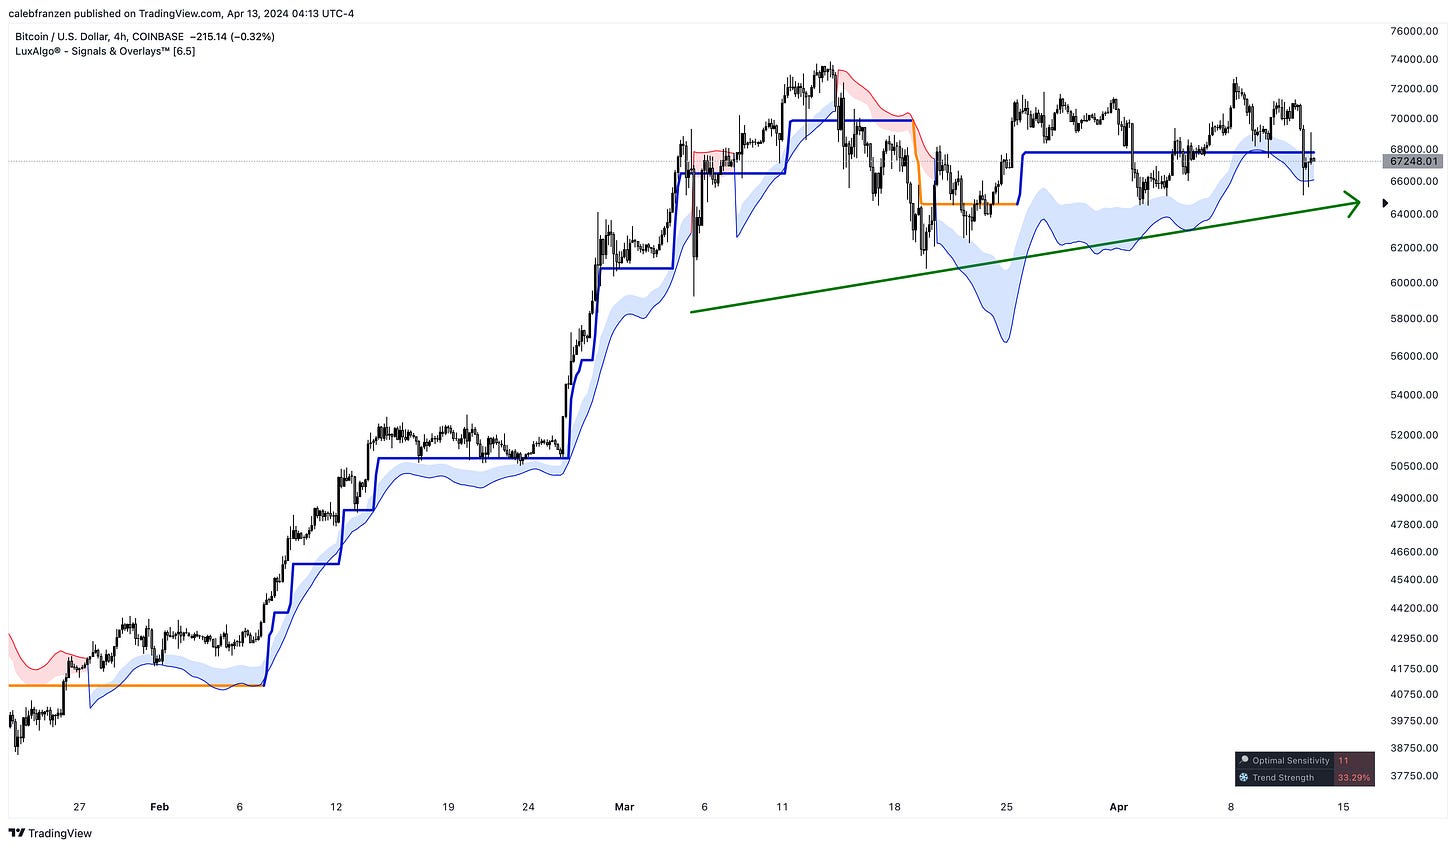
Taking a shorter timeframe perspective using 4hr candles, we can analyze this better:
You’ll even notice that the 4hr Smart Trail indicator from LuxAlgo is working consistently as dynamic support during these recent consolidations and that the trend is still bullish from a statistical perspective.
A similar dynamic is happening with 6hr candles also, showing that Bitcoin has done an excellent job of rebounding on the dynamic support band from LuxAlgo.
This latest pullback & retest of the Smart Trail isn’t guaranteed to rebound once again, but this signal helps us to assess probabilities, manage risk, and recognize that the trend remains in favor of the bulls.
While I remain prepared for a wide range of possibilities, I continue to believe that more upside is the likely outcome.
Best,
Caleb Franzen
DISCLAIMER:
This report expresses the views of the author as of the date it was published, and are subject to change without notice. The author believes that the information, data, and charts contained within this report are accurate, but cannot guarantee the accuracy of such information.
The investment thesis, security analysis, risk appetite, and time frames expressed above are strictly those of the author and are not intended to be interpreted as financial advice. As such, market views covered in this publication are not to be considered investment advice and should be regarded as information only. The mention, discussion, and/or analysis of individual securities is not a solicitation or recommendation to buy, sell, or hold said security.
Each investor is responsible to conduct their own due diligence and to understand the risks associated with any information that is reviewed. The information contained herein does not constitute and shouldn’t be construed as a solicitation of advisory services. Consult a registered financial advisor and/or certified financial planner before making any investment decisions.


Very interesting. Thanks for the insights.
Rising asset prices & inflation seems healthy. But, with the jobs data looking weaker (N.America; less full time&more 2 job workers), down pressure on consumer purchasing, would this anemic demand be a signal for lower asset prices into next few months?
Especially given the higher debt servicing, stagnant wages & lower purchasing power for the largest groups of the economy.