Investors,
The S&P 500 ($SPX) is 0.8% away from making a new all-time high.
Bitcoin ($BTCUSD) is 21.7% away from making a new all-time high.
This divergence is an interesting market development, highlighting how the recent resurgence in the stock market hasn’t rippled into the crypto market.
I decided to take this one step further & analyze the relative performance of BTC/SPX:
There are a few takeaways and/or implications from this development:
The underperformance of Bitcoin (and crypto more broadly speaking) is a sign that risk appetite isn’t rising during this stock market rally, or perhaps that crypto itself is dealing with idiosyncratic risks.
On the other hand, a continued stock market rally could inspire higher levels of investor confidence and facilitate a “catch-up” trade in Bitcoin & crypto.
From a structural perspective, one could argue that this is simply a bull flag, set to produce an eventual breakout and catalyze a larger rally to new cycle highs. Given the fact that BTC/SPX is in an uptrend, the classic phrase of “the trend is your friend” helps to explain why so many investors still have a bullish bias on BTC.
While Bitcoin’s recent lack of conviction has been worrisome and less than desirable, my belief is that the digital asset will produce new all-time highs so long as it does not have a material or sustained breakdown below $51,000 (currently trading at $60.7k).
Why $51,000?
I’ll explain in the “Bitcoin” section of this report, so make sure to read to the end!
Macroeconomics:
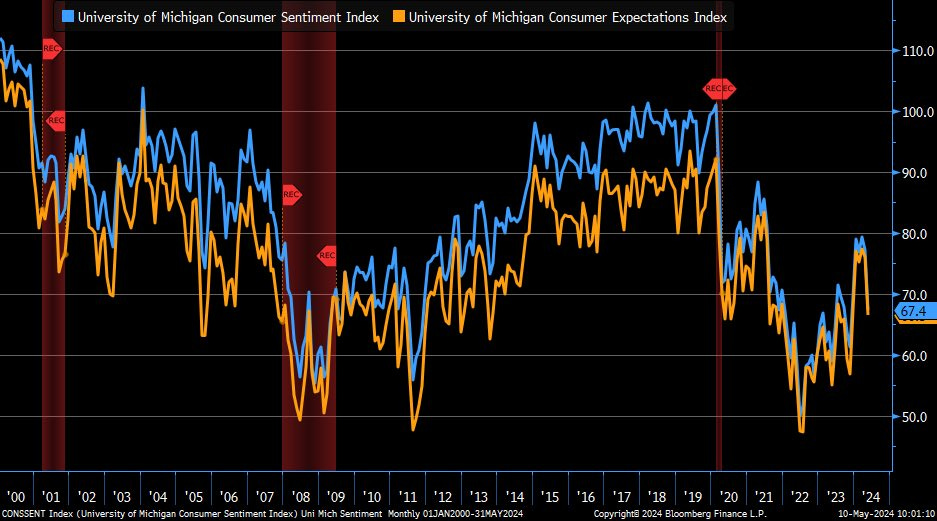
The biggest macro datapoint this past week was the preliminary University of Michigan survey data for May 2024, which significantly underperformed estimates.
Regarding consumer sentiment, the estimate was 76.2 but the result was 67.4.
There were substantial declines in readings for both current conditions and expectations about the future, highlighting some malaise within the economy.

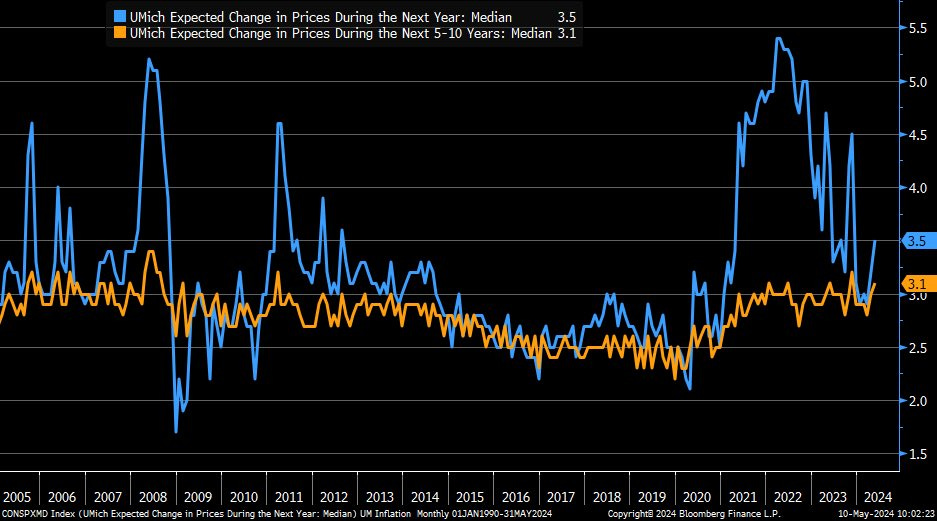
The biggest issue was the combined effect of worse consumer sentiment and an increase in 1-year inflation expectations, which were expected to come in at 3.2% but jumped to 3.5%. Meanwhile, long-term inflation expectations also increased.

Ironically, consumers are often the worst at forecasting consumer price inflation; however, it is important to acknowledge that inflation expectation can have an impact on actual inflation dynamics. Essentially, if consumers believe that prices are going to increase in the future, they might be more motivated to purchase consumer goods & services today, therefore leading to higher short-term demand and higher prices, which creates a recursive impact of higher inflation.
So expectations about inflation are certainly important… but the UMich survey, thankfully, isn’t the only datapoint that we have about inflation expectations.
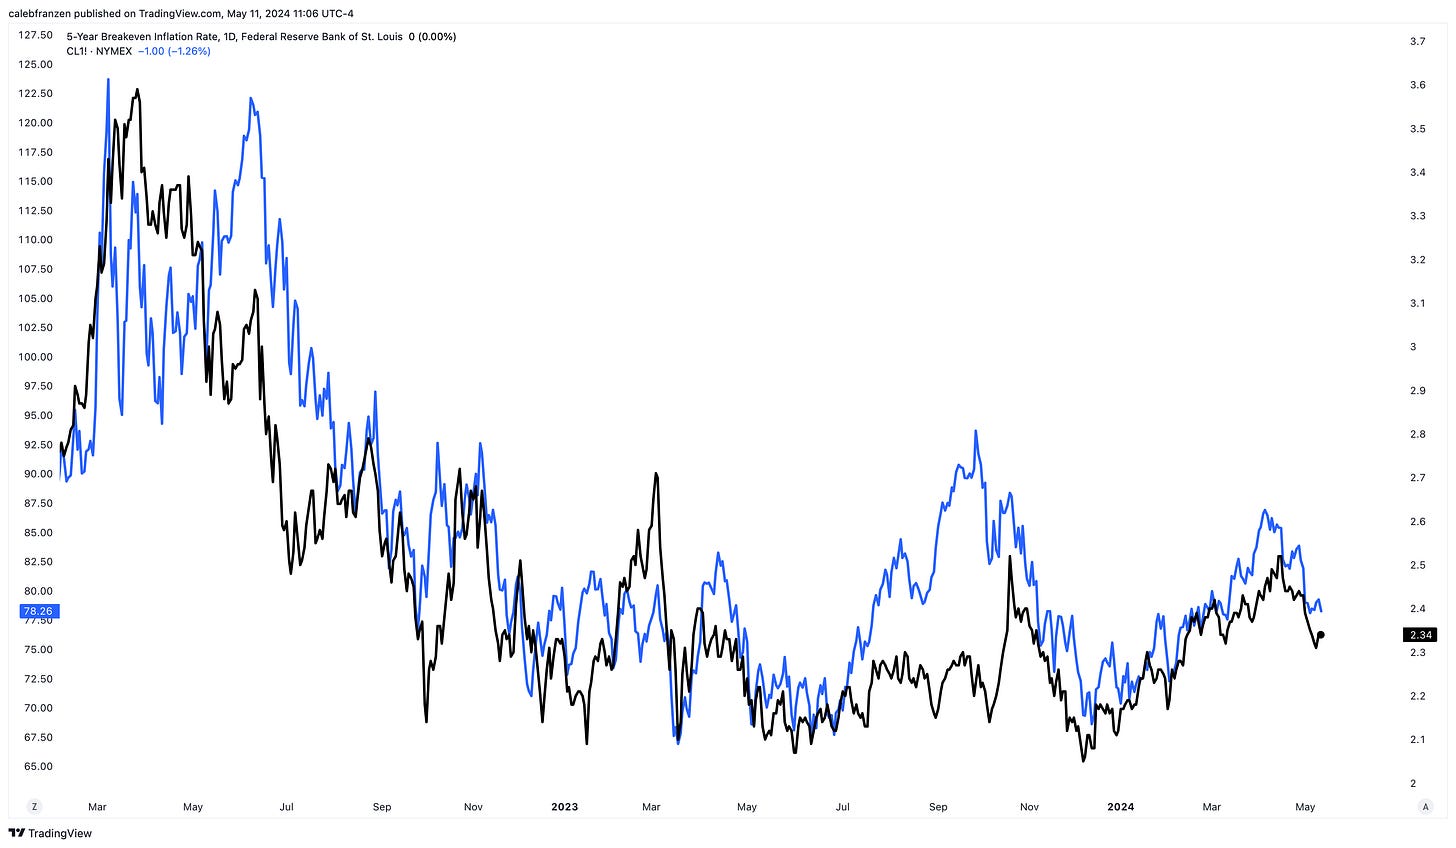
Notably, the 5-year breakeven inflation rate is the rate at which investors are looking to be compensated to offset inflation. This yield changes daily based on new macro data and it’s been declining for the past month after a recent resurgence.
Still, it’s clear that inflation expectations have been rising in 2024, largely due to the massive rally in crude oil since December 2023.
In fact, we can even overlay the price of crude oil futures onto the 5-year breakeven inflation rate and see just how tightly these two variables are correlated:
⚫ 5-year breakeven inflation rate (T5YIE)
🔵 Crude oil futures (/CL!)
This isn’t a new phenomenon either, as the correlation has a long-standing history:
The fact of the matter is that, while inflation is multivariate, it’s largely influenced by energy and oil prices. Crude oil has a clear impact on inflation expectations, which can in turn impact inflation itself. Therefore, the recent acceleration in crude oil prices to start 2024 have caused inflation and inflation expectations to reaccelerate.
However, crude oil appears to have put in a lower high and has now fallen below its 200-day moving average cloud, an important signal that likely foreshadows a larger decline in the coming weeks/months.
Based on the recent undercut of the 200-day moving average cloud and the subsequent retest and rejection that happened during Friday’s trading session, I wouldn’t be surprised to see crude oil prices fall back towards $72/barrel (or lower).
In turn, this will help to reduce inflation pressures, suppress inflation expectations, and hopefully produce another wave of disinflation and move the Fed one step closer to rate cuts.
Stock Market:
I usually start my Saturday morning by watching The Compound and Friends, from the team at Ritholtz Wealth Management, which you can watch here.
One chart from the episode caught my attention, highlighting the average two-year return of the S&P 500 at the start of each bull market going back to the mid-1900’s:
This chart is relevant because it reminds me of the report that I published in mid-March 2024, titled “Average Returns Are Great Returns”.
In that report, I highlighted how the trailing 2-year & 3-year returns of the S&P 500 were consistent with long-term historical returns, with a CAGR between 8% and 10%.
This chart above provides additional context by anchoring the starting point to the beginning of each bull market, showing us that the current bull market is tracking towards the average 2-year return. As I said in March, the current bull market is consistent with historical bull market trends and return profiles.
Moving on, I want to highlight three boring industries that are already making new all-time highs in the current market environment & continue to exhibit strength:
1. The iShares U.S. Infrastructure ETF $IFRA: This ETF is currently up +9.9% YTD.
2. The Invesco Water Resources ETF $PHO: This ETF is is currently up +12.1% YTD.
3. The iShares U.S. Broker-Dealers & Securities Exchanges ETF $IAI: This ETF is currently up +7.3% YTD, but just made new all-time highs on Thursday & Friday.
The fact that these ETFs, which primarily contain companies that you’ve never heard of before, are making new all-time highs indicates that this market is strong with widespread participation. Unfortunately for the bears, they’ve been trying to convince us of the exact opposite for the past 18 months and they continue to be on the wrong side of this market.
That’s their problem, not mine (and hopefully not yours)
This is a great sign because the MVP’s of the market (the Magnificent 7) continue to act like MVP’s and generate strong returns. Just look at $NYFANG, an equal-weight basket of 10 mega-cap technology stocks, treading water at ATH’s:
This is not bearish.
Bitcoin:
As I alluded to in the intro of this report, I’ll continue to remain optimistic (even if I’m cautiously optimistic) on Bitcoin so long as it remains above $51,000.
I’m specifically focused on this level for one reason: the 200-day moving average cloud.
By using the combined forces of the simple moving average and the exponential moving average, I’ve found this “cloud” to be much more effective than focusing on one or the other.
Presently, the 200-day moving average cloud is trading at:
🔵 200-day EMA = $52,930
🔴 200-day SMA = $50,950
At this stage of the bull market, it’s vital for BTC to stay above this dynamic range.
Bitcoin decisively used the 200-day MA cloud as dynamic support in March and June 2024, with a worrisome breakdown during the August-September 2024 consolidation.
The beautiful thing about these dynamic indicators is that we can modify our outlook based on how price behaves around these levels!
While a breakdown below the 200-day moving average cloud would be bearish, an objective analyst and investor could just as easily get bullish if/when price recovers back above the cloud after the initial breakdown.
Given the fact that price is trading well-above the 200-day moving average cloud today, there are three core takeaways:
Price > 200-day MA cloud = bullish
If/when price retests the 200-day MA cloud, it’s valid potential support
If/when price falls below the 200-day MA cloud, that’s a bearish signal
This is part of the framework that I have and will continue to operate with.
In the meantime, I’ve been happy with the opportunity to buy more Bitcoin in the $59k to $62k range.
Best,
Caleb Franzen
DISCLAIMER:
This report expresses the views of the author as of the date it was published, and are subject to change without notice. The author believes that the information, data, and charts contained within this report are accurate, but cannot guarantee the accuracy of such information.
The investment thesis, security analysis, risk appetite, and time frames expressed above are strictly those of the author and are not intended to be interpreted as financial advice. As such, market views covered in this publication are not to be considered investment advice and should be regarded as information only. The mention, discussion, and/or analysis of individual securities is not a solicitation or recommendation to buy, sell, or hold said security.
Each investor is responsible to conduct their own due diligence and to understand the risks associated with any information that is reviewed. The information contained herein does not constitute and shouldn’t be construed as a solicitation of advisory services. Consult a registered financial advisor and/or certified financial planner before making any investment decisions.


