Liquidity
Is it actually back?
Investors,
The Earthquake Effect is underway, with even more stresses appearing in the global financial system. We have to remember, it’s not just the Federal Reserve who has been tightening monetary policy! Broadly, there has been a coordinated effort by global central banks who are all facing record levels of inflation in their domestic economies. While the pace of their hikes haven’t necessarily been as fast (or as large) as the Fed’s, they are tightening nonetheless.
This week, amidst extreme concerns about Credit Suisse, the European Central Bank (ECB) raised interest rates by another +0.5%, bringing their aggregate rate hikes to 3.5%. It was only last July when their main policy rate was -0.5%, but it currently stands at 3.0% as of their March 22nd rate hike. Many investors were arguing that the ECB wouldn’t even be able to raise rates by +0.25% this week, specifically citing Credit Suisse dynamics as the primary condition that would cause the ECB to potentially even provide stimulus. To those who were suggesting this, and to Credit Suisse itself, the ECB just lifted their middle finger. Perhaps both of them, symbolic of their dedication & resilience to combat inflationary pressures that remain persistent in Europe.
Somehow, someway, investors have been able to look past these structural risks and the ongoing banking contagion with a salacious appetite for risk assets.
Well… not quite “somehow, someway”. The Federal Reserve just injected $300Bn in liquidity by expanding their balance sheet dramatically over the past week. Their intervention with the Bank Term Funding Program represents a massive paradigm shift in U.S. commercial banking, coming from someone who spent multiple years seeing first-hand how banks operate. Per the Fed’s own press release, the Fed’s new facility will “provide liquidity to U.S. depository institutions” in exchange for collateral (Treasuries & mortgage-backed securities purchased before 3/12/23). So how much liquidity has been injected?
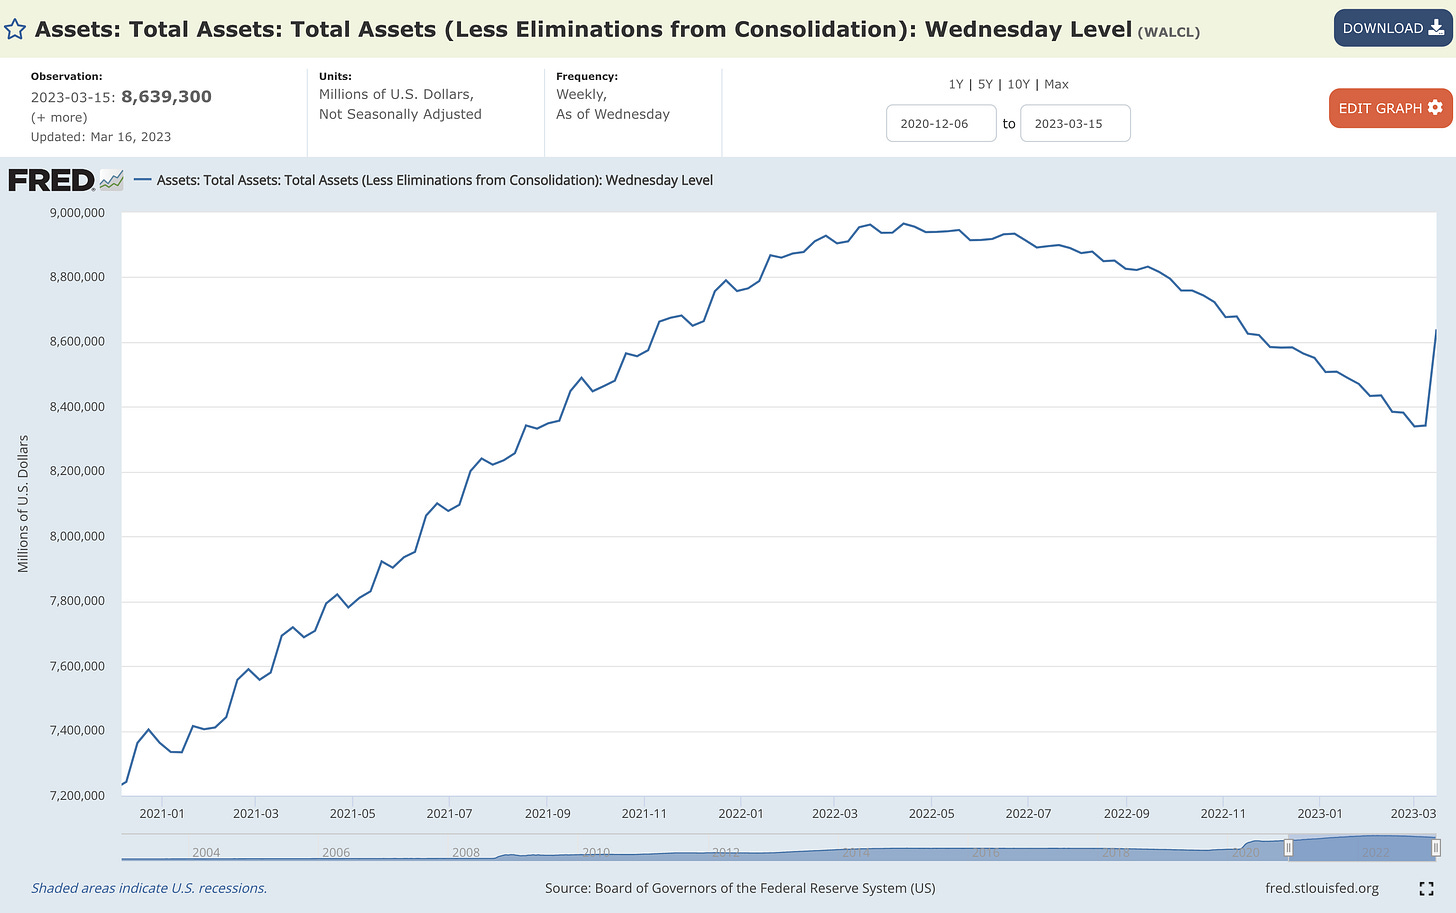
According to the Fed’s own data, showing the total amount of assets held on their balance sheet as of Wednesday, 3/15/23, liquidity has exploded.
In less than a week, the Federal Reserve has erased 4+ months of balance sheet runoff.
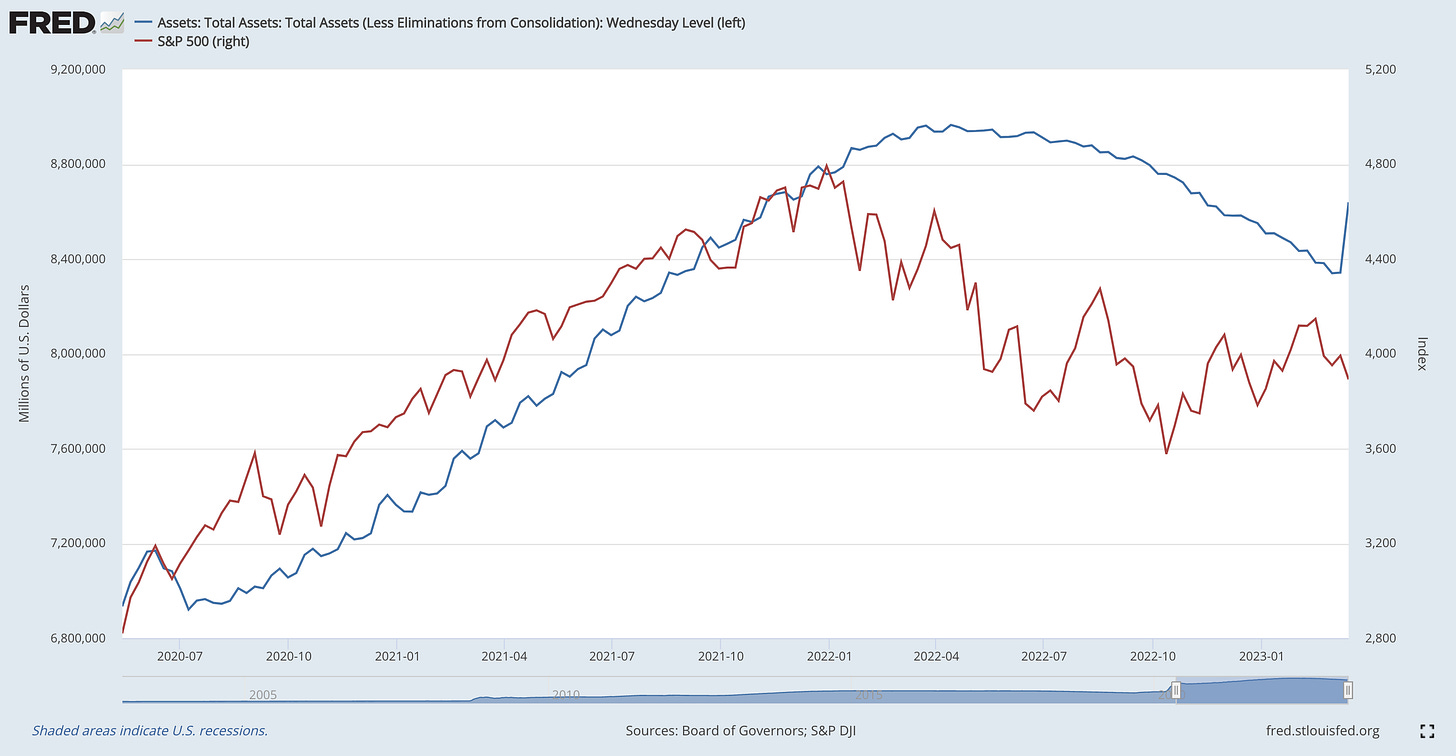
Why is this important? As I’ve been sharing for years, there’s a direct relationship between the size of the Fed’s balance sheet and asset prices. Adding the S&P 500 to the chart above, we get the following:
But what if we change the lens with which we view this data, rather than using the nominal values of the Fed’s balance sheet and the S&P 500. Instead, let’s analyze the rate of change for both variables, on a YoY % change basis, over the past decade:
The takeaways are simple:
As the Fed’s assets decelerates, the S&P 500 decelerates and gives back its gains.
As the Fed’s assets stabilize, the S&P 500 also trends sideways in a choppy manner.
As the Fed’s assets accelerate, the S&P 500 accelerates and rises substantially.
This simple relationship has been the underpinning of my market framework for the past 6 years, effectively providing a green light, yellow light and red light for risk. However, we must also recognize that there are periods of significant deviation, in which the Fed’s assets skyrocket and stocks fall rapidly on a YoY basis. The COVID crash in February/March 2022 is a perfect example. So why does this deviation occur?
Despite the Fed launching a bazooka of liquidity at the financial market in Q1 2020, investors were too preoccupied with the recessionary implications on future cash flows (the 2nd primary variable for calculating the net present value of any asset, after interest rates). Concerns about a recession & public health crisis fueled an avalanche of fear and selling pressure. This psychological panic created a recursive dynamic in which asset prices were plummeting irrespective of Fed policy. However, as fear turned into opportunity, the bazooka set the stage for
At this stage of the Fed’s latest intervention, we’re at an inflection point (potentially similar to February 2020). The question we must all ask is, “does the typical correlation persist, in which asset prices move higher in an environment of more liquidity? Or does a contagion event spur psychological fear and cascading selling pressures, despite the Fed’s intervention?”
I know many of you look to me for answers regarding these questions, but it’s difficult for me to be sure about anything in this market environment right now. The only thing I find confidence in is the Earthquake Effect, which is potentially being minimized by the Fed’s latest intervention. As I look at commentary on Twitter, podcasts, and social media, I think everyone is talking out of their ass. Excuse my language, but there are too many unqualified and confident opinions, lacking the humility to say “I don’t know right now”. Unfortunately, indecision doesn’t lead to clicks and attention… but that’s not why I’ve been writing this newsletter for almost 2 years.
Believe it or not, this was my top-performing Twitter post of the week. Everyone understands that know one knows anything, yet everyone is hungry for an expert opinion. Follower counts are being conflated for credibility and I’m seeing a lot of cold takes out there. No, the Fed’s latest intervention is not QE; though it will have a similar net effect of increasing liquidity & providing a form of stimulus.
Looking at the asset markets themselves, this week was a head-scratcher. On one hand, my prediction about index relative performance on Monday morning was spot on:

Up until now, stresses have been contained within the financial sector and the Nasdaq dramatically outperformed the other indexes in terms of weekly returns, as expected:
Nasdaq-100 $NDX: +5.8%
S&P 500 $SPX: +1.4%
Dow Jones $DJX: -0.15%
The aspect that I was surprised about was how the Nasdaq-100 gained so much and that the S&P 500 also managed to gain more than +1%. I didn’t expect to see risk assets remain so strong in this environment, given last weekend’s announcement that Signature Bank of New York was being shuttered by regulators and the ongoing/increased concerns about Credit Suisse. My negative outlook was completely dismembered. Investors dumped financial sector assets (banks, insurance, broker/dealers), but still retained their appetite for risk assets after the second and third largest bank failures/shutdowns in U.S. history. Despite the considerably strong performance for the indexes, the SPDR Select Sector Financials ETF ($XLF) had a weekly return of -5.9%.
Bitcoin capitalized on its opportunity to show the intrinsic value of an alternative monetary network, highlighting the importance of a known, programmatic, and immutable supply. The scarce digital asset generated a weekly return of +33.5% between the traditional market closes week-over-week.
While the Dow Jones, the S&P 500, and the Russell 2000 are all trading below their respective 200-day moving averages (both the exponential and simple), the Nasdaq-100 is the only one trading above it’s 200-day MA’s. Tech has been the place to be lately, which is bizarre given the context & uncertainty hovering above the market right now. Nonetheless, tech is showing relative leadership on a weekly and monthly basis! It comes second after Communication Services, which is predominantly Alphabet/Google and Facebook/Meta. So it’s essentially an alternative version of tech…
The market is so hooked on stimulus and the desire for improved liquidity that it cares about nothing else. Bank failures? Never heard of ’em. The ECB raised rates by +0.5%? Who’s that? The Fed intervenes to backstop the financial system? BUY BUY BUY! Clearly, the market still has a defensive tilt given this uncertainty, with utilities, healthcare, and consumer defensive stocks also performing extremely well.
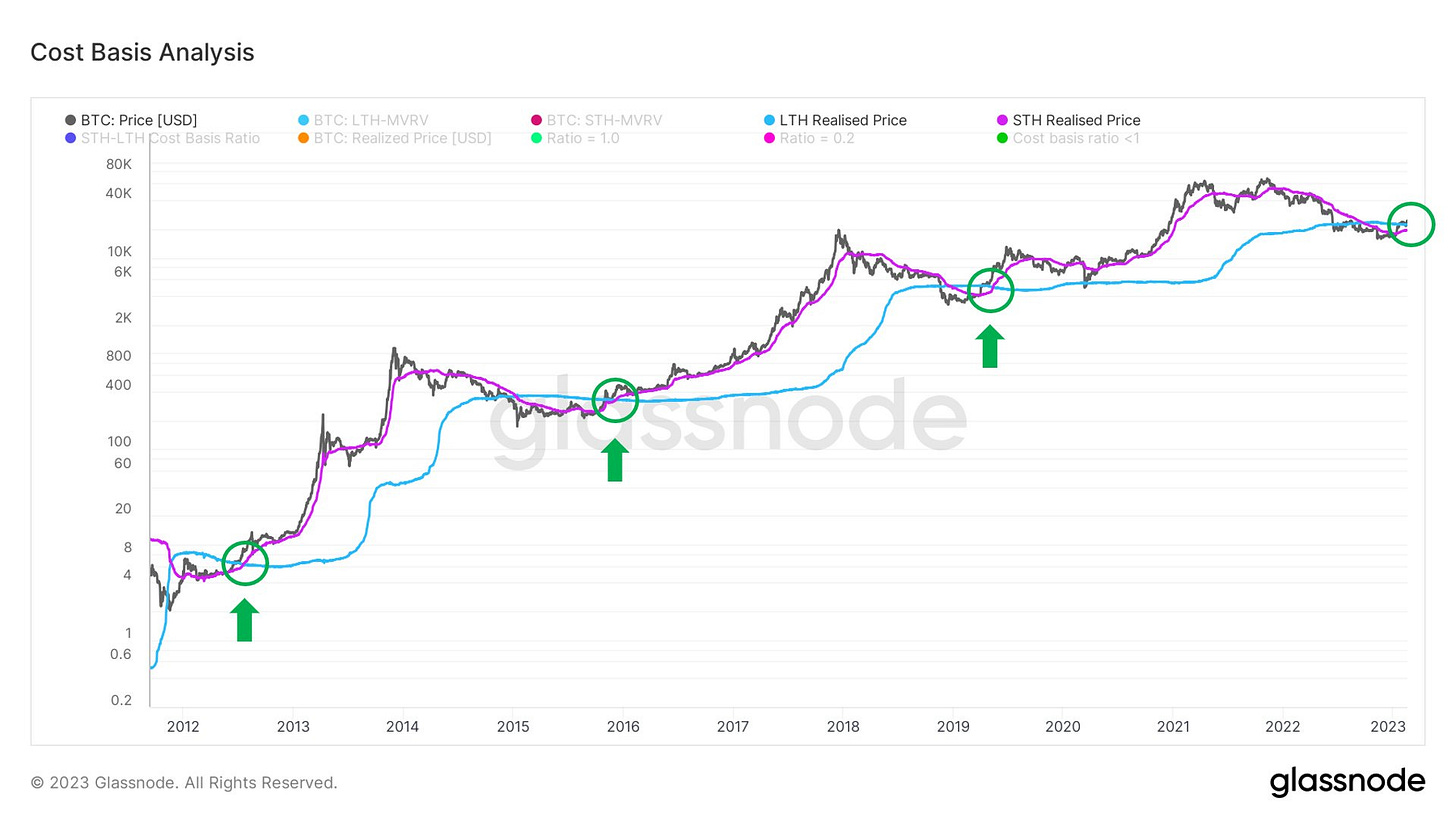
With the riskiest of risk assets performing well, at least as it’s perceived by traditional markets, crypto continues to shrug off any and all macro concerns in 2023. The digital currency is now up +66% YTD, but is still down -60% from ATH’s. On February 18th, I highlighted a myriad of statistical and on-chain indicators that were flashing bullish market dynamics, and foreshadowed the significance of a potential bullish crossover in one key relationship: the short-term & long-term holder realized prices.
I said:
“This crossover could reasonably occur within the next few weeks to a month, or maybe longer depending on overall market dynamics. The chart below from Will Clemente highlights the bullish signal that is produced once this crossover occurs:
It’s hard to ignore the significance of each of these individual datapoints & signals; however, the cumulative signal from all of them flashing simultaneously is going to be impossible to ignore. We’re not there yet, but it could happen in the blink of an eye.”
As of this week, less than one month after publishing the above, we’ve officially achieved the signal:
Price of Bitcoin > $27k
Short-term holder realized price = $20.3k
Long-term holder realized price = $19.6k
Price > STHRP > LTHRP.
On the aggregate, the post below highlights the simple but effective technical signals that we’re seeing across a variety of timeframes:

This market is extremely confusing, but these technical indicators could help to reduce the noise and provide a sense of clarity. Each bull market in Bitcoin’s history has achieved all 5 of these signals… Could it fail this time? Yes. Statistics don’t operate in a vacuum. Could we be extremely encouraged by these developments. I am.
Cautious optimism, as always.
Best,
Caleb Franzen
DISCLAIMER:
This report expresses the views of the author as of the date it was published, and are subjected to change without notice. The investment thesis, security analysis, risk appetite, and time frames expressed above are strictly those of the author and are not intended to be interpreted as financial advice. As such, market views covered in this publication are not to be considered investment advice and should be regarded as information only. Everyone is responsible to conduct their own due diligence, understand the risks associated with any information that is reviewed, and to recognize that the information contained herein does not constitute and should be construed as a solicitation of advisory services. Cubic Analytics believes that the information & sources from which information is being taken are accurate, but cannot guarantee the accuracy of such information.
This report may not be copied, reproduced, republished or posted without the consent of Cubic Analytics and/or Caleb Franzen, without proper citation & reference.
As always, consult a registered financial advisor and/or certified financial planner before making any investment decisions.


Great article, completely agree with your take on uncertainty and no one really having a clue as to what’s going to come next.