Yesterday’s report was all about opportunity cost — or the lack thereof — for Bitcoin.
Investing is just as much about relative performance as it is absolute performance, so I thought it was a perfect time to remind investors about this concept and highlight how Bitcoin continues to be the fastest horse in the race.
Before I begin today’s report, I want to follow up on the exclusive analysis and study that I shared with premium members on May 11th, at the time when one of my favorite bullish signals had just flashed.
The signal?
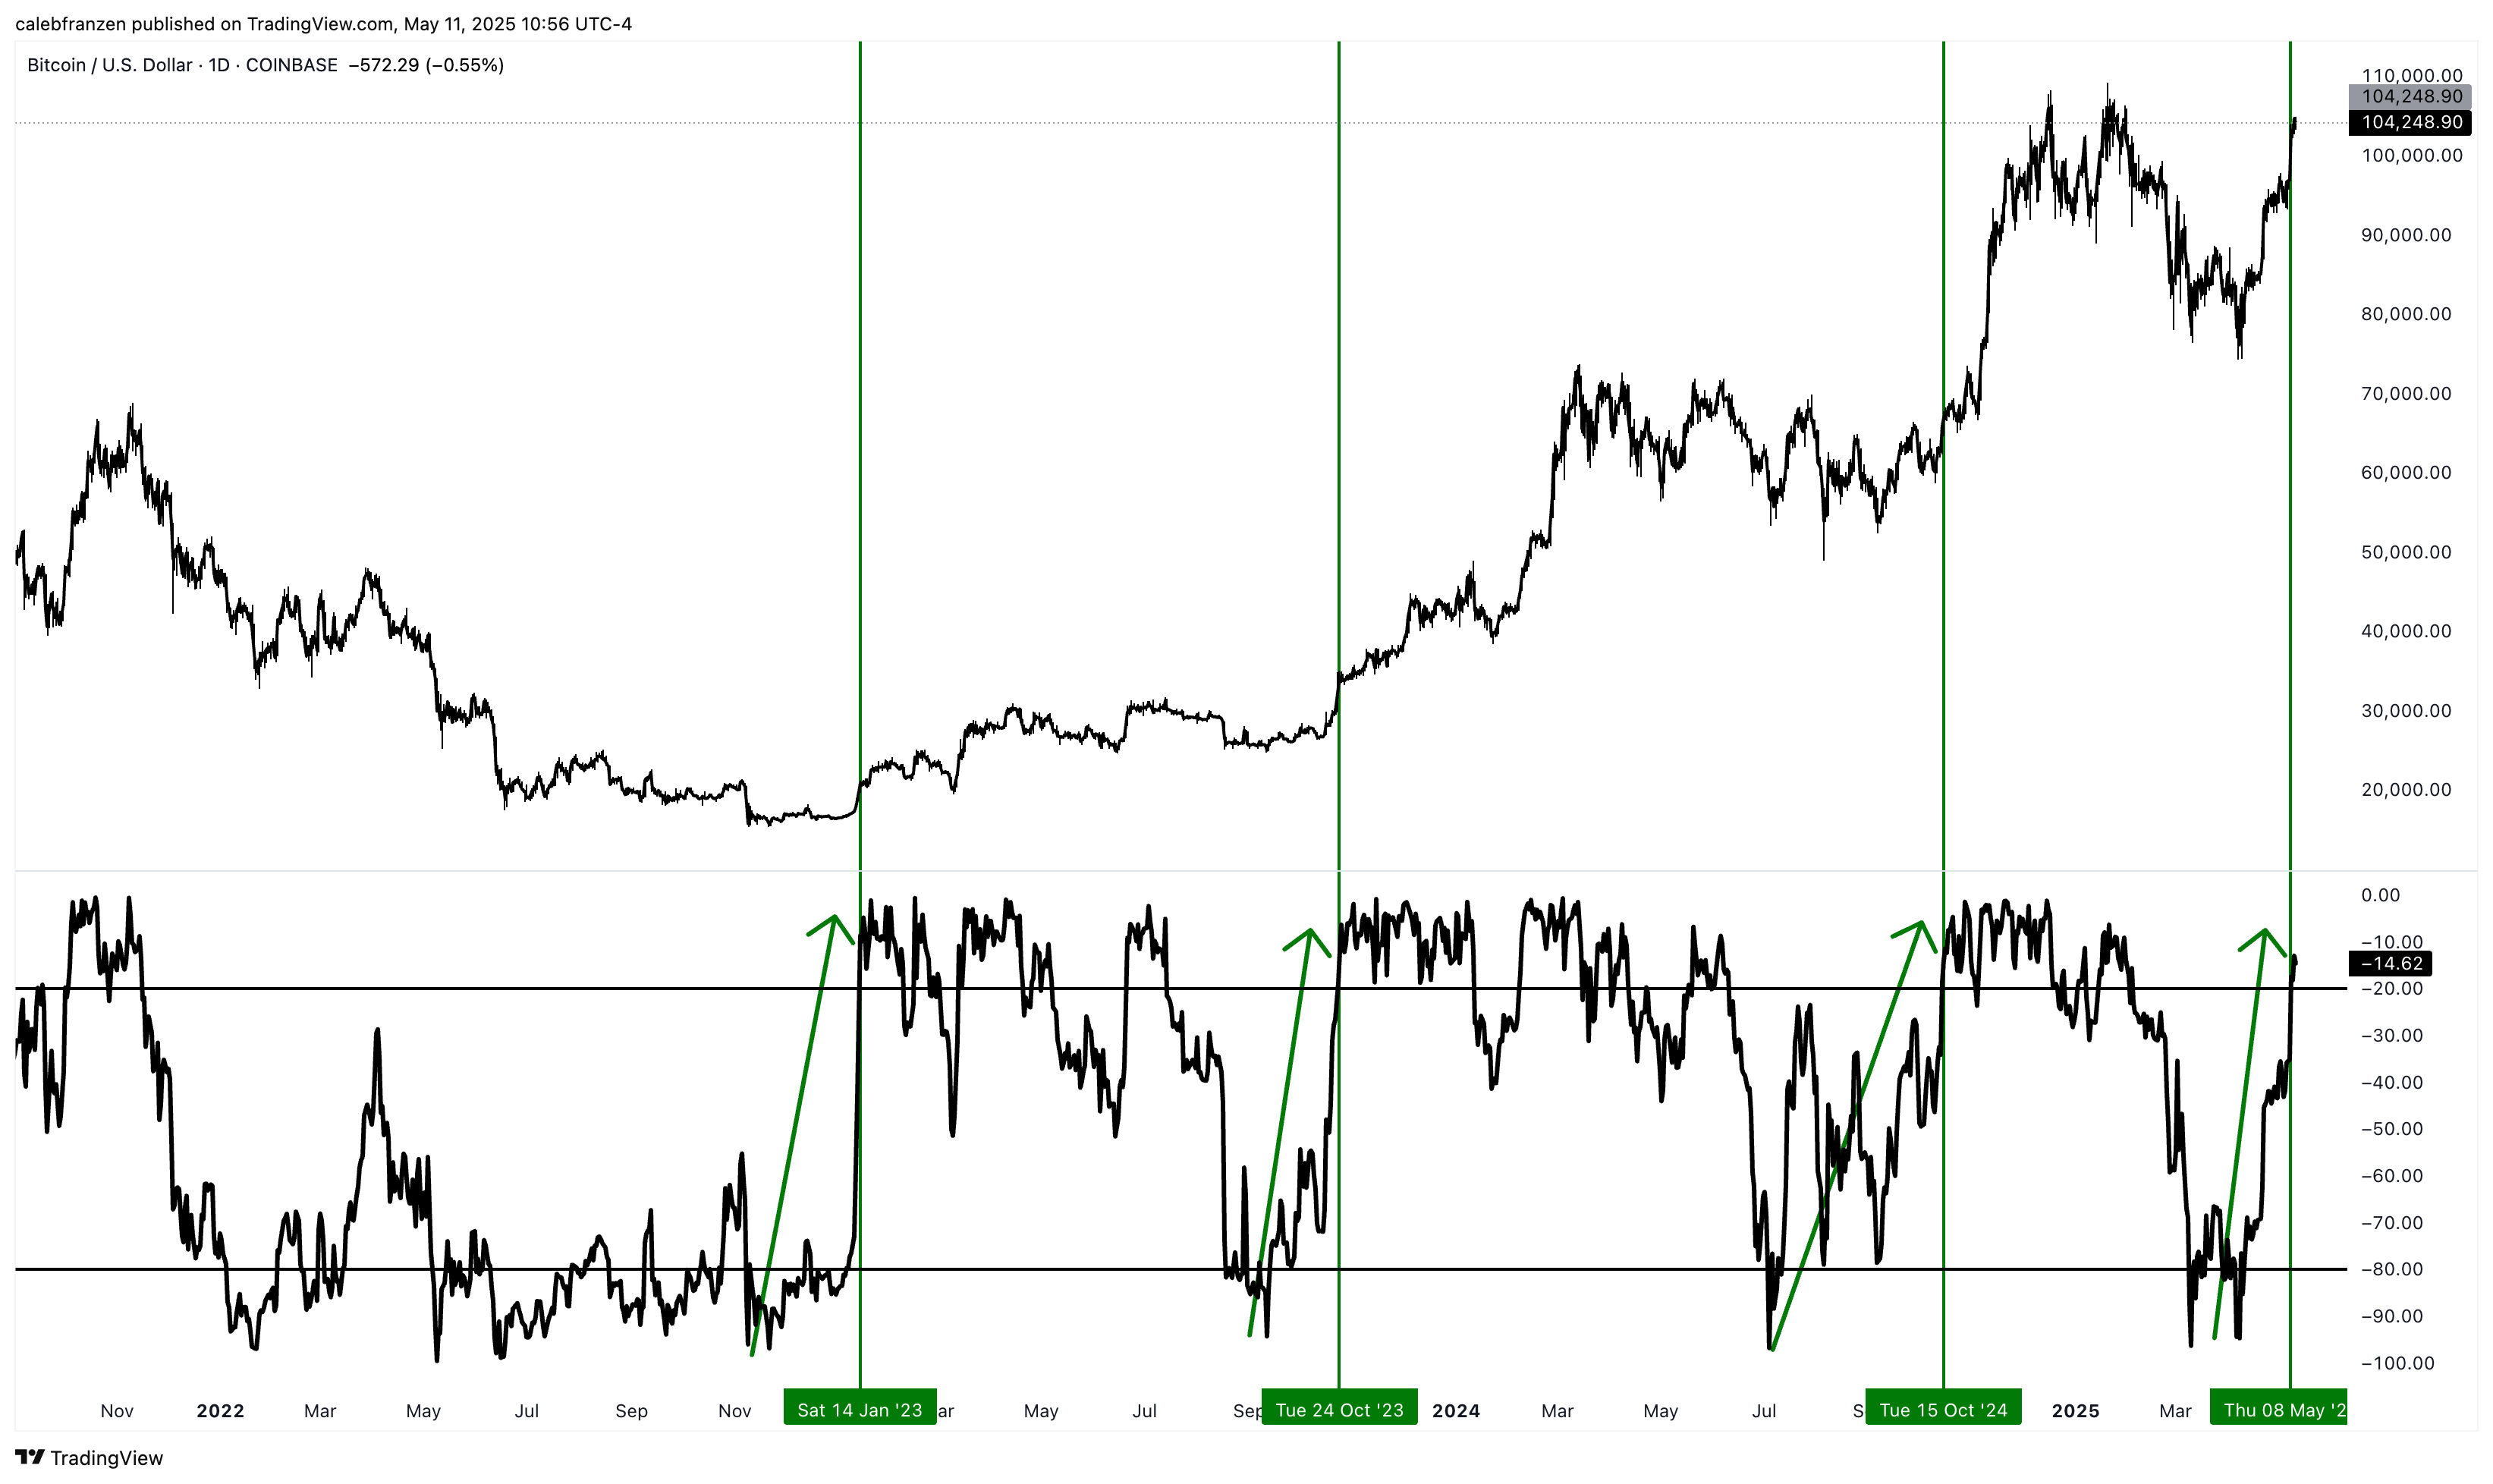
A bullish momentum thrust using the 120-day Williams%R oscillator.
Here was the analysis that I shared in that report:
“[I use 120 days because] it’s roughly equivalent to 1/3rd of the year, which makes it an interesting length and an objectively significant calendar-based indicator.
This is every single time the indicator has flashed since the market peaked in 2021:
One beautiful thing about this indicator is that it didn’t trigger during the entirety of the 2022 bear market, meaning that it didn’t provide any false signals!
Naturally, look at the results of the bullish signals that HAVE flashed:
After the first signal in January 2023, BTC gained +49% within 90 days.
After the second signal in October 2023, BTC gained +42% within 90 days. However, this signal also went on to produce a net return of +115% in 151 days!
After the third signal in October 2024, BTC gained +61% within 90 days.
Now, the fourth signal has flashed.
Will it work exactly the same as the others?
I don’t know, and no one does, but I like the odds.
With an average return of 50.67% within a 90-day period, that would imply that Bitcoin could achieve a price of $155.7k by mid-August 2025.”
In hindsight, this rally looks so obvious.
But I was sharing this strategy and the implications with premium members in real-time, highlighting how a bullish signal would help to push Bitcoin even higher.
Now, we’re getting that follow-through as Bitcoin crosses $119k on Sunday afternoon.
This was the analysis that I sent to premium members of Cubic Analytics back in May, highlighting a key conclusion that “dips, particularly within the next 30-60 days, are for buying.”
Unfortunately, the biggest dip that Bitcoin experienced since that analysis was “only” the decline from $112k to $98.3k; however, it’s clear that this signal is working based on the updated chart below:
Amazingly, Bitcoin is technically underperforming its typical returns after this signal.
This could be due to the fact that statistical signals aren’t guaranteed to produce identical results in different market conditions, which is something that I highlighted in the original analysis.
Or it could imply that BTC is going to make up for lost time.
The $155k intermediate target is lofty — but still possible.
It exceeds my other intermediate term target based on the 161.8% fibonacci level.
Together, these two forms of analysis create a “window” for upside potential, between $139k to $155k.
Whether you think that’s important, exciting, or attractive is up to you.
I’ll keep letting the objective data speak for itself, while ensuring that premium members are aware of the key studies & indicators driving my view on the market and how to interpret/implement them.