Investors,
The S&P 500 continues to reach new all-time highs, on the back of resilient economic data and outperformance from the best companies in the world. Earnings season for Q4’23 has been a mixed bag (as it typically is), but the overwhelming takeaway is that earnings have been “good enough” to support the ongoing uptrend in asset prices.
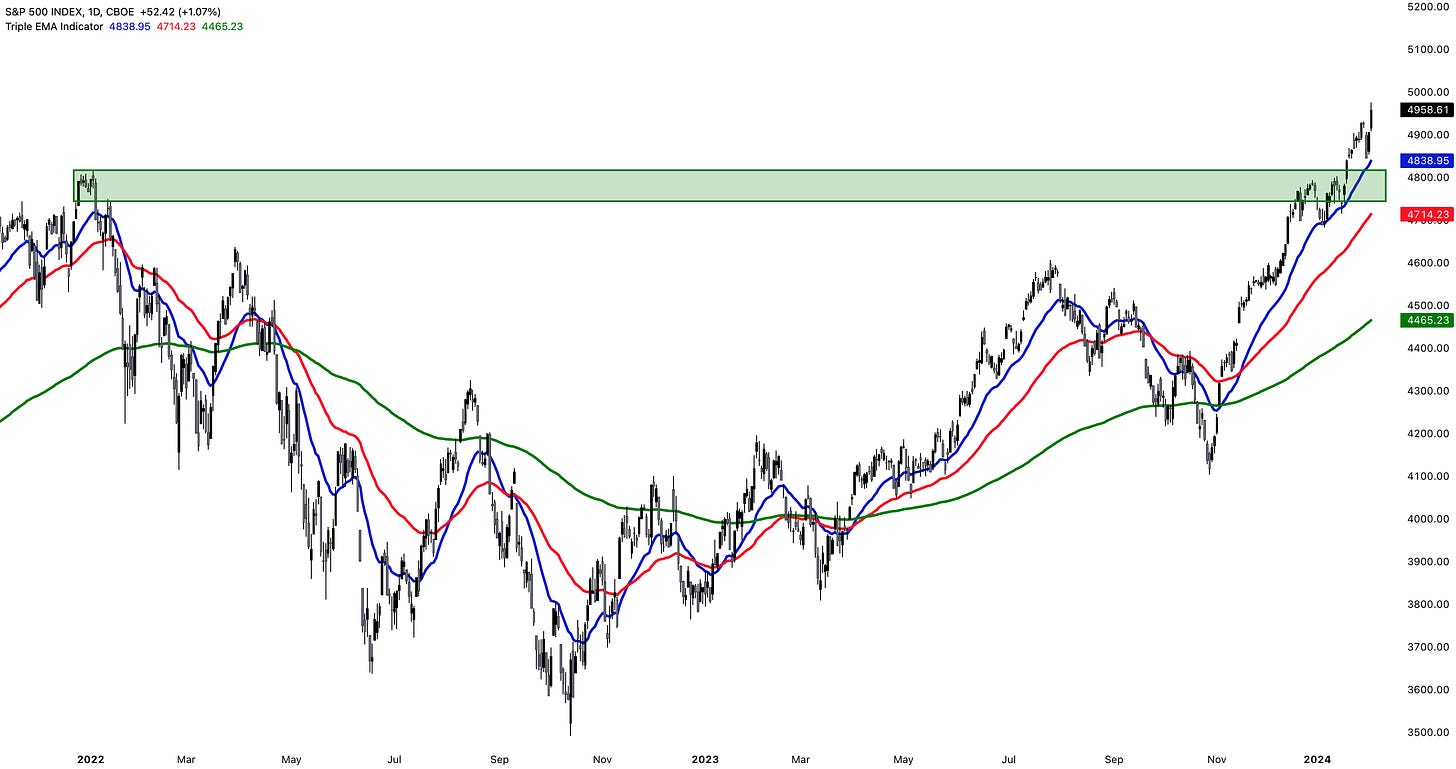
As a result, the S&P 500 is making all-time high record closes on both a daily & weekly basis, trending above short, medium, and long-term exponential moving averages that all have a positive slope:
🔵 21-day EMA
🔴 55-day EMA
🟢 200-day EMA
This bullish formation of price with respect to the EMA’s (and relative to each other) is the inverse of what we witnessed in 2022, and the return to a bullish formation in April 2023 was a clear signal that we had returned to a bullish environment.
In fact, this was something that I shared with premium members of Cubic Analytics in real-time, which I reiterated in November when the bullish formation resumed.
While Powell’s comments at this week’s FOMC policy meeting indicated that the Federal Reserve will not be cutting rates in March 2024, this should not be a surprise to anyone who reads Cubic Analytics. Since mid-2023, I’ve been telling investors that the Fed’s timeline for cuts will likely begin no sooner than Q3’24, starting with the July meeting.
Financial markets were surprised by the notion that cuts won’t be coming as soon as they expected, but this has been a constant mistake since Day 1 of the tightening cycle.
Despite “re-pricing” the timeline for cuts, the market was able to make new ATH’s.
I put “re-pricing” in quotes because my perspective has been that the actual financial market is NOT (and has not) been priced for cuts, referencing both the 3M and 6M Treasury yield to justify my opinion. The fact that the S&P 500 hit new all-time highs after Powell walked back expectations for rate cuts in March 2024 is proof-positive that the market was not priced for cuts in March!
Since December 2022, I’ve told investors that these are the arbiters of truth for monetary policy, yet so many folks on Wall Street (and FinX) still don’t understand this. While Fed funds futures and the CME FedWatch Tool were indicating that cuts were coming in either March or May, these aren’t the markets that matter.
Additionally, they’ve been wrong time and time again with respect to the timing mechanism of monetary policy.
Instead, the 3M and 6M Treasury yield have been the most accurate indicators for monetary policy, which is why I’ve been referencing them for more than 12 months.
At the current moment:
🟢 Effective Federal funds rate = 5.33%
🔴 3-month Treasury yield = 5.38%
🔵 6-month Treasury yield = 5.26%
Why is this so important?
Because either or both of these Treasury yields would be trading at least 0.25% below the effective fed funds rate (EFFR) if the Treasury market was pricing in cuts over the next 3 or 6 months. In other words, they’d be trading at/below 5.08% (5.33 - 0.25).
Instead these yields are either above or only slightly below the EFFR.
Full stop, this indicates that Treasury investors (aka “smart money”) don’t believe that cuts are coming within the next 6 months. While this could change in the coming weeks/months, we must listen to what these investors are telling us right now because they’re putting their money where their mouth is and they’ve been more correct than other indicator out there. As such, I will continue to operate with the belief that cuts aren’t coming until Q3’24 unless the 3M and/or 6M Treasury yield start to tell a different story.
Both Treasury yields indicate that the Fed will remain paused for the next 6 months.
In the remainder of this report, I’ll touch on the important correlations that I’m seeing in macro and valuable signals that I’m seeing in the stock market.
These Saturday reports are completely free, so please share this research with anyone who might find it valuable. If you feel inclined to support my work as an independent analyst and gain access to the full benefits of my research, consider upgrading to a premium subscription using the link below:
Macroeconomics:
The latest round of labor market data proved once again that the labor market is resilient and dynamic, the two adjectives I’ve been using to describe it for 18 months.
As I’ve said in the past, some folks might not agree that the labor market is “tight” or “strong”, but any objective analyst must recognize that, on the aggregate, labor market data is resilient and dynamic.
Here are the facts:
1a. Private Payrolls (as measured via the ADP private payroll data) are still growing:
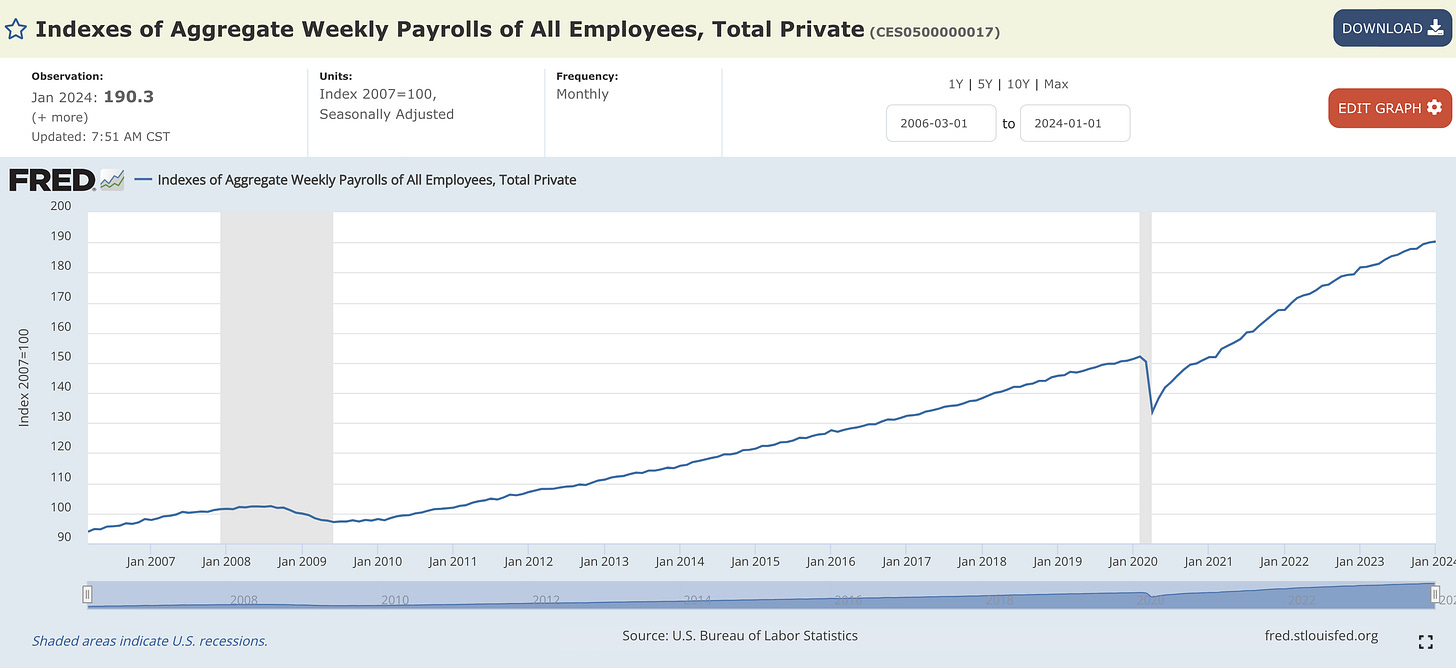
1b. Private Payrolls (using an index of aggregate data) are still trending higher:
1c. Combining both of these datapoints & analyzing YoY rate of change, we can see that the growth in private payrolls is certainly decelerating; however, this growth rate has been decelerating since Q1’22 and they’re both still tracking with pre-COVID rates of growth:
2. Labor productivity (output per hour) growth is accelerating higher on a YoY basis:
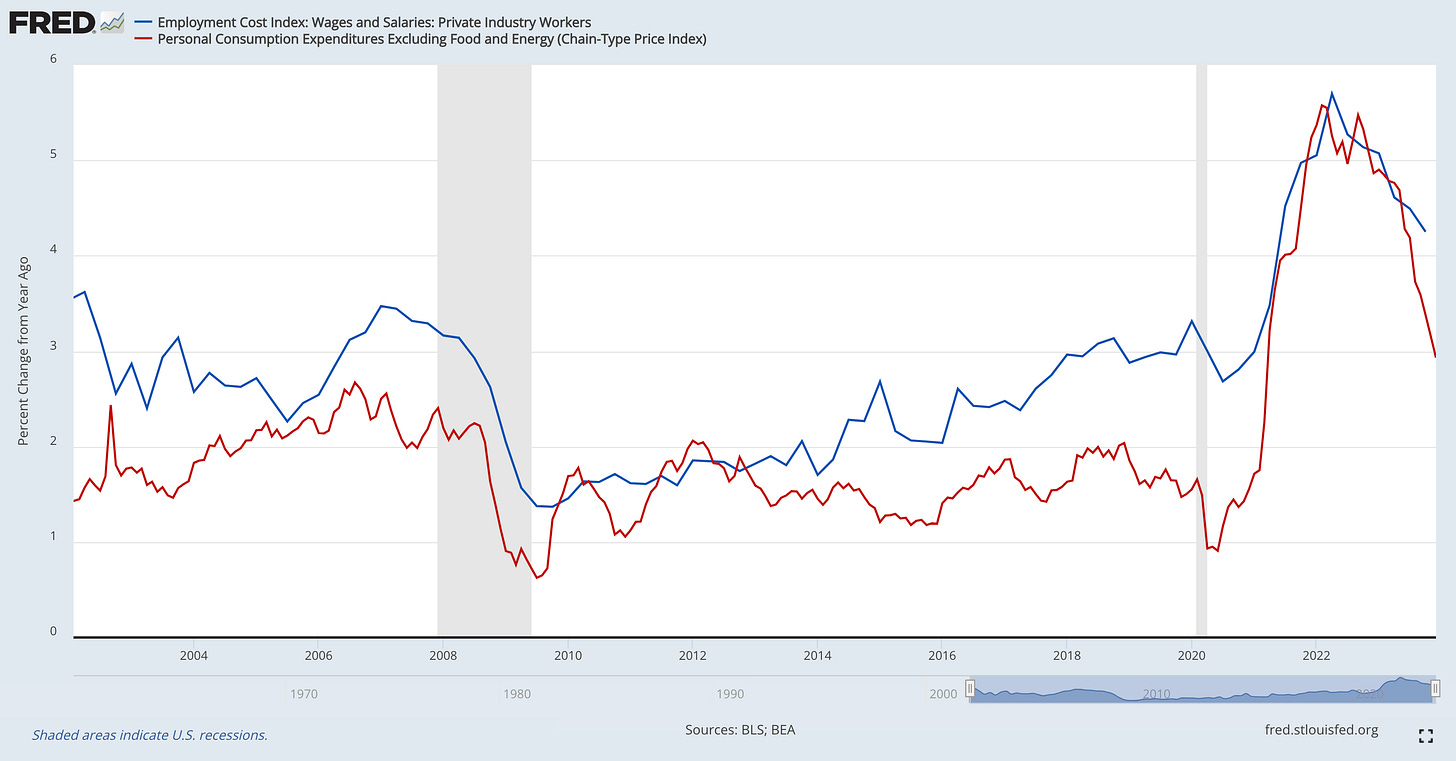
3. The Employment Cost Index (ECI) is decelerating on a YoY basis, confirming that disinflation is intact and foreshadowing that more disinflation is coming. The chart below compares the YoY rate of change in the ECI vs. the core PCE inflation rate:
4. Layoffs & discharges remain low, but picked up in December:
5. The quits rate in Dec.’23 fell to 2.4%, which confirms that disinflation will persist:
6. Average hourly earnings did re-accelerate to +4.5% YoY, highlighting how real wage growth (nominal adjusted for inflation) is positive and that consumers are regaining their purchasing power.
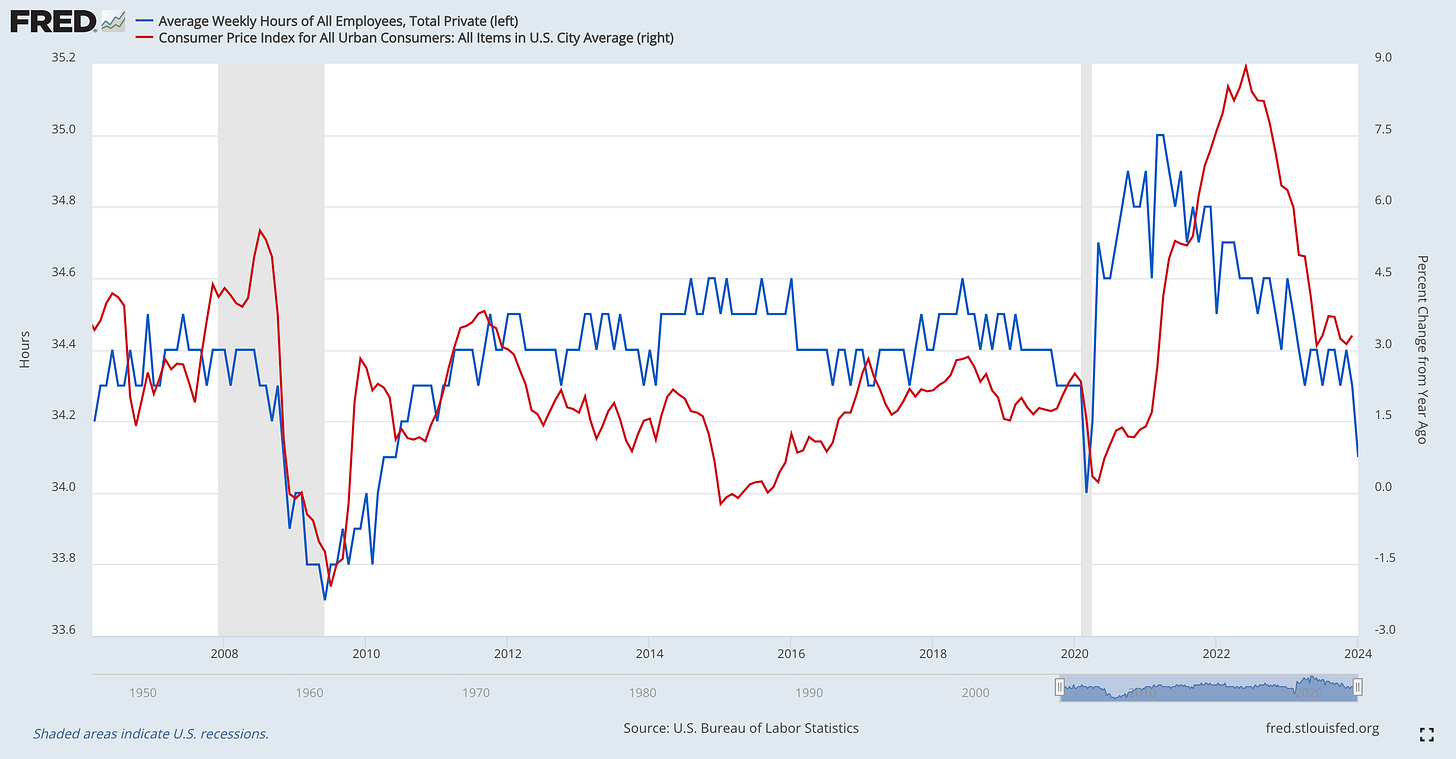
7. While wage gains accelerated, the average number of weekly hours worked declined to 34.1 hours/week. While this isn’t a great sign for labor market strength, it does indicate that inflation is also going to decelerate further based on the correlation with headline CPI YoY:
8. Last but not least, multiple jobholders as a percentage of the employed actually decreased in January to 5.1% and remains in-line with the pre-Pandemic level of 5.2% in January 2020:
All in all, the latest round of labor market data confirms that:
The labor market is resilient & dynamic.
The trend of disinflation will persist.
Both of which are congruent with the Fed’s goals and their dual-mandate for price stability and maximum employment, bringing us one step closer to the end of monetary tightening.
Stock Market:
One of the reasons why I’ve expressed confidence in the economy (aside from the actual macro data itself) is because of the fact that the stock market is a forward-looking pricing mechanism.
Is it a perfect pricing mechanism with 100% accuracy? No.
But it’s the best one we have available. (P.S. if anyone knows of an indicator with 100% accuracy, please let me know. No one has been able to show me one yet.)
The fact that the U.S. stock market bottomed in June 2022 (when the list of new 52-week lows peaked) before peak inflation and has continued to trend to new all-time highs is indicative of the stock market’s forecasting acumen.
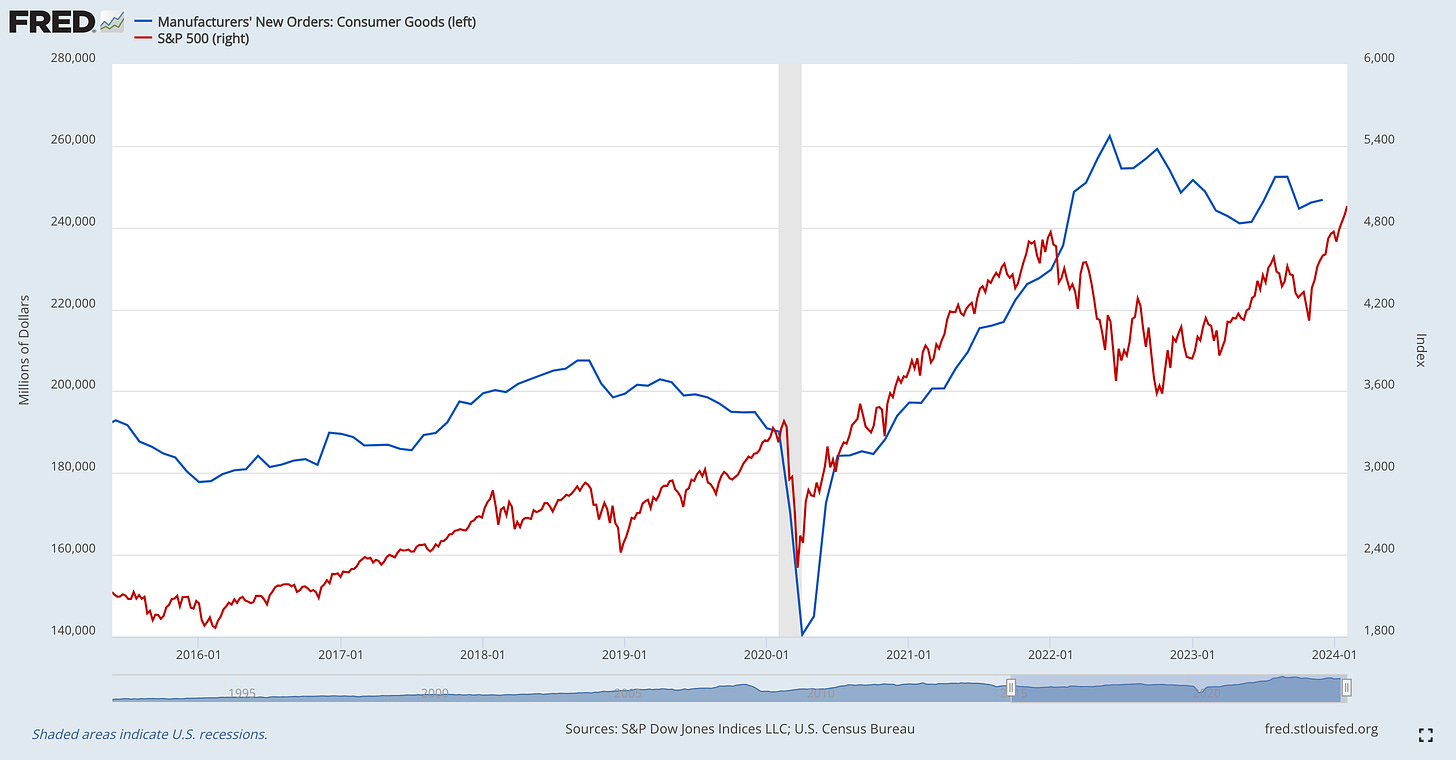
There are two charts that I want to highlight on this topic, comparing the S&P 500 to different pieces of manufacturing data:
1. S&P 500 vs. Manufacturers’ New Order: Consumer Goods: As we can see in this chart, the directional correlation of the S&P 500 vs. new orders (consumer goods) is very strong. While deviations can certainly occur, one can easily argue that the S&P 500 is a leading indicator for new orders. The ongoing uptrend in the S&P 500 has finally started to be paired with a gradual increase in manufacturing new orders.
2. S&P 500 YoY percent change vs. ISM Manufacturing Index YoY percent change:
On a YoY basis, we can see that the S&P 500 has a strong correlation with the manufacturing sector, which is finally starting to play “catch-up” with the S&P 500’s YoY gains. Given the improvements in the latest round of the ISM Manufacturing data, this should give investors a degree of comfort that manufacturing is poised to re-accelerate higher on a YoY basis and therefore start to expand.

The takeaway here are simple: if you believe, as I do, that the stock market is the best forward-looking pricing mechanism we have, then you must recognize and accept that the long-standing correlations with manufacturing data imply that economic activity in the manufacturing sector should expand and improve in the months/quarters ahead.
Bitcoin:
Relative to U.S. Treasuries, Bitcoin is still trading near all-time highs.
This is, once again, an encouraging sign given that investing has inherent opportunity costs. For those investors who continue to believe that Bitcoin is still “too risky”, this chart highlights the cost of not owning Bitcoin.
I did some reflecting about the whole “sell the news” event from the approval of the spot Bitcoin ETFs, which I encourage you to read here on X/Twitter.
With the price of Bitcoin currently trading above $43,000, I don’t have any major degree of concern and firmly believe that the uptrend is intact. As I’ve explained before, a return even into the mid/low-$30k range would still be consistent with bull market behavior and bull market price structure. I’ll continue to be prepared for drawdowns & volatility, but I remain optimistic on the BTCUSD exchange rate.
Best,
Caleb Franzen
DISCLAIMER:
This report expresses the views of the author as of the date it was published, and are subject to change without notice. The author believes that the information, data, and charts contained within this report are accurate, but cannot guarantee the accuracy of such information.
The investment thesis, security analysis, risk appetite, & timeframes expressed above are strictly those of the author and are not intended to be interpreted as financial advice. As such, market views covered in this publication are not to be considered investment advice and should be regarded as information only. The mention, discussion, and/or analysis of individual securities is not a solicitation or recommendation to buy, sell, or hold said security.
Each investor is responsible to conduct their own due diligence and to understand the risks associated with any information that is reviewed. The information contained herein does not constitute and shouldn’t be construed as a solicitation of advisory services. Consult a registered financial advisor and/or certified financial planner before making any investment decisions.










Great analysis. Really enjoyed this read Caleb!
I still think the May 1st meeting is in play for the first 25bps cut, and if you look at SOFR swaps that market also implies one 25bps cut by May.
We'll have three more CPI prints before that meeting, and I believe the March & April readings will have a 2 handle at the front. It will be difficult for the FOMC to remain this hawkish & restrictive if that transpires.