Investors,
Despite the downward pressure in equity markets in the latter-half of the week, stock market indexes managed to produce a respectable gain relative to the prior Friday’s close. Each of the major indexes closed in positive territory:
Dow Jones Industrial Average $DJX: +2.0%
S&P 500 $SPX: +1.5%
Nasdaq-100 $NDX: +0.6%
Russell 2000 $RUT: +2.25%
Over the past few weeks, I’ve noticed that the Dow Jones (considered to be the least risky index) has been undergoing larger magnitude price swings than the S&P 500 and the Nasdaq-100. This is a surprising turn of events, considering that riskier assets are expected to have larger fluctuations in price. In last week’s research, I highlighted how less risky assets were leading the market lower, foreshadowing further weakness in the riskier market segments:
“Consider the following:
20+ Year U.S. Treasuries created new YTD lows on September 6th.
The Dow Jones, “riskier” than Treasuries, created new YTD lows on Sept. 23rd.
The S&P 500, “riskier” than the Dow, created new YTD lows on Sept. 27th.
The Nasdaq-100, “riskier” than the S&P, created new YTD lows on Sept. 30th.
The Russell 2000, “riskier” than the Nasdaq, has yet to create new YTD lows.
With Bitcoin & crypto widely accepted as the riskiest asset class, I think it’s reasonable to expect that broader financial market pressure will produce new YTD lows for Bitcoin in the coming weeks/months.”
I think this dynamic will be worthwhile to watch going forward, particularly as large-cap technology stocks lead the market lower. With Bitcoin currently trading around $19.45k, I still see weakness across the market that should cause further downside pressure for crypto.
While this is my base-case scenario, I am continuing to patiently allocate into BTC, as I recognize that my investment outlook could be incorrect.
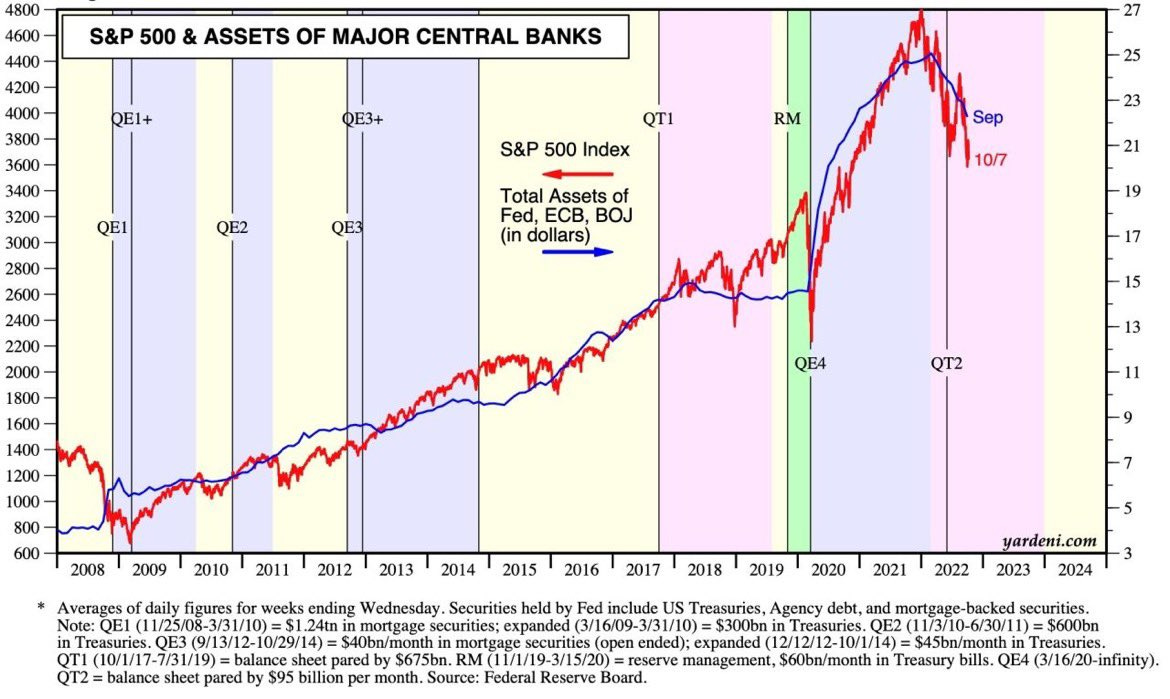
Arguably the most important factor that influences my outlook on asset markets, and equities in particular, is the amount of liquidity provided by central bank stimulus. This was the core reason why I was extremely bullish in my 2021 market outlook, because I recognized that global central banks and the Federal Reserve would continue to provide exorbitant levels of monetary stimulus to the financial system. For context, I’d encourage you to look back on my first research publication where I highlighted why this dynamic is so impactful:


As we entered 2022, I issued caution based on my outlook that the Federal Reserve would tighten monetary policy outright. While I expected the tightening process to occur at a slower pace, it’s evident that this is the core theme driving market dynamics in 2022. In both of these publications, I shared important charts that directly showed the correlation between the S&P 500 and various measures of central bank liquidity. Today, it’s even more apparent why this is such an important dynamic.
Ed Yardeni, of Yardeni Research, provided an update on this relationship:
In a stale & stagnant economy, financial stimulus provided by central banks unequivocally has a material impact on the way that financial assets are valued. On the other side of the coin, central bank stimulus appears to have a minimal impact on economic fundamentals, unable to consistently generate growth, stimulate lending, or consumption. As global central banks continue to embark on a monetary tightening regime, my expectation is that financial assets like equities will face continued downward pressure.
This simple but effective framework is what’s allowed me to stay on the right side of the market since 2018 and throughout 2022. The purpose of these weekly deep-dives is to constantly reassess this thesis by understanding how market dynamics are responding to new economic & financial data. As I constantly pressure-test my thesis, I’m hopeful that the data, charts, and studies that I share in this report are helpful in your own investing process and that we can continue to build our knowledge together.
In this report, I’ll be analyzing key under-the-hood metrics for the S&P 500 and what it means about the broader trend for the market. We’ll cover sector strength/weakness and the interesting dynamics in FAANG stocks (Facebook, Apple, Amazon, Netflix, Google). The FAANG constituents have drastically underperformed the broader market this year, indicative of growing stress within the equity market. The question is, will this trend deviation persist and for how long? I’ll be exploring this topic & answering this question, while providing other interesting charts and perspectives along the way in order to keep you ahead of the market curve.


