


Why So Bearish?

Investors,
Sentiment is the most bearish that it’s been in years, despite the fact that the S&P 500, the Nasdaq-100, and dozens of U.S. sector/industry/thematic ETFs made new all-time highs this week.
These are two charts to quantifiably prove just how bearish investors are:
1. The American Association of Individual Investors (AAII) has their investor sentiment survey, tracking the percentage of bearish respondents, which just reached its highest levels since November 2023. In other words, investors haven’t been this bearish in 27 months.
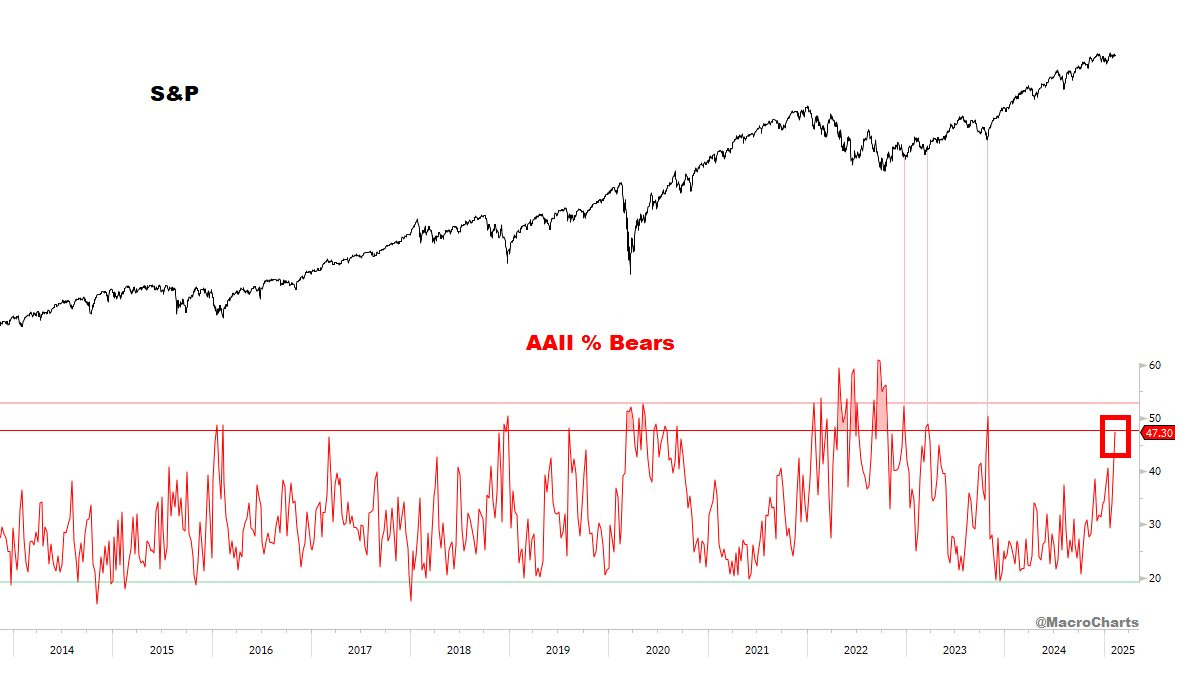
The chart above, from
, does an excellent job of overlaying similar spikes in bearishness vs. the S&P 500. Historically, even if a bit of short-term pain is still coming down the pipeline, these periods of excessive bearishness are great opportunities for long-term investors.2. The put to call ratio: This measures activity in the options market to gauge how many investors are positioning bearish (via puts) and positioning bullish (via calls). A high and rising put/call ratio indicates that investors are becoming increasingly bearish, where a falling put/call ratio is generally indicative of speculative behavior.

The put/call ratio has seen three major spikes in 2025, hitting its highest levels since Q2’24, with the most recent peak occurring on Thursday, February 13th. These spikes, even if they don’t last for long, illustrate the “jumpiness” of investors and their feeble conviction in the strength and sustainability of this bull market.
In January 2025, I published a report titled “I’m Embarrassed”, in which I expressed my disappointment in how easily investors were getting shaken out of this market. In that report, I expressed how the winners in this market are the investors who were doing nothing and embracing the “less is more” attitude.
I embraced this attitude whole-heartedly, sitting through heightened volatility and dismissing almost every single concern and “risk” that the market was worried about.
As a result of doing nothing, my long-term equity portfolio has continued to make new all-time highs over the past month, now up +11% YTD!

Compared to the S&P 500’s YTD return of +4.01%, I’m satisfied by these results.
If you’re curious, I shared an update on my top 15 portfolio positions on Thursday, along with a 90-minute video presentation and Q&A, which you can access here.
In the remainder of this free weekly report (feel free to share it will colleagues, family, and friends), I’ll review a handful of the key dynamics that stood out to me this week.
As always, these reports cover macro, the stock market, and Bitcoin, so feel free to scroll to whichever section you’re most interested in, or read the full report to ensure you don’t miss a beat.
Macroeconomics:
CPI inflation data came in hot, but the market didn’t care.
PPI inflation data came in hot, but the market didn’t care.
If we’re going to implement macroeconomic analysis into our process(es) as investors, then we should only care about macro in so far as the market cares about macro.
Inherently, because price is the arbiter of truth and because the market is the most efficient forward-pricing mechanism in human history, then we must be humble enough to accept that the market is smarter than us.
We can scream and cry that the market “doesn’t care” about the risks or concerns that keep us up at night, but maybe the market doesn’t care for a reason… because the risk that you’re afraid of isn’t actually important or as threatening as you might think.
So when asset prices managed to rally after the “hot” inflation data, there is only one major takeaway that you need to understand as an investor: the market is not concerned about reaccelerating inflation.
We can take this a step further with two interpretations:
The market doesn’t think inflation will sustainably reaccelerate (time-based).
The market doesn’t think inflation will materially reaccelerate (magnitude).
So I’m going to trust the market.
Anyways, as far as I’m concerned, most CPI components are still experiencing disinflation!
Just look at the median CPI data, published by the Cleveland Fed (shown in orange):

Even the trimmed-mean CPI decelerated on a YoY basis, continuing to suggest that disinflation (under the hood) is intact, despite the uptick in core & headline variables.
My stance for the past ~6 months or so is that labor market data has been more important than inflation, and I think the lack of concern around this week’s CPI & PPI data reaffirms that this is the correct stance.

Therefore, with less importance surrounding inflation, the most important datapoint for me this week came from the January 2025 retail sales data.
Market participants had expected a month-over-month decline of -0.2%; however, the data came in significantly worse at -0.9%.
This was a huge miss, bringing out all of the macro Doomers (once again) to warn about an impending recession around the corner.
Personally, I think a huge driver of this miss was the fire in Los Angeles.
With California being the 4th largest economy in the world if it were its own country, the state’s largest city having a major natural disaster, which began on January 7th, is likely a key driver (though not the sole driver) of the decline.
I’m not trying to dismiss the decline, but I think context is important.
I also think it’s important to zoom out.
This is the chart of Advance Retail Sales going back to the 1990’s.

See that little dip in January 2025?
That’s what the bears & Doomers want you to be afraid of.
Forgive me, but I see a bunch of choppiness in this datapoint throughout history and particularly during sustained uptrends in retail sales over time.
Dips are normal and even caused by seasonal impacts that can impact the MoM data.
Instead, if we analyze retail sales on a YoY basis, the data looks great!

You’ll notice that the ongoing growth rate for retail sales on a YoY basis is consistent with one of the strongest bull markets ever, during the 2012-2019 period, where retail sales were generally growing between +1.0% YoY and +5.0%.
Therefore, given the current YoY growth rate of +4.0%, I see nothing to worry about.
The Stock Market:
As I alluded to in the intro of this report, we’re seeing an abundance of stocks, ETFs, and indices make new all-time highs and/or secure their highest weekly closes ever.
That doesn’t typically happen during bear markets, downtrends, or recessions.
I’d encourage you to take 2 minutes and scroll through my recent posts on X where I highlighted 15 indices and ETFs in the United States that secured their highest weekly close ever on Friday.
Then consider the following…
Of the 500 stocks in the S&P 500:
87 stocks made new 20-day highs (17.4% of the index)
53 stocks made new 50-day highs (10.6% of the index)
37 stocks made new 52-week highs (7.4% of the index)
26 stocks made new all-time highs (5.2% of the index)
Perhaps breadth isn’t incredibly strong, but that isn’t my problem.
Regardless, what we know for a fact is that breadth is improving, but strong breadth is not required for the S&P 500 (or the Dow Jones and the Nasdaq-100) to perform well.
In fact, even despite “weak” breadth in 2025, the S&P 500 is up +4.01% YTD.
That might not sound like much, but it’s insanely strong to anyone who understands the power of compounding.
With a +4.01% return in 30 trading days so far in 2025, the index is tracking towards an annualized rate of return of +38.8% in 2025.
You can calculate this is through the following formula:

This is a phenomenal pace of returns, which would drastically surpass the strong returns for the S&P 500 in 2023 and 2024.
In other words, the market has been on fire in 2025, regardless of what bears want you to think or what headlines have suggested.
Shoutout to everyone who trusted my “less is more” thesis.
Bitcoin:
Two words: zoom out.
Best,
Caleb Franzen,
Founder of Cubic Analytics
This was a free edition of Cubic Analytics, a publication that I write independently and send out to 12,500+ investors every Saturday. Feel free to share this post!
To support my work as an independent analyst and access even more exclusive & in-depth research on the markets, consider upgrading to a premium membership with either a monthly or annual plan using the link below:
There are currently 970 investors who are on a premium plan, accessing the exclusive alpha and benefits that I share with them regarding the stock market, Bitcoin, and my own personal portfolio.
DISCLAIMER:
This report expresses the views of the author as of the date it was published, and are subject to change without notice. The author believes that the information, data, and charts contained within this report are accurate, but cannot guarantee the accuracy of such information.
The investment thesis, security analysis, risk appetite, and time frames expressed above are strictly those of the author and are not intended to be interpreted as financial advice. As such, market views covered in this publication are not to be considered investment advice and should be regarded as information only. The mention, discussion, and/or analysis of individual securities is not a solicitation or recommendation to buy, sell, or hold said security.
Each investor is responsible to conduct their own due diligence and to understand the risks associated with any information that is reviewed. The information contained herein does not constitute and shouldn’t be construed as a solicitation of advisory services. Consult a registered financial advisor and/or certified financial planner before making any investment decisions.
Each investor is responsible to understand the investment risks of the market & individual securities, which is subjective and will also vary in terms of magnitude and duration.