
Why I'm Completely Unconcerned

Investors,
There’s an interesting dichotomy taking place in the stock market right now.
And it’s simultaneously related to do three important topics:
Breadth
Risk appetite
Growth vs. value
The beautiful thing about the charts I’m about to share is that we can even extrapolate some important conclusions for Bitcoin, as well, creating a cross-asset review.
This report will be super concise and valuable, especially since I’m not seeing anyone else talking about these dynamics right now or connect the dots in this way…
So I want to start by looking at the performance of VUG/VTV:
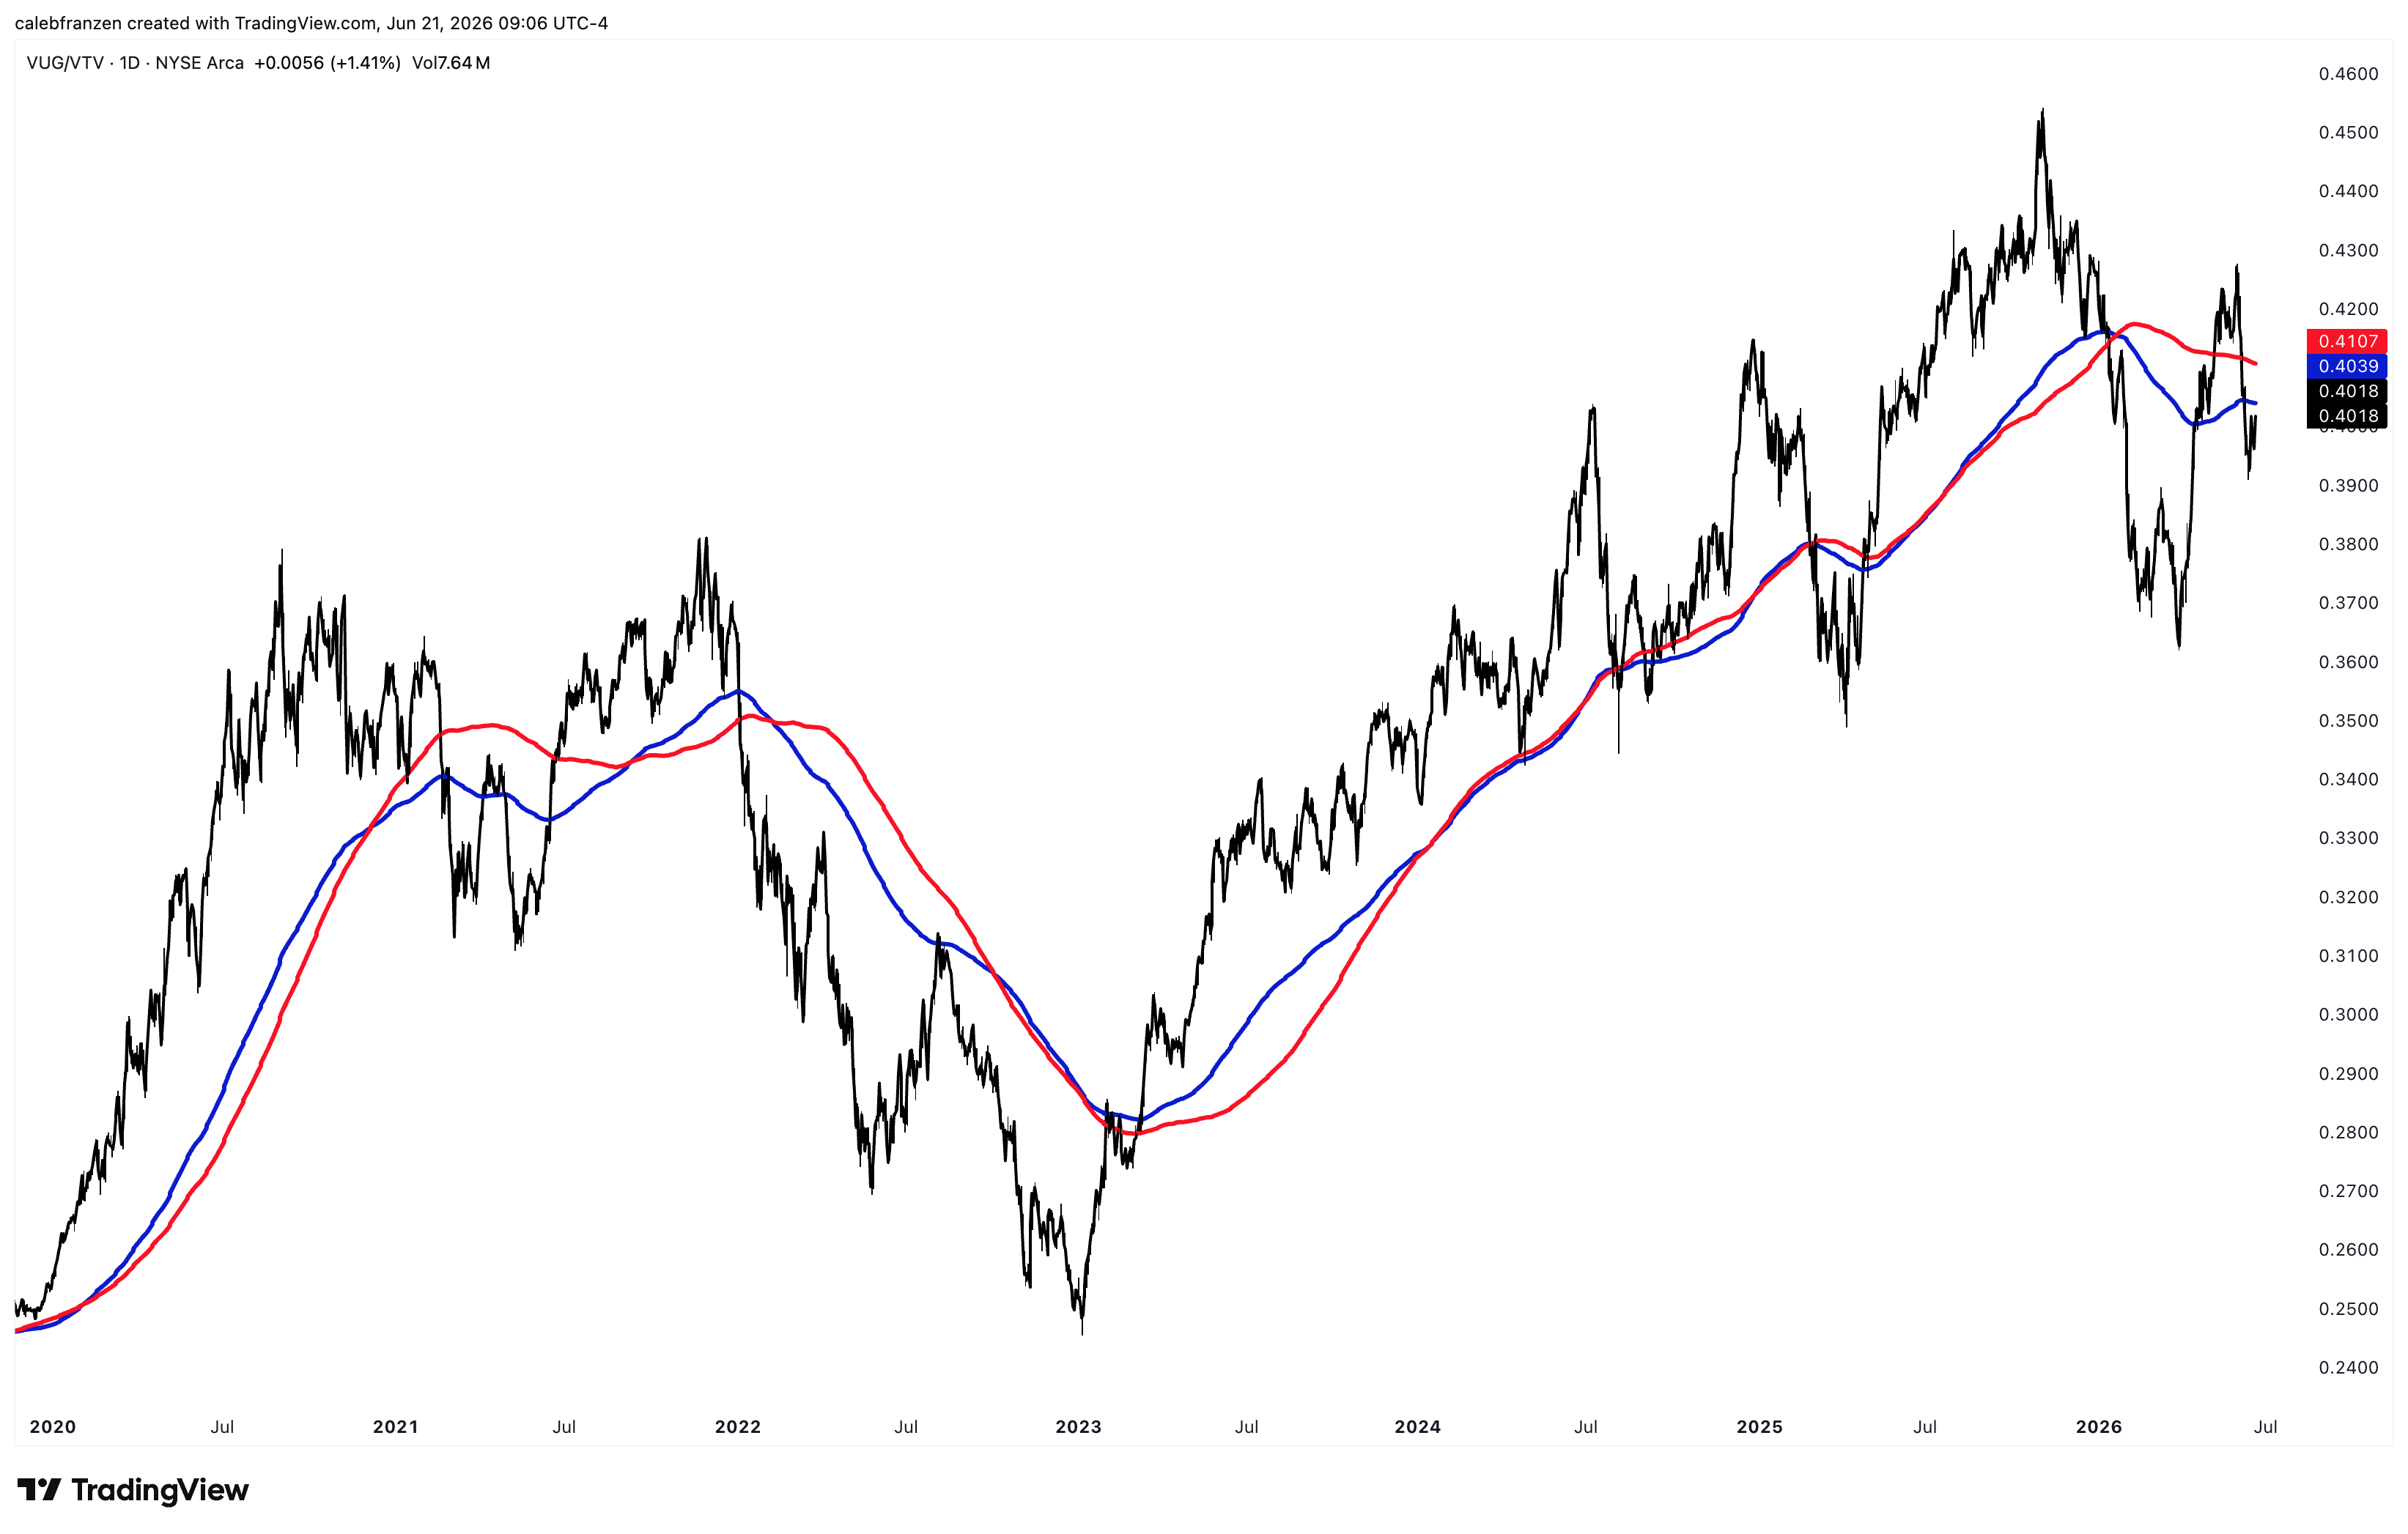
This relative performance chart is a key indicator within my toolkit, comparing a high risk asset vs. a low risk asset in order to diagnose risk appetite.
It’s pretty simple…
In bull markets, when investors are typically willing to take more risk, the chart of VUG/VTV tends to produce higher highs & higher lows, moving up over time.
In bear markets, when investors aren’t willing to take more risk, the chart of VUG/VTV tends to produce lower highs & lower lows, moving down over time.
We can literally see both of those regimes in the chart above going back to 2020.
It peaked when the stock market (and Bitcoin) peaked in 2021.
It bottomed when the stock market (and Bitcoin) bottomed in 2022.
And it’s continued to produce higher highs & higher lows for the past 3.5 years.
Here’s what happens if we overlay Bitcoin’s market cap over the same chart:
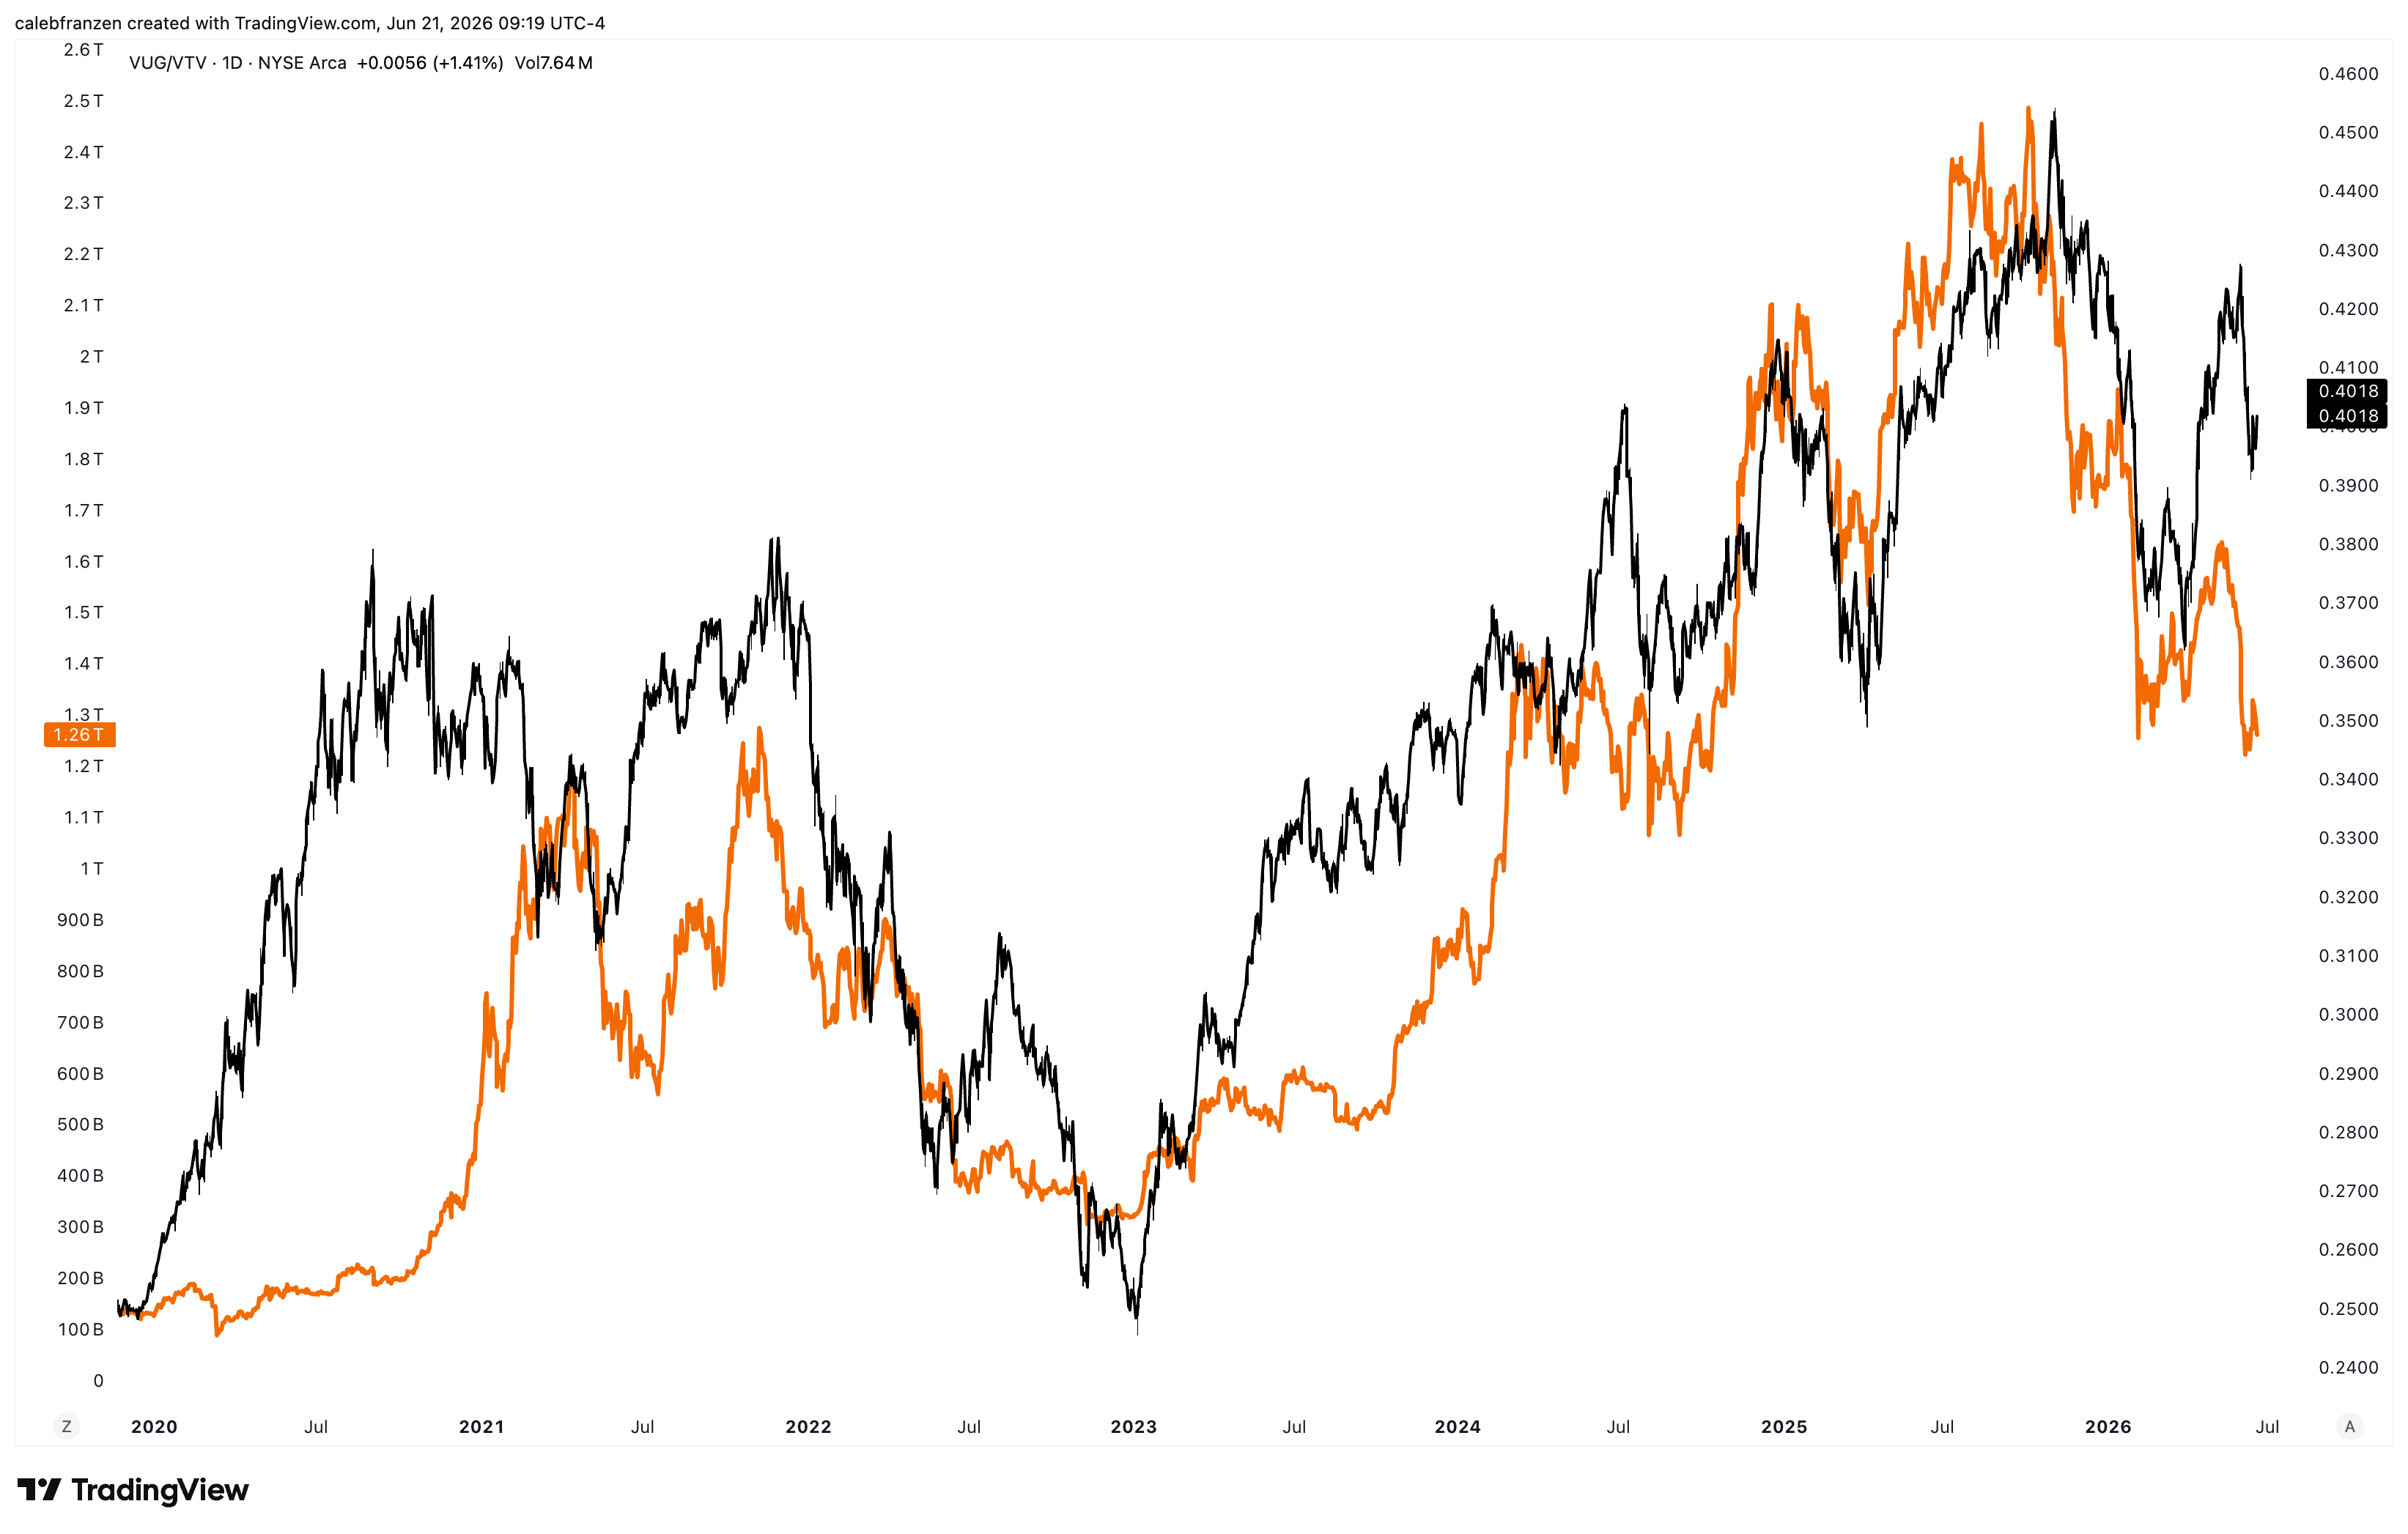
They aren’t perfectly aligned, but the correlation is enough to make us pause for a bit.
There’s perhaps some concern over the fact that VUG/VTV hasn’t made a new high in ~7 months, but this is why it’s vital to embrace nuance.
Take a look at this ratio instead: