Investors,
In weak markets, you want to play defense.
In strong markets, you want to play offense.
In other words, different strategies are effective in different conditions!
As investors, it’s our job to understand the market environment so that we can use the proper game plan in order to stay on the right side of the trend.
So how do we identify strong markets vs. weak markets?
The easiest way of determining the market environment is simply to see what kind of stocks are doing the best on a relative basis (scroll down for a real-time example).
In order to determine if we’re in a strong or weak market, we can evaluate how “offensive” stocks are performing relative “defensive” stocks! From there, the implications are straight forward:
If offensive stocks are outperforming defensive stocks, we’re in a strong market.
If offensive stocks are underperforming defensive stocks, we’re in a weak market.
Because asset prices trend (which we know for a fact), strong markets are likely to stay strong, while weak markets are likely to stay weak. Therefore, successful investors do a great job of recognizing which market environment we’re in so that they can deploy the best possible game plan to maximize risk adjusted returns.
Quite simply, investors should have a bullish bias in strong markets and a cautious or outright bearish bias in weak markets.
Which therefore leads to a key question: what kind of market are we in?
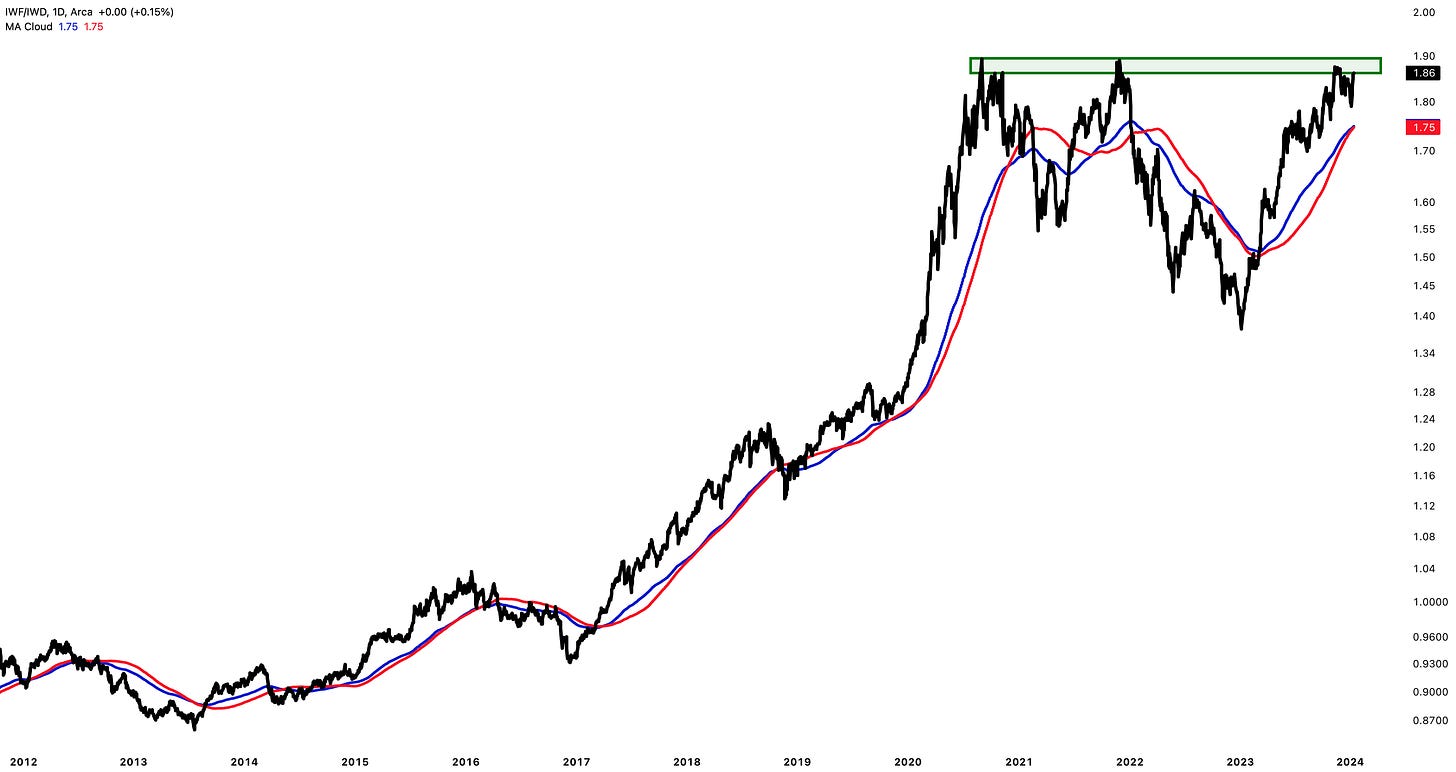
In order to answer this simple (but necessary) question, I’m going to illustrate offense vs. defense by comparing the relative performance of the Russell 1000 Growth ETF (IWF) vs. the Russell 1000 Value ETF (IWD):
For additional context, the top 10 holdings in $IWF are MSFT AAPL GOOGL AMZN NVDA META TSLA LLY AVGO and V (accounting for roughly 53.4% of the fund) while the top 10 holdings in $IWD are BRK JPM XOM JNJ PG CVX MRK WMT BAC and CSCO (roughly 16.9% of the total allocation, with the other 845 stocks making up the remaining percentage).
When the former are outperforming the latter (IWF/IWD ↑), we’re in a strong market.
When the former are underperforming the latter (IWF/IWD ↓), we’re in a weak market.
We can also evaluate performance relative to the 200-day MA cloud, to conclude that:
We’re in a strong market environment when IWF/IWD is above the 200-day MA cloud.
We’re in a weak market environment when IWF/IWD is below the 200-day MA cloud.
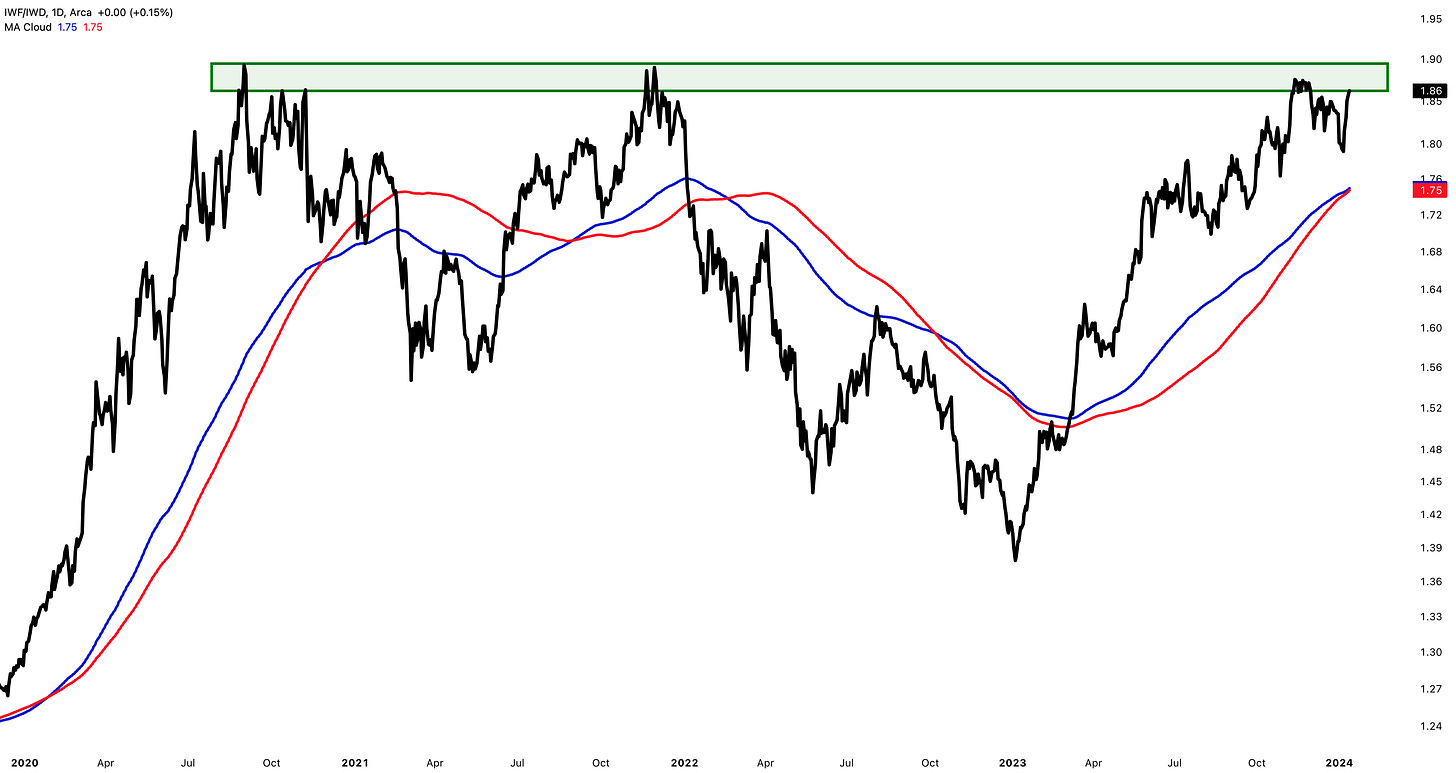
The past 10 years are predominantly displaying strong market dynamics, and as we know, we’ve experienced one of the strongest uptrends ever in the post-Great Recession environment. If we analyze the price action since 2020, we see:
Some key takeaways about the past before getting to the implications about the future:
The relationship peaked in November 2021, when the stock market peaked.
The relationship stayed below the 200-day MA cloud from Jan.’22 to Mar.’23.
The relationship bottomed in January 2023, just after the stock market bottomed.
The relationship has been above the 200-day MA cloud since March 2023.
What has it been doing since then? Making a series of higher highs & higher lows.
Even since the beginning of 2024, the ratio of IWF/IWD is rising and has gained +4% since January 5th! Therefore, here are the implications going forward:
If IWF/IWD can break above the green base (and make new ATH’s), that’s bullish.
If IWF/IWD continues to make higher highs and higher lows, that’s bullish.
If IWF/IWD continues to stay above the 200-day MA cloud, that’s bullish.
Simple enough, right? I think so.
As always, I try to make the free previews of these premium reports packed with alpha and intriguing data. To support my independent research and benefit from the full capabilities of Cubic Analytics, consider upgrading to a monthly/annual paid member!
In the remainder of this report, I’ll be sharing 8 charts and a myriad of data to provide a nuanced view on current market conditions. I’m even sharing one new stock that I started a sizable position in this week, while also reporting on the existing portfolio holdings that I added to.
These weekly reports act as a way for me to organize my thoughts, think critically, and really digest market dynamics in order to create refined and data-backed implications.


