Investors,
While the S&P 500 and the Nasdaq-100 make new all-time highs, Bitcoin is struggling.
The latest decline has seen BTC fall swiftly to $53.6k, with prices recovering above $57k on Friday & Saturday. Currently, Bitcoin is undergoing it’s largest drawdown of the bull market, falling a total of -23% from peak to trough (so far).
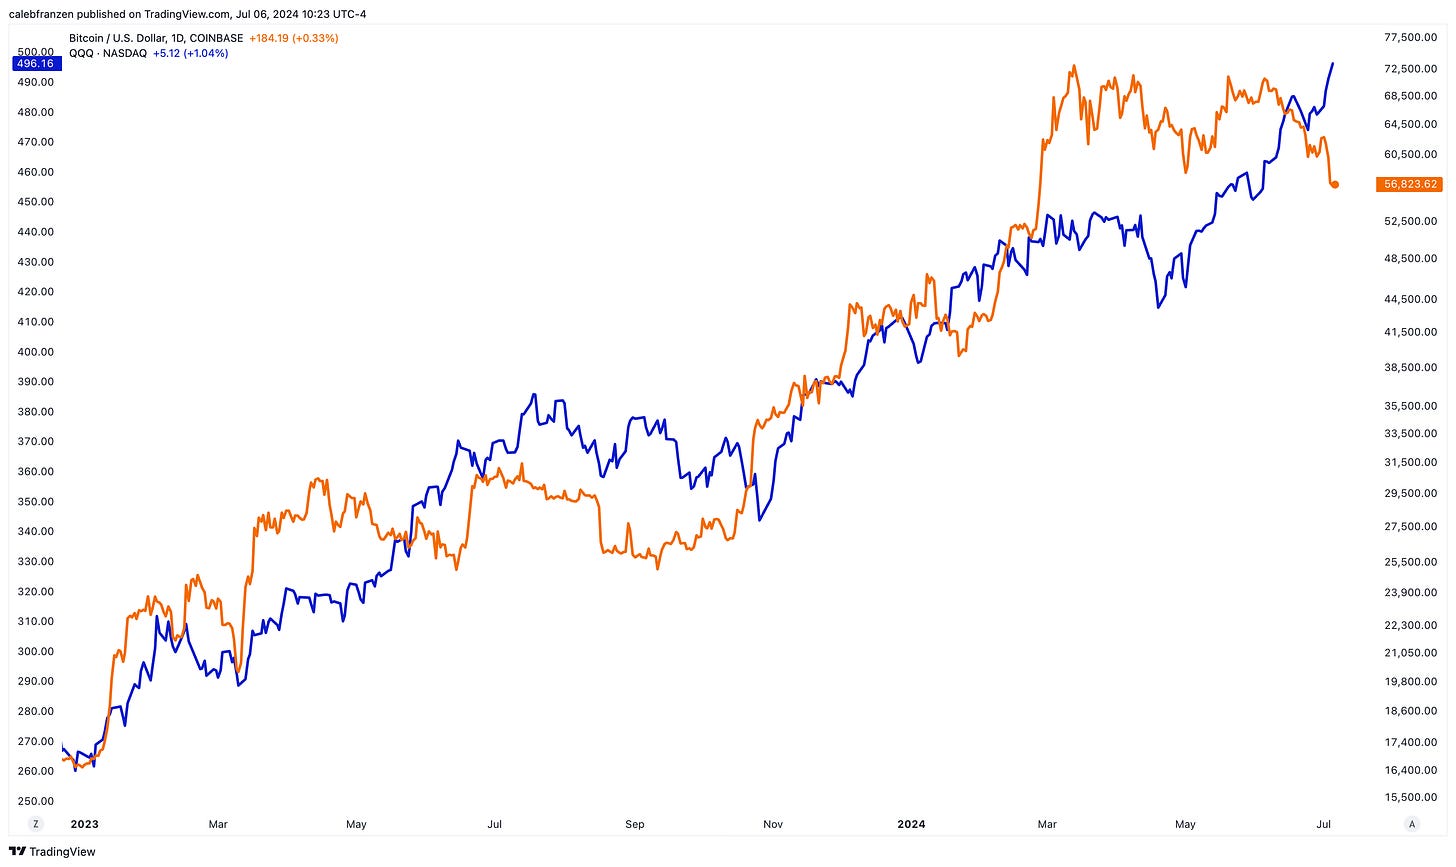
But why is Bitcoin diverging from the stock market, and which reference point should we use to define “the stock market”? For example, the following graph shows a clear divergence between:
🟠 Bitcoin ($BTCUSD)
🔵 Nasdaq-100 ($QQQ)
While the Nasdaq-100 is up +20% since the low on April 19th, 2024, BTC is down -9%.
However, Bitcoin & the equal-weight S&P 500 ($RSP) are much more correlated:
While this correlation is much tighter than the Nasdaq-100, it’s evident that Bitcoin is experiencing higher levels of selling pressure in this environment, perhaps due to idiosyncratic factors or perhaps due to a broader decline in risk appetite.
Personally, I don’t care why it’s happening… I only care that it is happening.
In this report, exclusive for premium members of Cubic Analytics, my goal is to analyze various indicators, signals, and inter-market relationships focused around Bitcoin in order to better understand current market dynamics and analyze how future dynamics might unfold.
In total, this report is 5,000+ words and contains more than 25+ charts.


