What I'm Buying and Why
Investors,
After a roughly 1-month hiatus of sitting on my hands in my investment account, I finally bought more stocks this week in my long-term portfolio.
A lot of them.
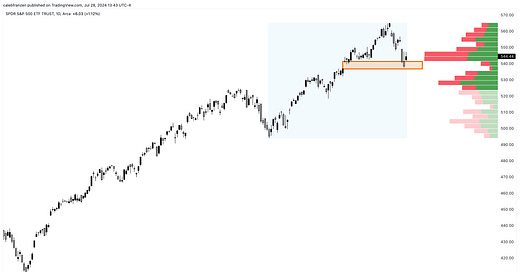
Quite simply, I view this decline in the S&P 500 and the Nasdaq-100 as constructive.
In other words, short-term pain is creating long-term opportunities, even if short-term pain continues for a bit longer.
The various statistical studies that I’ve created so far in 2024 and the ones that I’ve leveraged from other data-driven analysts all point to higher equity prices, on average, over the coming months, quarters, and years. As I’ve said before, markets don’t operate in a statistical vacuum, absent of macroeconomic influences; however, they allow us to mute out the noise and focus simply on what matters most: price.
This type of approach, using statistical indicators and analysis to help shape my overall investment view, allowed me to maintain a long-term bullish stance on equities in the 2nd half of 2022 — during one of the worst correlated declines in U.S. market history!
Just look at the study that I shared in real-time, exactly two years ago, for the Nasdaq:
I even shared forward return implications as well, highlighting how bullish things tend to happen after this signal occurs, even if some short-term volatility persisted:
Now that we’ve officially reached the 2-year mark, we can update the return table:
The bullish long-term signal worked, even if short-term returns deviated from past results. Even with a 2-year return of +47% (CAGR = +21.2%), the Nasdaq is actually underperforming vs. how it has typically performed in past signals.
Maybe the market isn’t as stretched or overbought as some analysts want us to believe.
Anyways, the point remains…
Over the course of the past few years, and especially so far in 2024, I’ve shared a variety of data-backed indicators that are flashing bullish signals for equities which suggest, both independently and on the aggregate, that bullish dynamics should continue to persist, based on average historical return data from those signals.
Could the signals be wrong or invalidated? Absolutely.
But that merely points to the need to be multi-faceted, which is what I specialize in at Cubic Analytics — creating an all-encompassing & nuanced perspective via a thorough review of macroeconomics, technical analysis, and indicators.
Either way, the weight of the evidence suggests that objective investors should continue to have a bullish bias on equities over the medium & long-term, which therefore suggests that short-term weakness should be bought…
So that’s exactly what I’m doing, comfortable with the risk that asset prices could continue to dip lower in the short-term, in which I’ll buy even more.
In this report, I’ll cover some of the key data that I’m seeing right now and share exactly what I purchased this week (and why).
These Sunday reports, which are exclusive for premium members, are packed with alpha specifically regarding the stock market and/or crypto. In total, this report contains 3,200 words and 17+ original charts.
To support my work as an independent analyst and access this report (and future reports), consider upgrading to a premium membership using the link below!


