
What If Bitcoin Breaks Down?

Investors,
It’s rare when I send out an emergency newsletter like this, but my latest findings warrant an unscheduled report, particularly for Bitcoin investors.
Because this is so important, I’m making this report completely free & available to all 12,528 investors who are subscribed to Cubic Analytics. Because it’s free, you can send it to as many people as you want.
Let’s begin.
Bitcoin is potentially at a major inflection point and I have two ways to back this up.
Actually, three ways…
The purpose of this analysis is to answer the question “what happens if Bitcoin breaks down”, but in order to answer that, we first need to define what a breakdown would look like.
These are the three indicators that I’m using to represent a breakdown:
1. Bitcoin vs. the short-term holder realized price (STHRP): This on-chain metric tracks the rolling 155-day price of all Bitcoin that have been transacted on the network, providing a real-time pulse of the market’s short-term cost basis. Though it isn’t perfect, the STHRP tends to act as support during bull markets and resistance during bear markets. Additionally, we can categorize bull markets as periods where Bitcoin’s price is sustainably above the STHRP while bear markets are periods where price is trading below STHRP.

At the present moment, Bitcoin’s STHRP is trading at roughly $92,000 vs. the current price of $94.2k at the time of writing. Therefore, the STHRP is valid potential support; however, I would be highly concerned if price falls (and stays) below this dynamic level.
2. BTC vs. the Election Day anchored volume-weighted average price: Also referred to as the AVWAP, this metric is another way to quantify the market’s cost basis, “anchored” to a specific starting point. Given the significance of the Election Day and the subsequent results which helped to ignite a new wave of demand for equities and Bitcoin/crypto, I think this is a highly significant level to pay attention to.
Thankfully, the market agrees with me, as the AVWAP has been near-perfect support in each of the 5 times that Bitcoin has retested this level.

BTC is currently retesting it once again, now marking the 6th retest since the election.
Given the consistency of the rebounds, I think we have two key takeaways:
If price > AVWAP, then that’s a good sign for bulls
If price < AVWAP, then that’s a good sign for bears
Staying flexible around this range will be important.
3. The 100-day EMA + 200-day EMA cloud: These are two extremely important moving averages that I pay attention to, particularly using the exponential settings.
🟢 100-day EMA
🔵 200-day EMA
Together, these two EMAs create a dynamic support/resistance range, which I refer to as a “cloud”. Like every other indicator, this one isn’t perfect; however, I also interpret breakdowns and breakouts above/below the cloud to represent inflection points in the trend.
As of today, Bitcoin is once again retesting the 100/200-day EMA cloud as potential dynamic support:
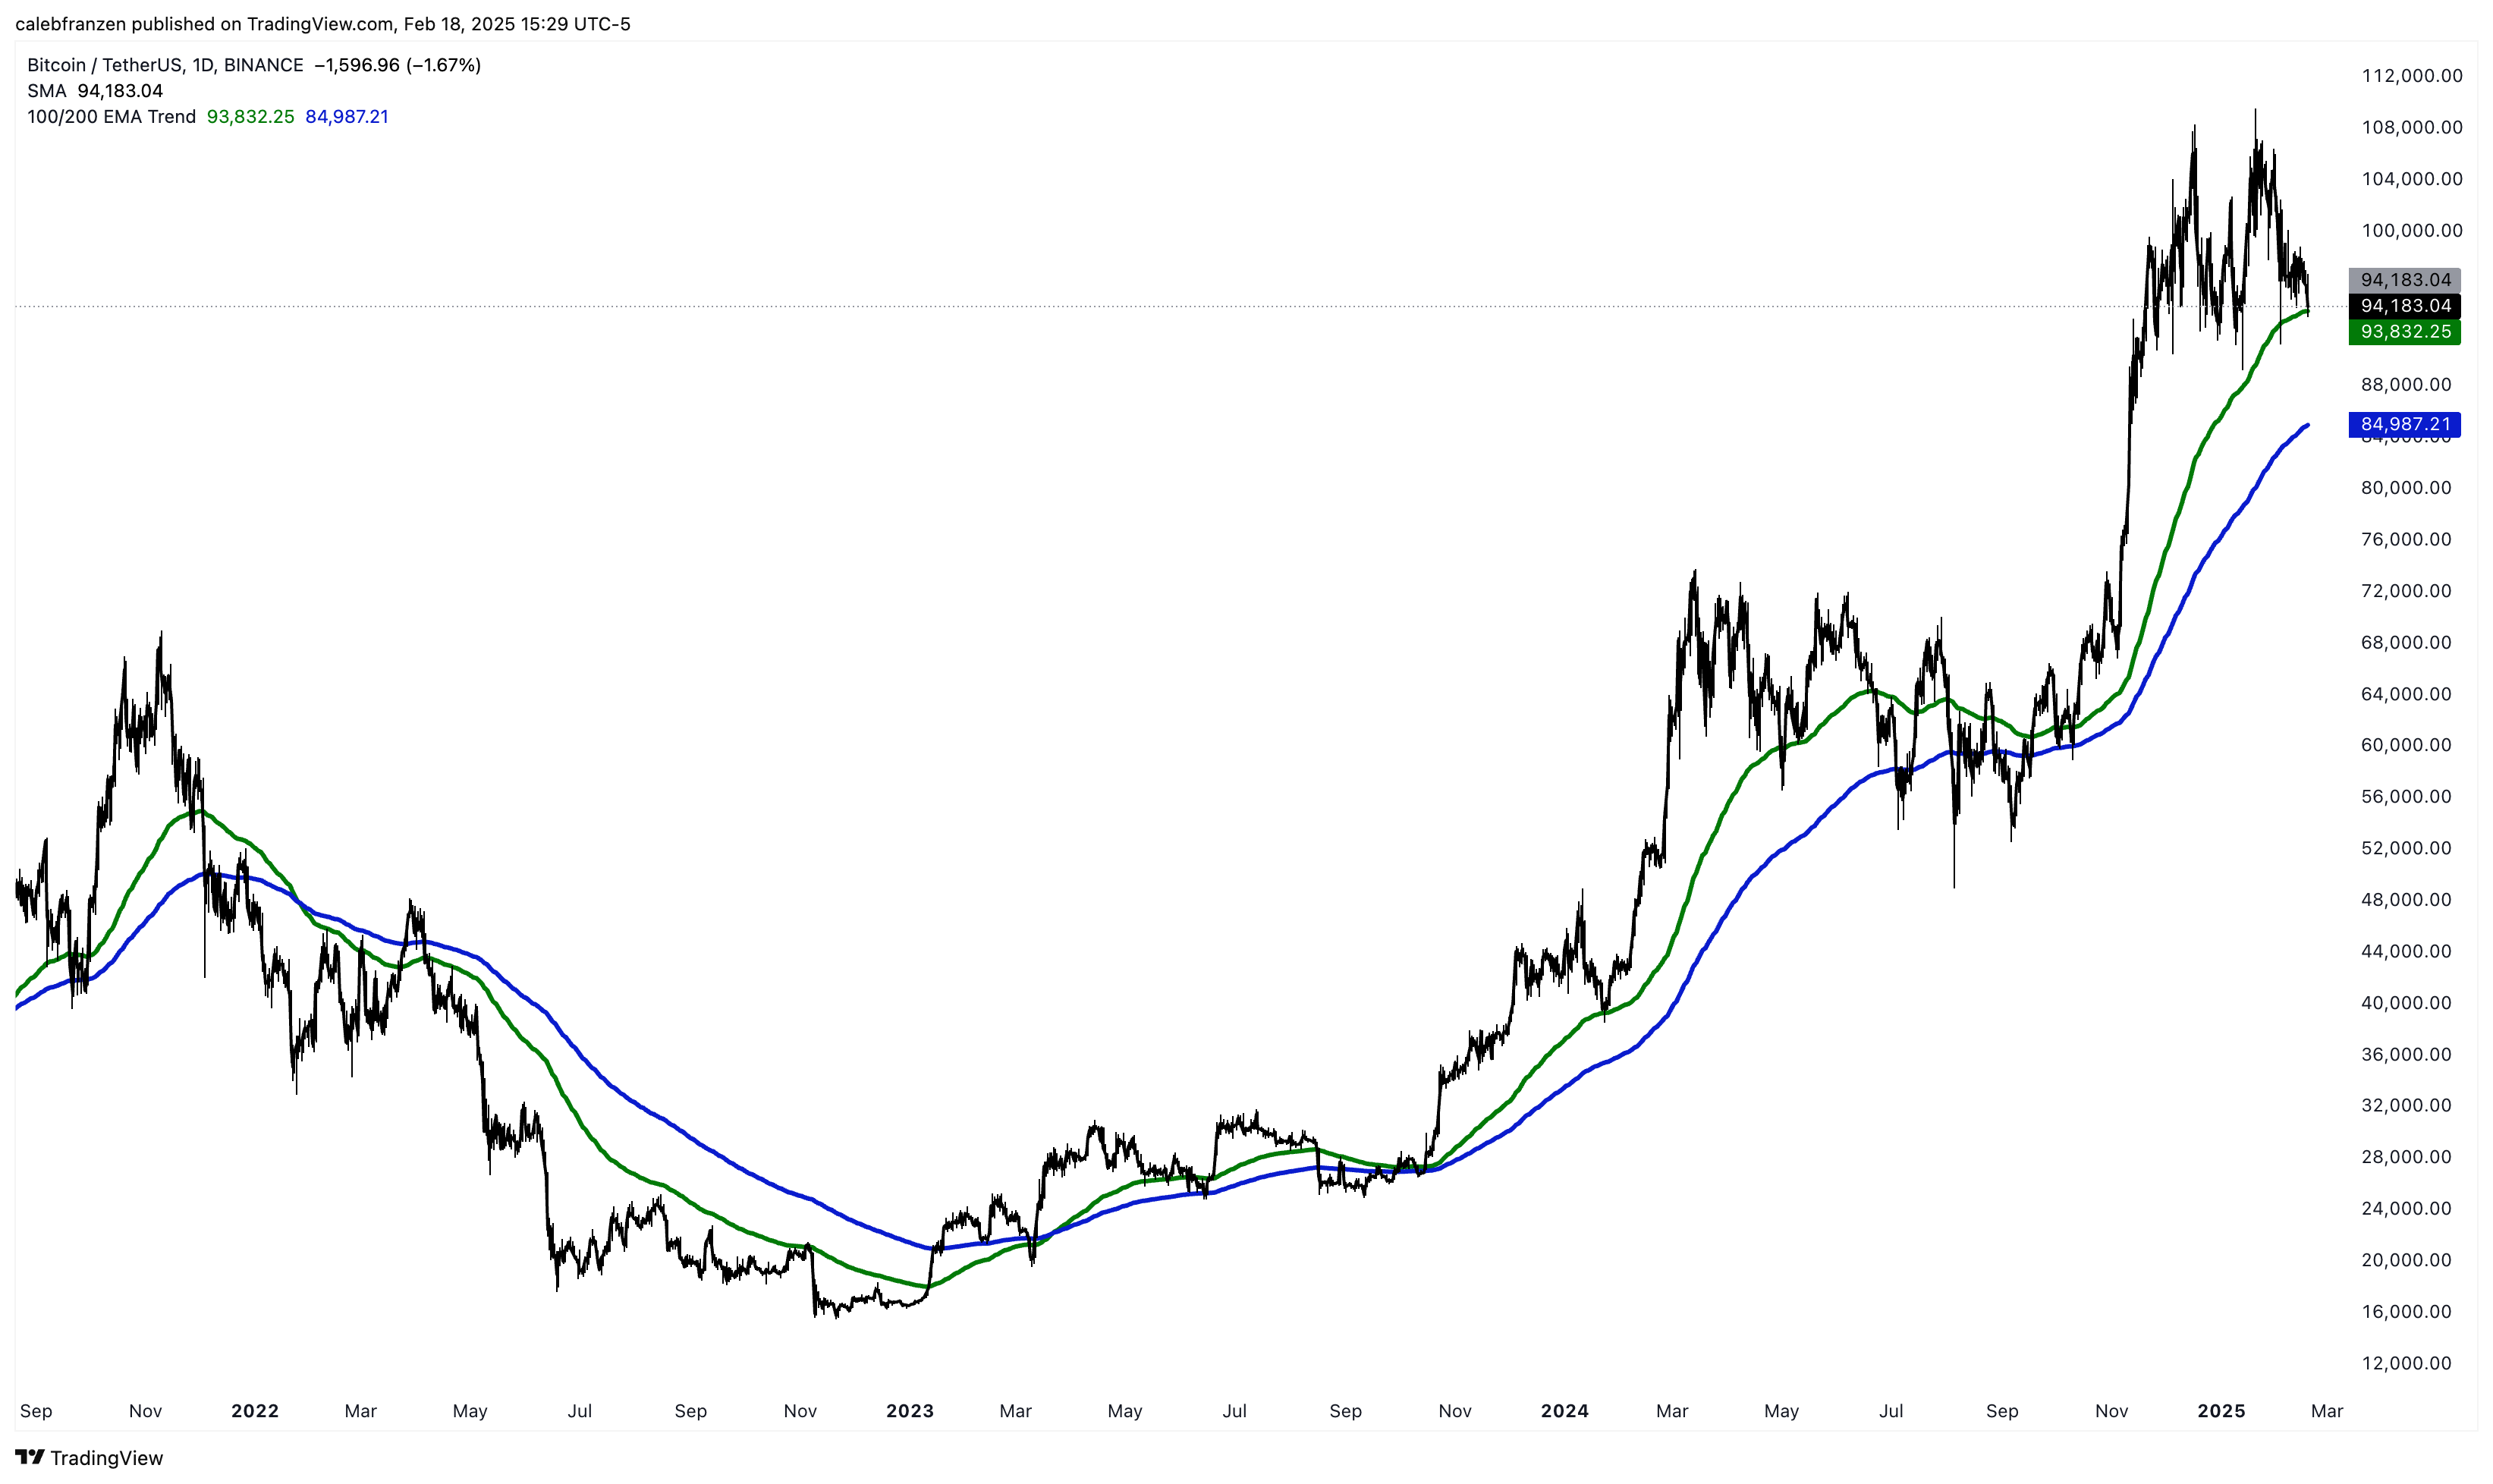
The lower-bound of this cloud, the 200-day EMA, is currently at ~$85,000.
That’s only -10% away from the current price.
Together, these charts represent a cluster of prices that are critical for bulls to defend:
STHRP = $92,000
Election Day AVWAP = $94,000
100 + 200-day EMA cloud = $85,000-$93,800
From a statistical perspective, all three of these levels are potential dynamic support.
Key word, “potential”.
Together, these levels provide a quantifiable way to define a line in the sand, in which a breakdown below these levels would represent incrementally more bearish behavior.
Because we’ve now identified where a breakdown might occur, we can now attempt to address the premise of this report and answer the question, “what happens if Bitcoin breaks down?”
Factually, breakdowns below key support levels are bearish.
So, if (still a big “if”) Bitcoin breaks below these three support levels, then we should be prepared for additional downside and shift our attention lower.
I think this chart has the answer for where Bitcoin could fall to if these levels break:

In this analysis, I’m relying on two volume-weighted indicators:
1a. The AVWAP from the March 2024 all-time highs
1b. The AVWAP from the August 2024 pivot lows
2. The anchored volume profile (AVP) from the August 2024 pivot lows
Very similar to the AVWAP analysis that I conducted previously, my focus on these two AVWAPs helps to isolate investor behavior since two very specific starting points.
In red, we’re isolating the aggregate cost basis of all Bitcoin transacted on Coinbase since the March 2024 all-time highs, which began a 6-month consolidation before the next leg higher.
In green, we’re isolating the aggregate cost basis of all Bitcoin transacted on Coinbase since the August 2024 lows, which initiated the rally from $49k to $109 in 6 months.
Therefore, if we’re going to anticipate a mean reversion back to the market’s cost basis, it makes sense to focus on these two levels as a potential downside price target.
This creates a target range of $77,000-$80,200.
Here’s the same chart so that you don’t need to scroll back up:
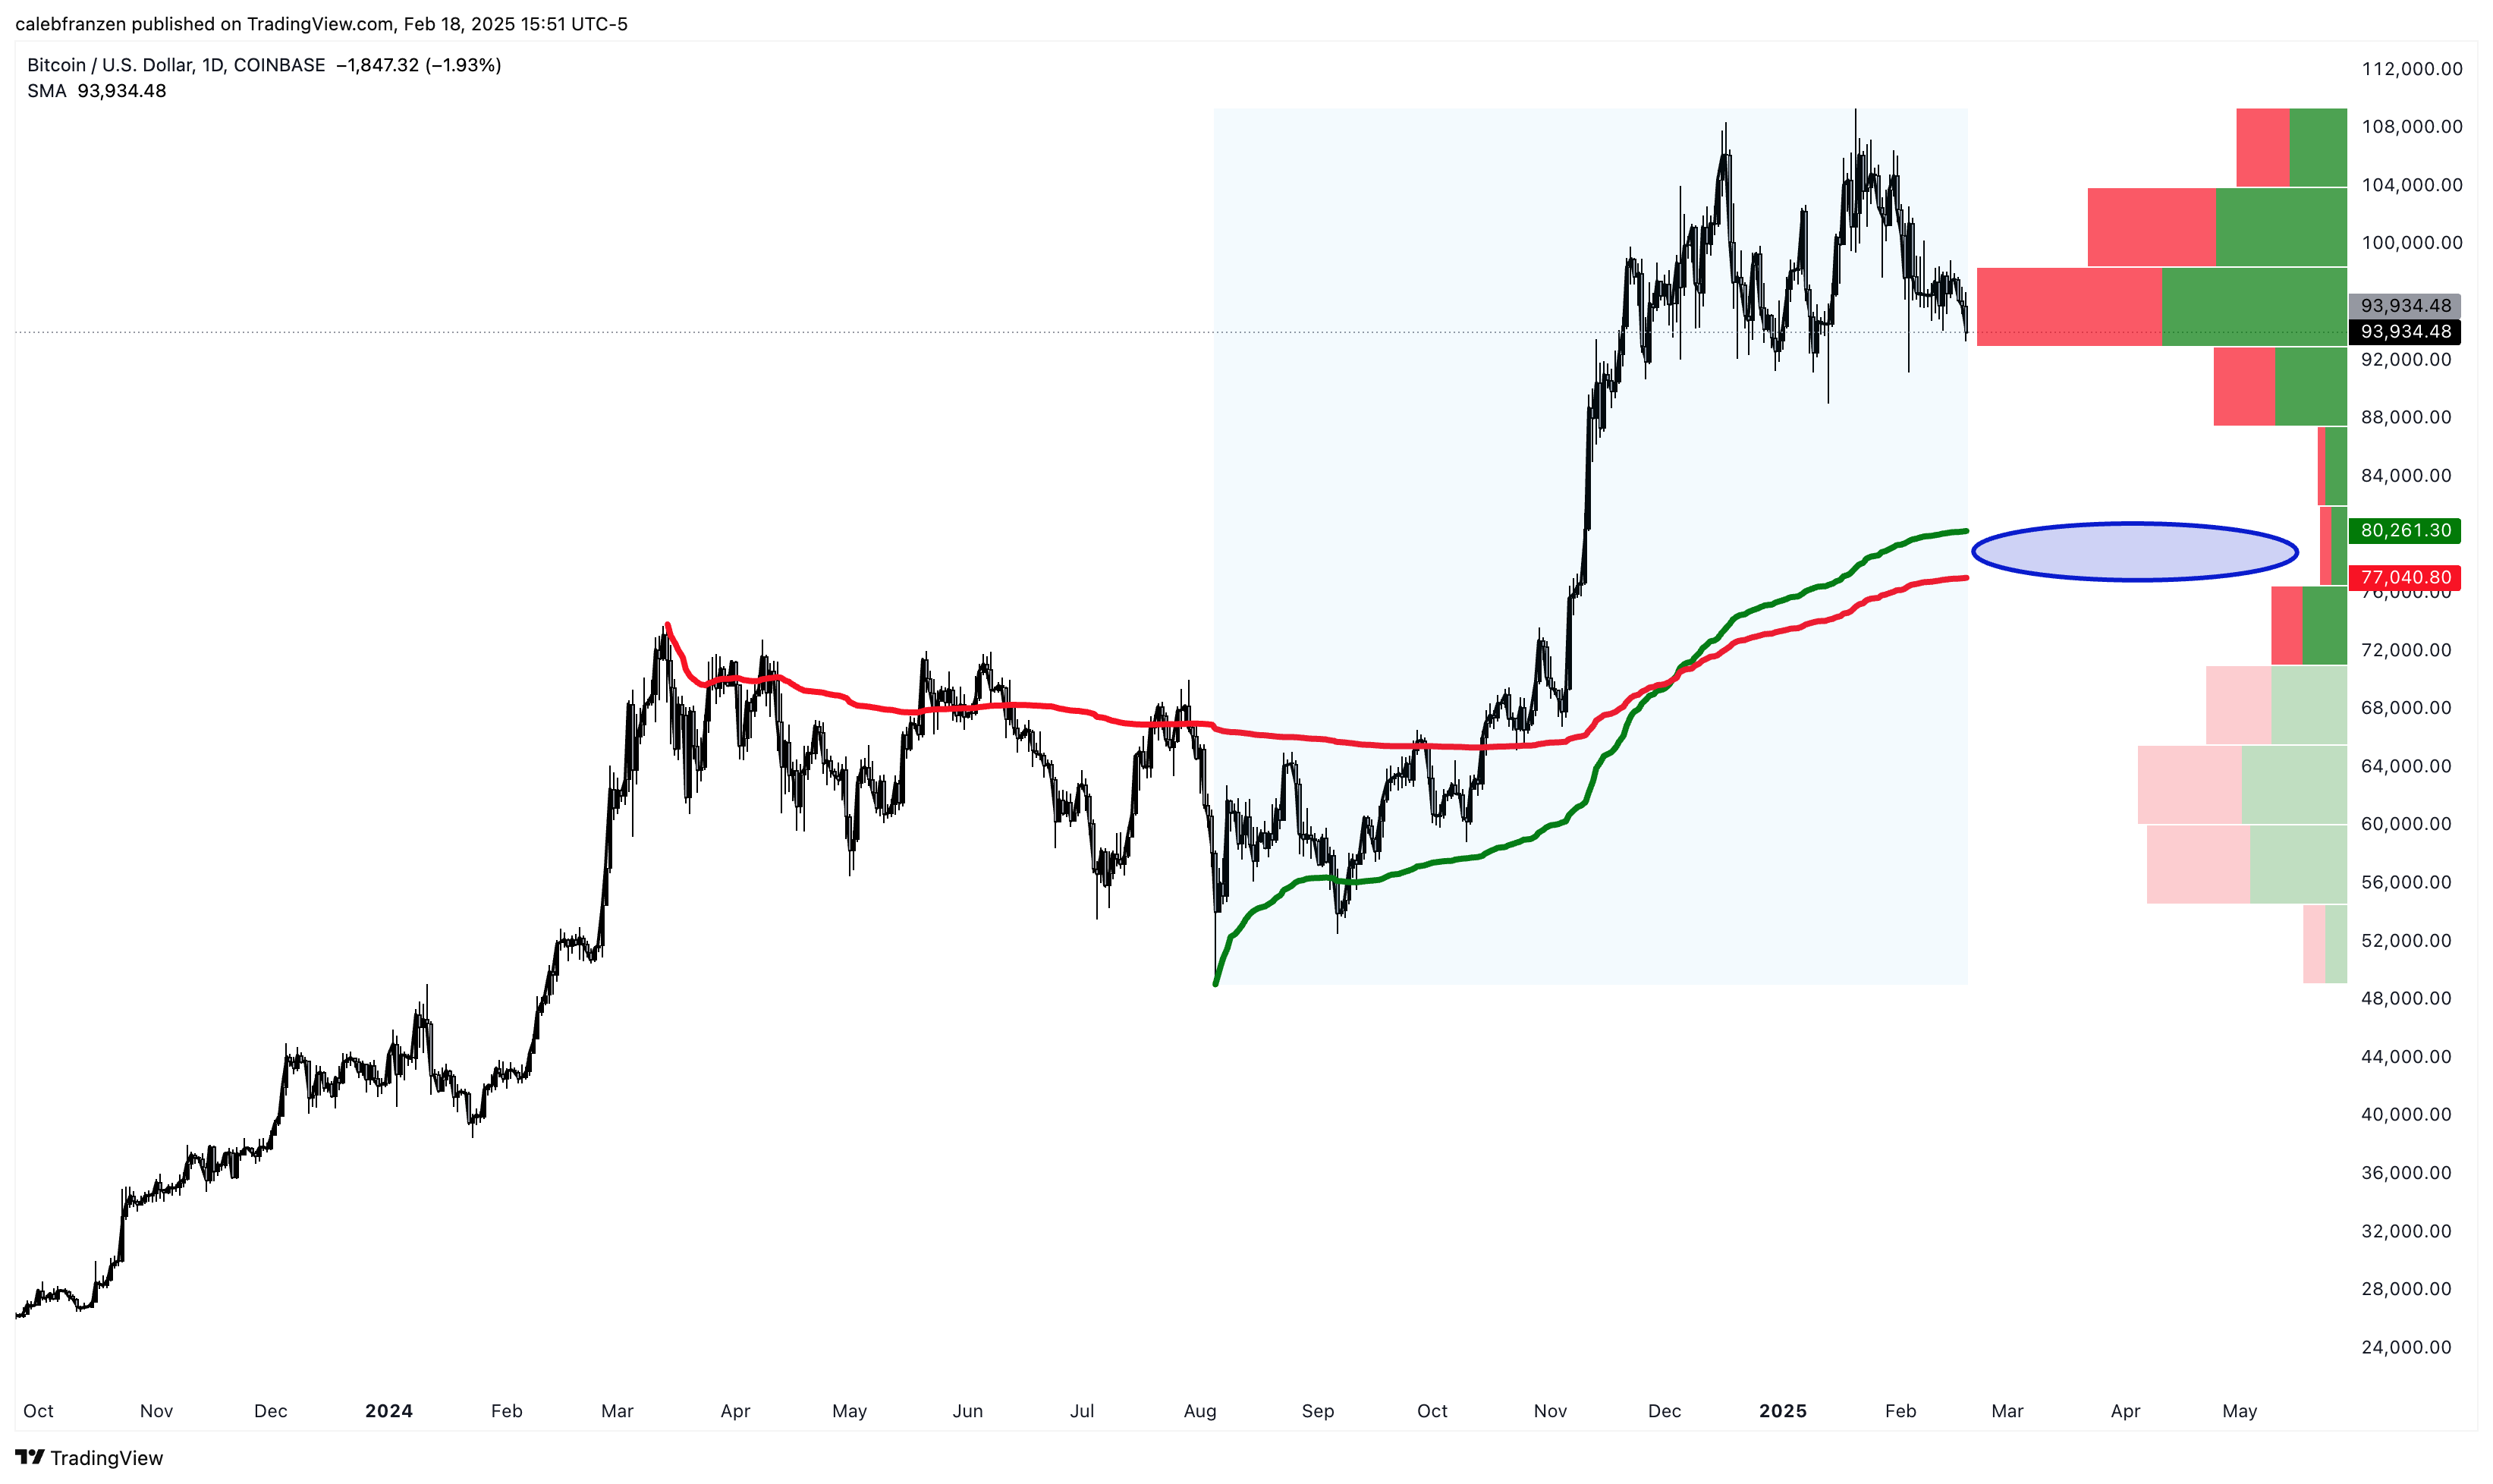
Additionally, I’m using another tool called the anchored volume profile, which isolates the clusters of volume from a specific starting date in order to capture which price ranges have experienced the most (or least) volume.
Often times, we see pockets of low volume get “filled”, making the smallest cluster a critical range of interest during a mean reversion period.
In this particular case, the AVP’s lowest volume range is $76.8k-$80.1k.
In other words, perfectly aligned with the AVWAP ranges we just reviewed!
Said differently, we have legitimate confluence based on actual investor behavior right in this range, which cements the significance of this price range as a downside target.
I’ve outlined this confluence in blue as the next major support level post-breakdown.
Until further notice, this is my current downside price target that I’m willing to consider as my “worst case scenario”, based on current market conditions.
This target is subject to change.
This target isn’t even guaranteed.
For all we know (and it’s typically best to assume we know nothing), the 3 potential support levels that I outlined could prop up Bitcoin & rebound it to new all-time highs.
As always, it will be important to stay flexible, dynamic and adaptable; however, I don’t want to discount the fact that Bitcoin is still in a significant uptrend and that I would much rather align with this uptrend than fight it.
As such, despite recognizing that more downside is potentially in store (particularly if the breakdown occurs), I’m not going to consider selling any Bitcoin until we have clear & concrete proof of a breakdown.
If that breakdown occurs, I will consider selling between 10%-20% of my current Bitcoin holdings with the intention of buying it all back in the $77k-$80k range.
I don’t promise to have all of the answers and I certainly can’t guarantee that this strategy will work, but it’s important for me to outline my process, to highlight the key data that is actively shaping my outlook on the market, and to explain how I’m implementing that analysis to make actual investment decisions.
If you found this valuable, you can share it with anyone who will benefit from it.
Best,
Caleb Franzen,
Founder of Cubic Analytics
This was a free edition of Cubic Analytics, a publication that I write independently and send out to 12,500+ investors every Saturday. Feel free to share this post!
To support my work as an independent analyst and access even more exclusive & in-depth research on the markets, consider upgrading to a premium membership with either a monthly or annual plan using the link below:
There are currently 970 investors who are on a premium plan, accessing the exclusive alpha and benefits that I share with them regarding the stock market, Bitcoin, and my own personal portfolio.
DISCLAIMER:
This report expresses the views of the author as of the date it was published, and are subject to change without notice. The author believes that the information, data, and charts contained within this report are accurate, but cannot guarantee the accuracy of such information.
The investment thesis, security analysis, risk appetite, and time frames expressed above are strictly those of the author and are not intended to be interpreted as financial advice. As such, market views covered in this publication are not to be considered investment advice and should be regarded as information only. The mention, discussion, and/or analysis of individual securities is not a solicitation or recommendation to buy, sell, or hold said security.
Each investor is responsible to conduct their own due diligence and to understand the risks associated with any information that is reviewed. The information contained herein does not constitute and shouldn’t be construed as a solicitation of advisory services. Consult a registered financial advisor and/or certified financial planner before making any investment decisions.
Each investor is responsible to understand the investment risks of the market & individual securities, which is subjective and will also vary in terms of magnitude and duration.
May I also add that:
- Weekly Bull Market Support Band matches the next lower level of resistance (low of Feb 3 at 91 157$), where liquidity is calling.
- CME gap between 80 700$ and 77 300$.
I wouldn’t be surprised if we see a rapid wick in the next 48h to one of these levels.
Currently, what do you think of Bitcoin’s price action over the weekend? Low volume but interesting to see it holding pre-Friday levels. Bull trap and a liquidity grab around $92 when MMs flush it or a sign of strength?