What Happens After $70k?
Investors,
Bitcoin crossed above $70,000 this week, but is that any surprise given the overwhelmingly bullish data that I’ve been posting for the past 14 months?
Quite literally, my first (and only) TikTok post in January 2023 highlighted how BTC was breaking above its short-term holder realized price, a key bull market signal.
At the time, BTC was trading around $17,000.
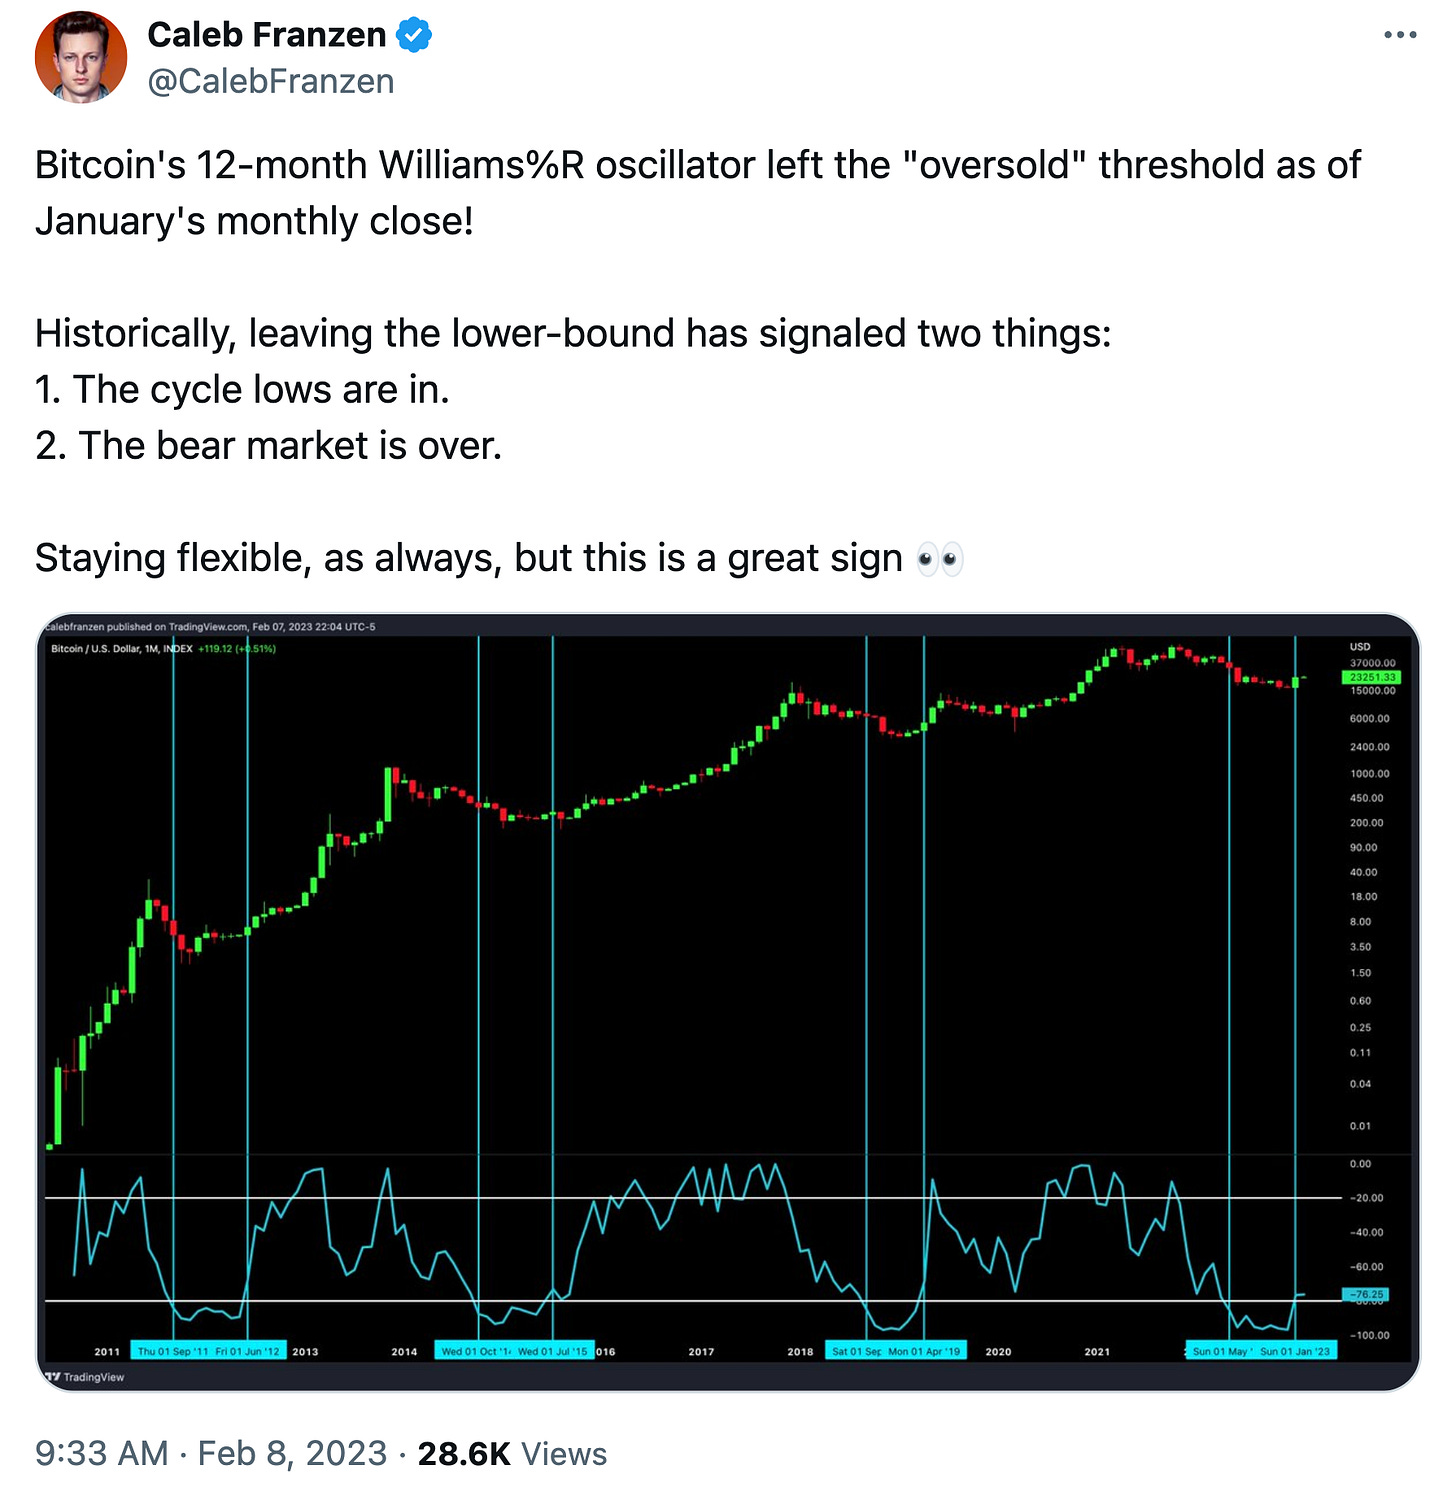
In the weeks & months after that, I highlighted how the 1-year, 1.5-year, and 2-year Williams%R Oscillators broke above their respective “oversold” levels, which provided additional confirmation that we were moving further into the bull market.
Take this post from February 2023 as an example, when BTC was $23,000:
Indeed, the cycle lows were in and the bear market was over.
One month later, the 2-year signal also flashed:
I did my best to spread awareness about these objectively bullish signals. In fact, I continue to make those efforts today, recently sharing another bullish Williams%R study just a few weeks ago when BTC was trading at $51,000.
Therefore, I ask again: is it really a surprise to see BTC trading at new all-time highs?
Personally, I’m not surprised at all.
As frequent readers of Cubic Analytics, I’m hoping that you’re not surprised either.
As I look forward, I am still focused on my $175,000 price target from the 161.8% level.
In the remainder of this report, I’ll cover the key data & charts that stood out to me this week, pertaining to the three topics: macro, the stock market, and BTC.
As always, these Saturday reports are completely free and now have 10,000+ investors who are subscribed to receive this research. As a way to support my endeavor as an independent analyst, please consider:
Liking this post
Sharing it with a colleague
Leaving a comment to let me know what you think
Let’s begin!
Macroeconomics:
The labor market is resilient & dynamic.
You’ve heard me say that quite a bit over the past two years.
The latest round of labor market data proves once again that these two adjectives are the perfect way to describe the current & ongoing conditions for the U.S. labor market.
Is the labor market perfect? Absolutely not.
Is the labor market absent of weakness? No, there is some weakness.
Is the labor market unequivocally strong? Meh, it depends on who you ask.
However, it is objectively true that the labor market has been resilient & dynamic given the broader macro pressures, the rate hike cycle, and constant fear-mongering.
The Indexes of Aggregate Weekly Private Payrolls of All Employees continued to move higher in February 2024, reaching a new all-time high and growing at a pace of +5.3% YoY.
The ADP Private Payroll data was published, again confirming that more people are employed in the U.S. than ever before:
Private payrolls grew by 140,000 in February 2024, with growth in all company sizes:
If we were in the imminent recession that Doomers have been warning about for 18 months, the data would need to do a complete 180° turn and actually contract.
The Job Openings and Labor Turnover Survey (JOLTS) data was also released for January 2024, showing job openings decline, the quits rate decline, and the layoff rate remains historically low.
Job openings at the end of January were 8.863M, down from 8.889M in December 2023.
But why is this such an important datapoint?
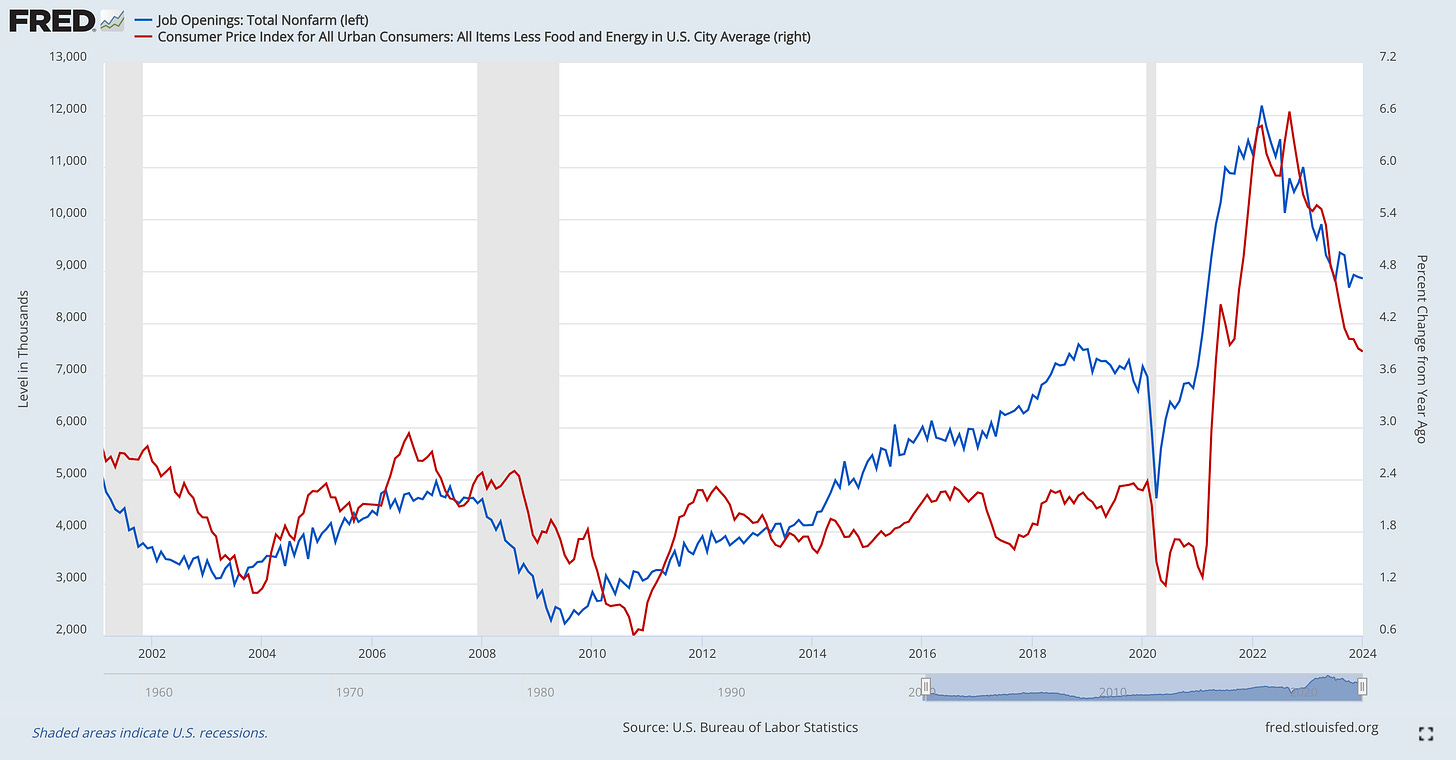
As I’ve highlighted in the past, my research shows a clear correlation between job openings and the core CPI inflation rate on a YoY basis:
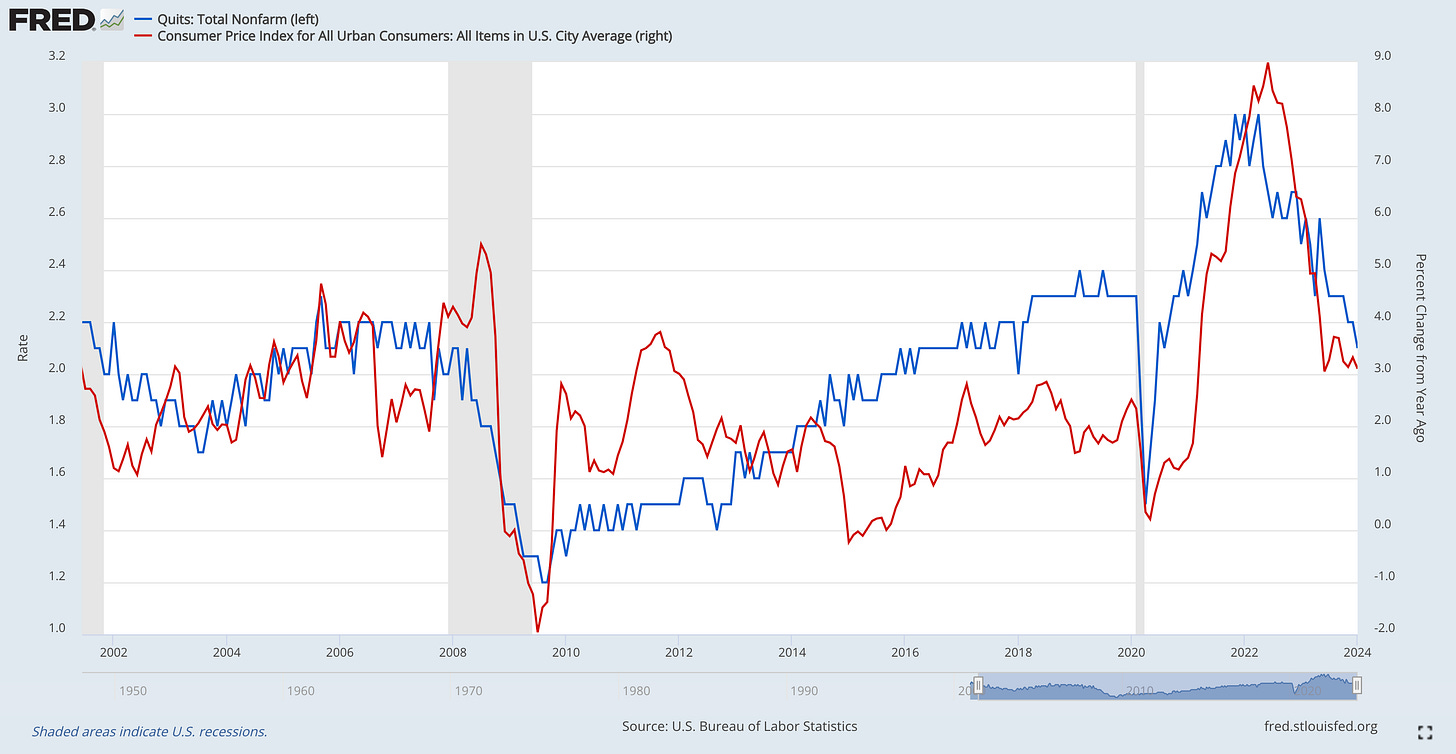
The quits rate also moved lower, falling from 2.2% to 2.1%, which also has major implications for CPI inflation:
In combination, these two charts provide further evidence that:
The disinflationary trend is intact.
The disinflationary trend will persist.
It’s Econ 101: Job-quitters experience faster wage growth. As the rate of job-quitting declines, wage growth should decelerate. Wage growth deceleration means that consumer price inflation should also decelerate. The data supports this 100%.
These forward-looking indicators with a fundamental basis for forecasting the direction of inflation continue to imply that the rate of YoY inflation will fall.
In other words, inflation will decelerate.
In other words, disinflation.
Personally, I didn’t see much alpha in the nonfarm payrolls data on Friday.
The overarching theme was:
An uptick in the unemployment rate
Decelerating wage growth
Higher than expected job growth
These datapoints, on the aggregate, indicate that more disinflation is coming and that the labor market continues to stay resilient & dynamic.
Stock Market:
Last weekend, I predicted that the equal-weight version of the S&P 500 would hit new all-time highs in the near future. It turns out, all we needed to do was wait one week.
The equal-weight S&P 500 ETF ($RSP) officially made new all-time highs on Friday:
In turn, we had 66 stocks in the S&P 500 make new 52-week highs on Friday, of which 55 of them made new all-time highs. Meanwhile, 0 stocks made new 52-week lows.
When more stocks are making new highs than the amount making new lows, that’s a defining characteristic of an uptrend and/or a bull market. At the end of the day, the stock market doesn’t hit new all-time highs during a bear market, right?
So if we’re not in a bear market, then we’re more likely than not in a bull market.
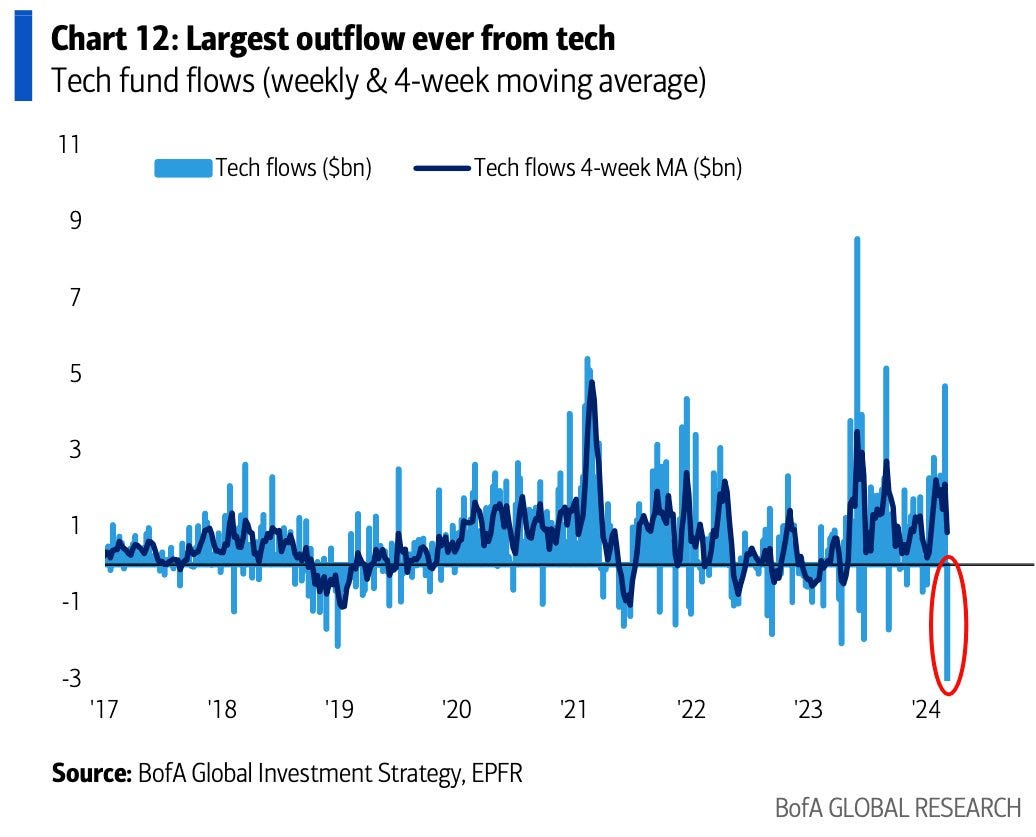
Another defining characteristic of a bull market is sector rotation, which is why it’s so interesting to see that technology stocks had their largest outflows of all-time:
This was the first weekly outflow in tech in 9 weeks.
So where is capital flowing? Hard to say, but I have some theories.
1. Energy stocks ($XLE) are quietly up +10.5% since their January 2024 lows.
2. Financial stocks ($XLF) continue to grind higher, despite the newest concerns around New York Community Bank ($NYCB). I mean, hey, JP Morgan Chase ($JPM) has been making new all-time highs repeatedly throughout 2024! The sector is rapidly approaching new ATH’s, up more than +29% since the October 2023 lows.
Nonetheless, tech is still performing extremely well in 2024.
The Nasdaq-100 is up +7.1% (lagging the S&P 500), while equal-weight technology stocks ($RSPT) are up +7.8% (outperforming the S&P 500).
Therefore, I largely view the outflows out of tech & into other sectors as a bullish indication, particularly if tech is still performing well, on the aggregate.
Bitcoin:
Aside from the Bitcoin analysis that I shared at the beginning of this report, I wanted to highlight one other important aspect: it has never been bearish for Bitcoin when the price makes a new all-time high.
I actually wrote about this a few weeks ago on X:
While BTC has experienced diminishing returns from once cycle to the next, prior cycles have never had the presence of ETFs and the proven success of corporations putting BTC on their balance sheet. In fact, Microstrategy ($MSTR) is continuing to double down on their Bitcoin standard, issuing another $600M in senior debt with the purpose to buy more BTC. There was so much interest to lend to MSTR, that the issuance was oversubscribed and the company actually raised $700M to buy Bitcoin.
My general expectation is that we’re going to see at least one other major U.S. corporation put BTC on their balance sheet this cycle, and continue to see a wave of legislative progress internationally to recognize BTC as legal tender or be treated better from a tax perspective.
Companies like Tesla ($TSLA) and Block Inc. ($SQ) might even decide to add more BTC to their existing stack, but I’m just speculating.
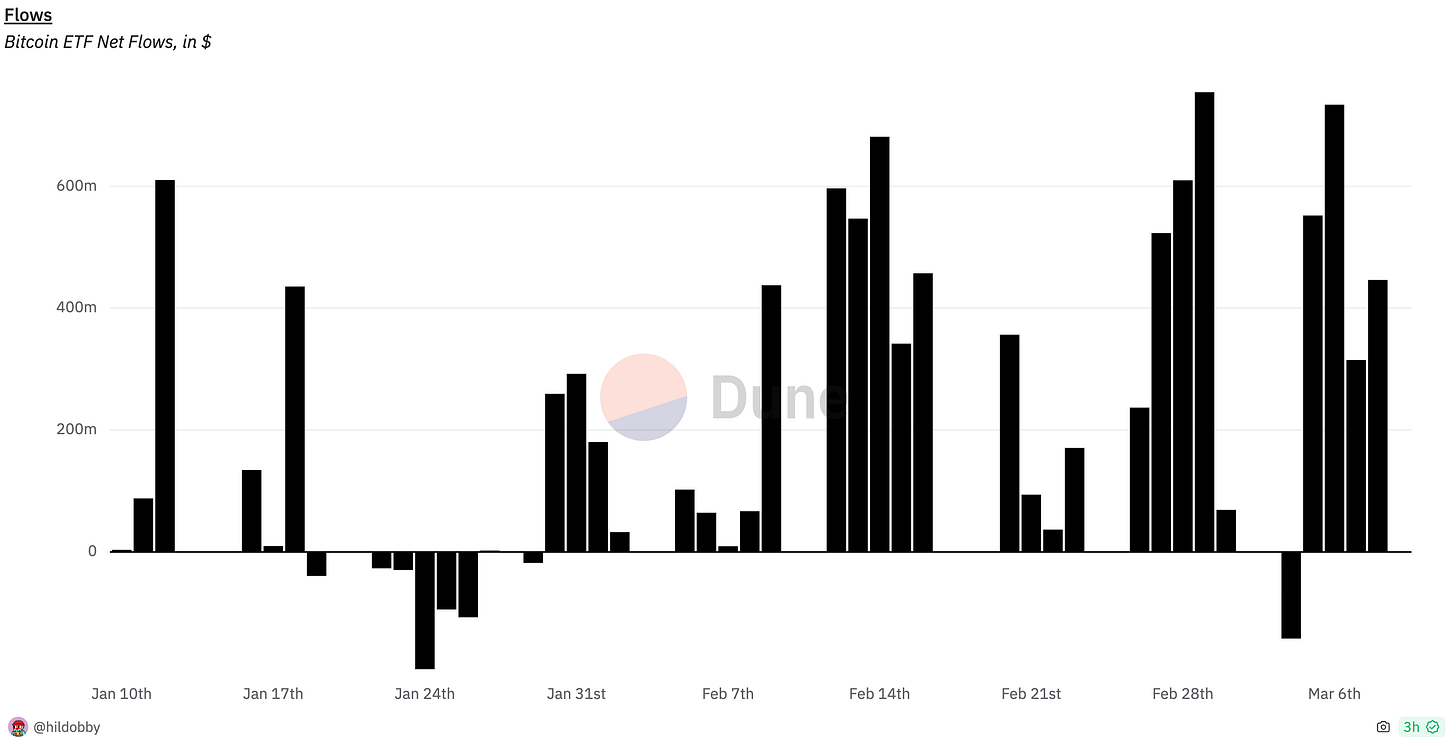
What I do know for a fact is that Bitcoin demand via ETFs continues to be massive.
On the aggregate, spot Bitcoin ETFs in the United States now own 4.06% of all Bitcoin supply and the ETFs had $1.91Bn in flows just this past trading week.
There’s nothing bearish about an overwhelming amount of buying pressure.
Best,
Caleb Franzen
DISCLAIMER:
This report expresses the views of the author as of the date it was published, and are subject to change without notice. The author believes that the information, data, and charts contained within this report are accurate, but cannot guarantee the accuracy of such information.
The investment thesis, security analysis, risk appetite, and time frames expressed above are strictly those of the author and are not intended to be interpreted as financial advice. As such, market views covered in this publication are not to be considered investment advice and should be regarded as information only. The mention, discussion, and/or analysis of individual securities is not a solicitation or recommendation to buy, sell, or hold said security.
Each investor is responsible to conduct their own due diligence and to understand the risks associated with any information that is reviewed. The information contained herein does not constitute and shouldn’t be construed as a solicitation of advisory services. Consult a registered financial advisor and/or certified financial planner before making any investment decisions.
This report may not be copied, reproduced, republished or posted without the consent of Cubic Analytics and/or Caleb Franzen, without proper citation.







Fantastic analysis and so far you have been spot on. What do you see as target for SP 500 / NASDAQ by end of 2024 ? Also do you share the view that small caps might run at higher percentage returns to NASDAQ / sp500 ?
appreciate the detail and supporting charts, well written/prepared/presented