This Doesn't Make Sense
Investors,
The U.S. economy is flexing its muscles.
The stock market is weakening.
Bitcoin hit $30,000 (again).
Fundamentally, it doesn’t make sense for these 3 dynamics to occur at the same time.
But they are!
Retail sales in the month of September grew significantly faster than expectations, even on a real basis after adjusting for inflation.
The Russell 2000, a basket of small cap stocks in the United States, hit new YTD lows.
Bitcoin, less than 190 days away from the halving event, continues to experience upward pressure as investors also price-in the inevitable wave of spot ETF approvals.
Piece by piece, I’m going to address each of these dynamics in this edition of Cubic Analytics. First, as a way to celebrate crossing 7,500+ subscribers to Cubic Analytics, I wanted to offer everyone this 25% discount to upgrade to a premium membership!
In addition to the free weekly reports, premium members receive the following:
Access to weekly premium research, published every Sunday.
Access to weekly premium group calls, with Q&A for 1 hour.
Access to monthly deep-dives on subscriber-voted stocks.
Access to the previously published “Portfolio Strategy” series from 2022, where I shared the top 15 core portfolio holdings in my long-term portfolio.
This week, I announced that I’ll be adding a new benefit: weekly updates on all changes to long-term portfolio allocations, which will provide insights on the individual stocks & ETF’s that I purchase every single week.
These updates will be included in every Sunday edition of the premium reports, helping to create consistent transparency for how I’m navigating the market with respect to my long-term portfolio and the individual stocks/ETF’s that I’m buying.
If you have any questions about upgrading to a premium membership, just reply to this email and I’ll get back to you ASAP.
Without further ado, let’s dive into this week’s edition of Cubic Analytics.
Macroeconomics:
Yields are ripping, for a variety of reasons:
Better-than-expected economic data
Stronger-than-expected bank earnings (so far)
Ongoing bond issuance by the U.S. Treasury
Fears of sticky inflation and/or re-inflation
Investor psychology as Treasury holders rush to the exit door
The entire yield curve is essentially trading at the highest levels since 2007 (or even as far back as 2000), particularly with the long-end making significant strides recently.
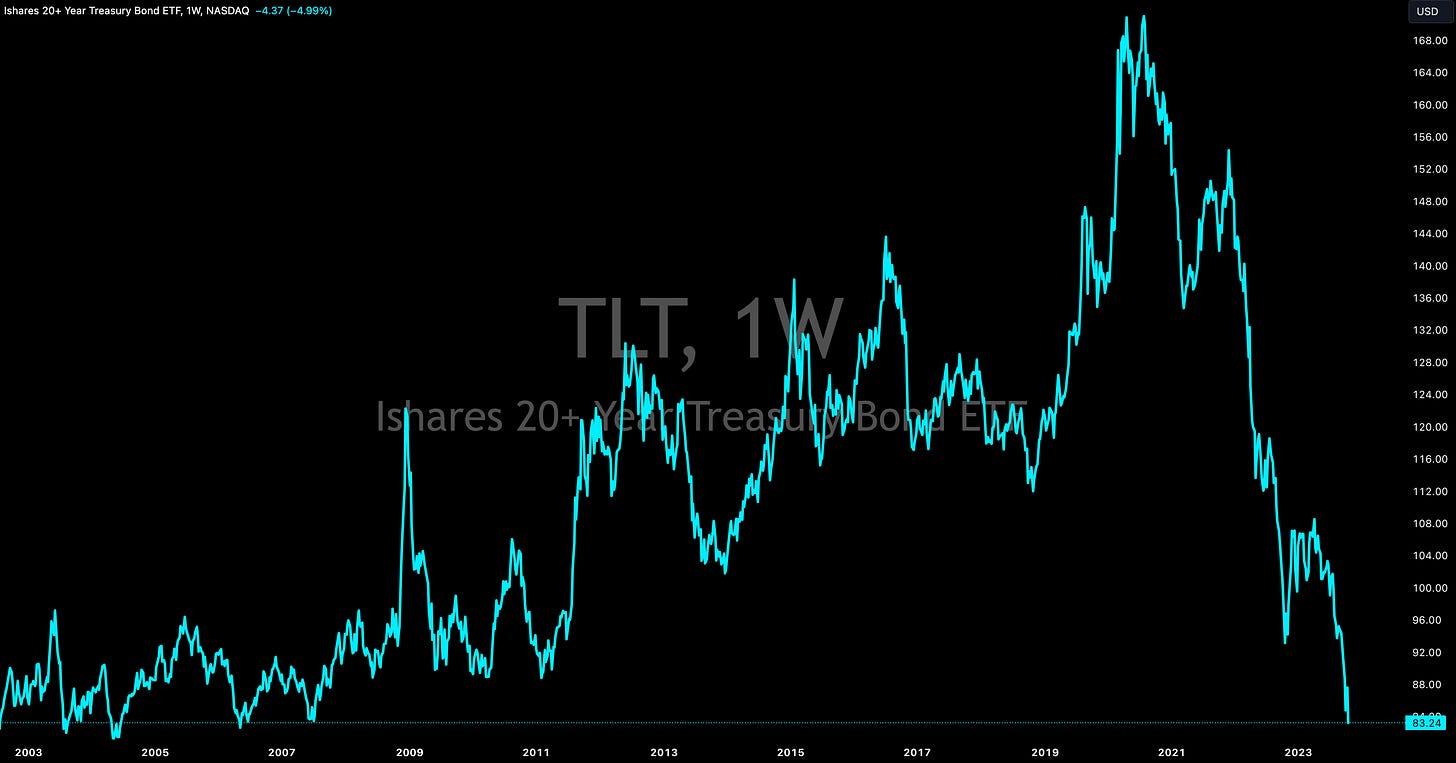
With the massive acceleration in long-term yields, Treasuries are reaching new multi-decade lows in a cascading dynamic of sell pressure. More specifically, the iShares 20+ Year Treasury ETF TLT 0.00%↑ is trading at the lowest level since May 2006.
If we adjust performance to include the returns from the yield (aka the coupon payments from the Treasury), the ETF is trading at the lowest level since January 2014, erasing 9 years of returns.
One of the catalysts that added to the selling pressure this week was the extremely positive report for retail sales in the month of September, which grew at a nominal pace of +0.7% during the month. This was a massive beat vs. estimates which were calling for growth of +0.3% during the month. Even after adjusting for CPI inflation of +0.4% in September, real retail sales grew +0.4%.
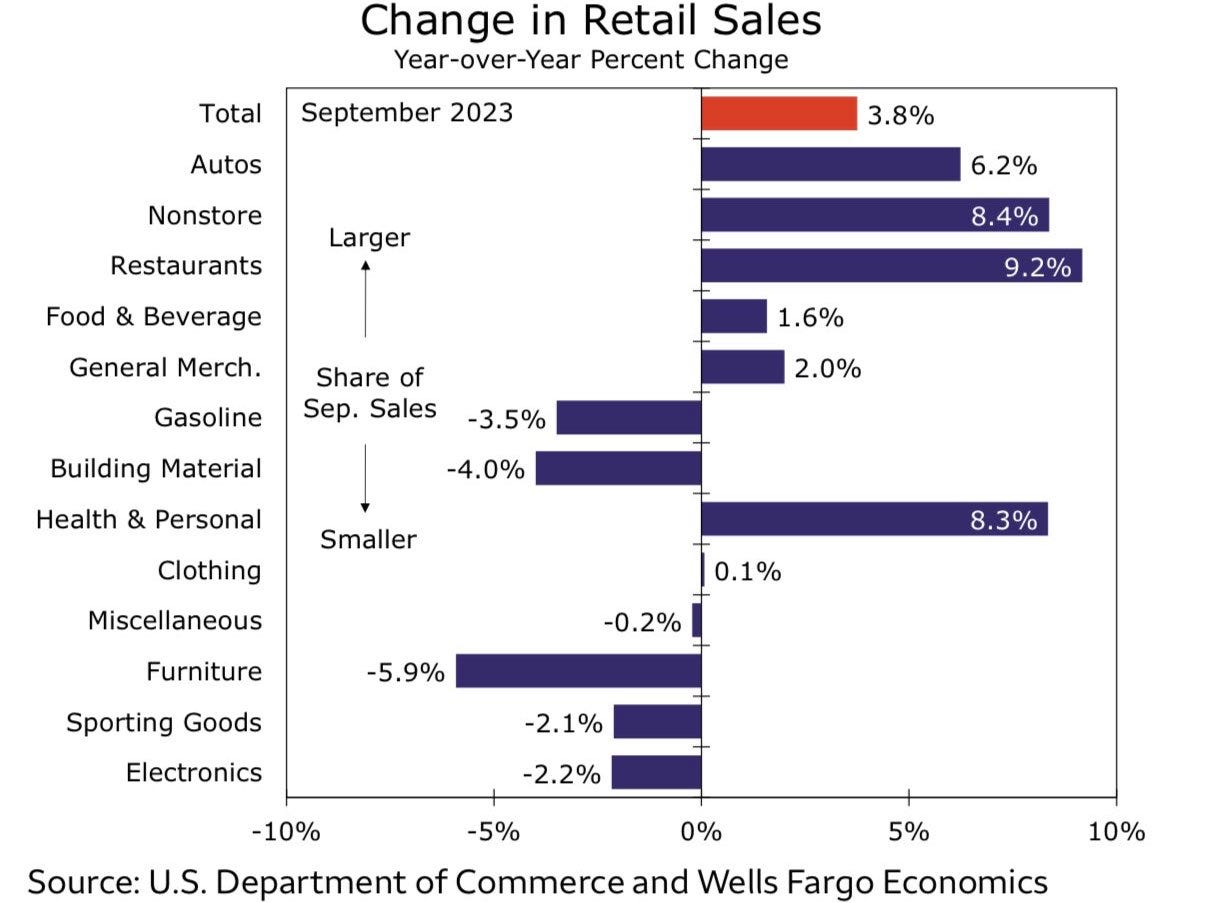
On a YoY basis, growth was +3.8% on a nominal basis, the highest in 7 months! This was a strong acceleration vs. the August result that showed YoY growth of +2.5%.
Many macro doomers have been complaining for the past several months that the resiliency/strength in retail sales is a facade caused by higher spending on fuel prices at the pump. This was a valid critique, but one that doesn’t apply to the latest data.
Additionally, the results from both July and August were actually revised higher!
When looking at the long-term trajectory, retail sales is is unequivocally above-trend.
Analyzing the individual components, from largest to smallest composition, the YoY rates of change appear quite healthy.
In response to this positive data, the Atlanta Fed’s GDPNow model for Q3 2023 was revised higher from +5.1% to +5.4% (annualized).
With respect to the GDPNow forecast, it’s important to note two things:
This is a forecast for real GDP growth, which is adjusted for inflation.
This is a model-based output, providing an objective result based on data.
Either way, it’s hard to justify that we’re in a weak economy (or even a recession, which many are suggesting on Twitter/X), when real GDP growth is expected to be +5.4%, retail sales is growing at +0.7%, and initial unemployment claims are hitting the lowest levels since mid-January 2023!
On the aggregate, economic data continues to look good (not great) and unequivocally resilient. Despite ongoing calls for an imminent recession for the past 18+ months, the U.S. economy keeps flexing its muscles and beating expectations.
Stock Market:
There are three charts that I want to share with respect to the stock market:
1. The S&P 500 falls below the 200-day moving average cloud for the first time since mid-March 2023: After a brief period of acting as support at the start of the month, the S&P 500 has now closed below the 200-day MA cloud for the first time in 6 months. For those looking for an objective & simple way to be bullish or bearish, the 200-day MA cloud is a great indicator. If above, be bullish. If below, be bearish.
2. The Russell 2000 hits fresh YTD lows, now down -4.5% in 2023 and down -16.1% from the July 2023 highs: I’ve been reluctant about small caps all year and even reiterated that investors should avoid them in mid-September when I predicted new YTD lows. Now that the target has been achieved, I’m focused on the Russell 2000 falling below the 2022 lows, which I think is nearly certain. In other words, be prepared for more downside in small caps, classified as stocks with a market cap below $2Bn. The wedge breakdown and flip into resistance is a clear sign of more pain yet to come.
3. Measuring the S&P 500 relative to the Russell 2000 (SPX/RUT): While the S&P 500 is officially looking bearish based purely on the 200-day moving average cloud signal, it’s trading at all-time highs relative to the Russell 2000. In other words, investors who were long the S&P 500 and short the Russell have made strong profits in 2023. In fact, a 50/50 strategy of long SPY 0.00%↑ & short IWM 0.00%↑ is up +7.3% YTD. Given this market neutral approach, that’s a phenomenal return! For what it’s worth, I expect that this strategy will keep working extremely well.
Bitcoin:
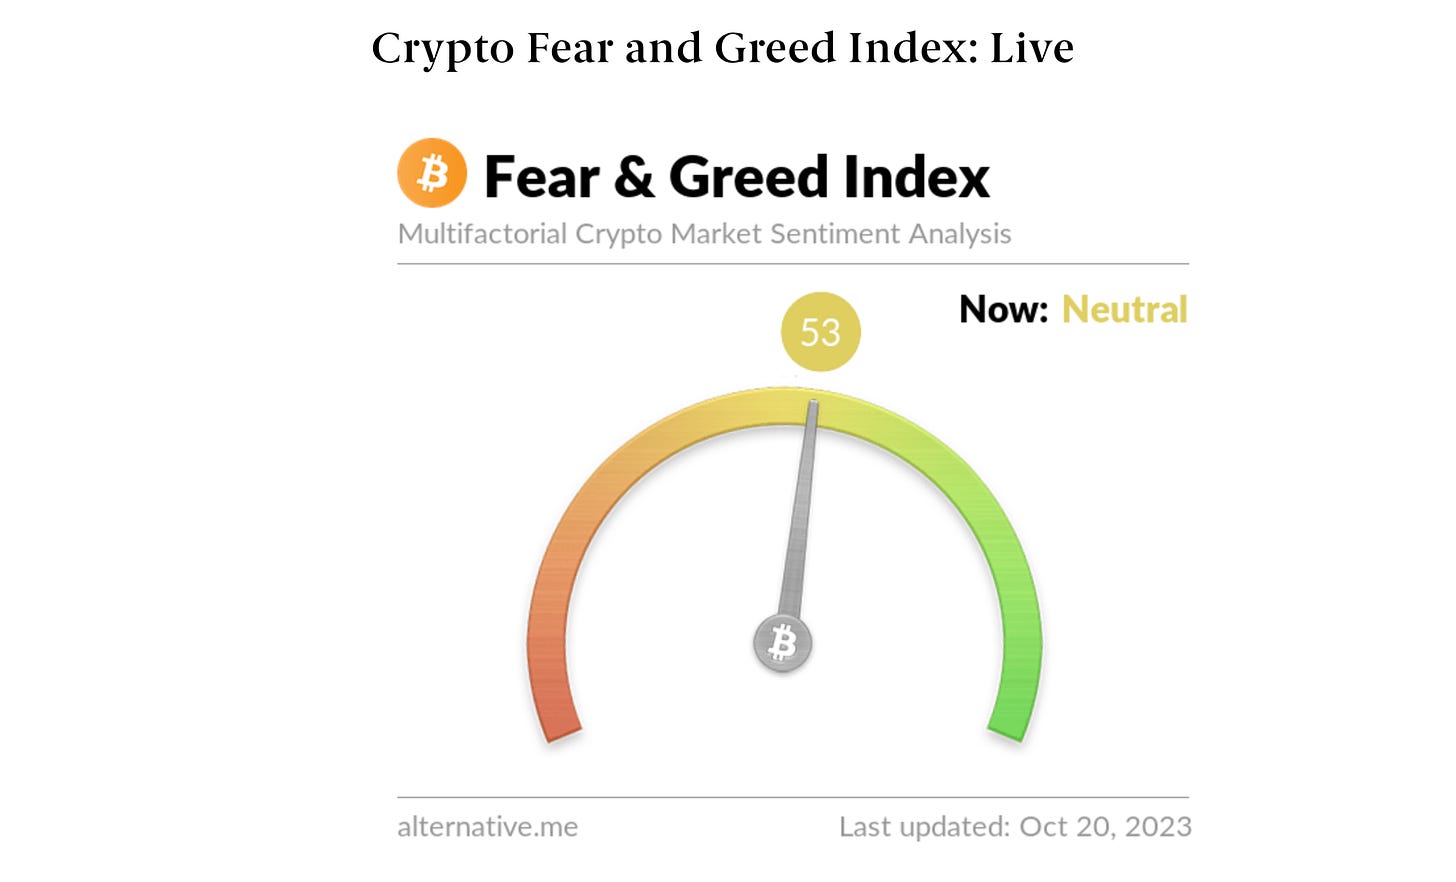
Hitting $30k again never felt so good, especially after an extensive period of time fluctuating between $25k and $27k. Amazingly, this is happened while the Crypto Fear & Greed Index is considered “Neutral”, though it’s now moved to a state of “Greed” this Saturday morning.
Regardless, it’s similarly impressive that BTC is trading at ~$30k while the stock market Fear & Greed Index is on the verge of falling into “Extreme Fear”!
The halving is coming. ETF approval is coming. The market is pricing it in.
I love to see it.
Best,
Caleb Franzen
SPONSOR:
This edition was made possible by the support of MicroSectors, a financial services and investment company that creates an array of unique investment products and ETN’s. Their NYSE FANG+ products are the only one of their kind, allowing investors to gain exposure, leveraged/un-leveraged & direct/inverse, to the NYSE FANG+ Index.
They recently released four new individual stock ETF’s for Tesla and Nvidia, using 2x leverage in each direction:
I started a partnership with MicroSectors in 2023 because I’ve been using their products for over a year and it was an organic and seamless fit.
Please follow their Twitter and check out their website to learn more about their services and the different products that they offer.
DISCLAIMER:
This report expresses the views of the author as of the date it was published, and are subject to change without notice. The author believes that the information, data, and charts contained within this report are accurate, but cannot guarantee the accuracy of such information.
The investment thesis, security analysis, risk appetite, & timeframes expressed above are strictly those of the author and are not intended to be interpreted as financial advice. As such, market views covered in this publication are not to be considered investment advice and should be regarded as information only. The mention, discussion, and/or analysis of individual securities is not a solicitation or recommendation to buy, sell, or hold said security.
Each investor is responsible to conduct their own due diligence and to understand the risks associated with any information that is reviewed. The information contained herein does not constitute and shouldn’t be construed as a solicitation of advisory services. Consult a registered financial advisor and/or certified financial planner before making any investment decisions.
Please be advised that this report contains a third party paid advertisement and links to third party websites. These advertisements do not constitute endorsements. The advertisement contained herein did not influence the market views, analysis, or commentary expressed above and Cubic Analytics maintains its independence and full control over all ideas, thoughts, and expressions above. The mention, discussion, and/or analysis of individual securities is not a solicitation or recommendation to buy, sell, or hold said security. All investments carry risks and past performance is not necessarily indicative of future results/returns.


