The S&P 500 Hits All-Time Highs
Investors,
The S&P 500 is on pace for new all-time highs relative to U.S. Treasuries on a monthly basis, highlighting how the rising interest rate environment has been particularly brutal for fixed income investors.
This ratio of SPX/TLT has roughly doubled since December 2019, prior to the start of the COVID-induced selloff and global recession, and it’s gained even more upward momentum since the Federal Reserve embarked on their monetary tightening regime.
Even since the regional bank failures in mid-March 2023, SPX/TLT has gained +27.6%!
This is an important reminder, particularly given the context that the S&P 500 itself is “only” up +14.7% since the mid-March 2023 lows. This has been a phenomenal return is such a short period of time, but it’s even better when we consider that TLT is down -14% over that same time period.
What’s causing this divergence & how long could it last?
That’s what I’m here to answer.
Before we dive in, I’d like to thank the team at MicroSectors for their continued support of Cubic Analytics, and I’d encourage all of you to research their product list and follow them on Twitter.
Macroeconomics & Stock Market:
Yields are moving higher for a variety of reasons, which means that the present value (aka the price) of Treasuries today is falling. It’s vital to remember a key principle of finance: all else being equal, interest rates & asset prices have an inverse relationship.
On August 6th, I published a premium report and had an entire section devoted to analyzing Treasury yields. Here’s what I shared:
“In the past 2 months, yields have risen for the following reasons, in order of most to least important:
The Treasury is issuing a bunch of new debt, ranging for ultra short-term to long-dated U.S. Treasuries. After the debt ceiling was passed, the Treasury needed to refill their Treasury General Account (TGA), which is essentially the Federal government’s checking account held at the Federal Reserve. The way they do this is by raising capital in the fixed income market, issuing new Treasuries. The flood of new supply has created strong tailwinds for yields to rise. I suspect that this dynamic will remain in effect for the next 4-8 weeks to a significant degree.
There has been a significant re-pricing of rate hikes since mid-March. In the aftermath of bank failures, the market had predicted that the Federal Reserve wouldn’t raise rates any further and that they might, in fact, actually cut interest rates. Bond yields plummeted in that environment, as investors flocked into “risk free” assets that would protect them in the event of a widespread financial crisis. Now that the dust has settled, market participants are no longer concerned about bank failures and believe that the Federal Reserve’s intervention (along with the FDIC and the Treasury department) is sufficient to stop the bleeding. In turn, yields have risen. Because of my outlook for disinflation, I suspect that the Fed MIGHT raise rates one more time this year.
Forward-guidance from the Federal Reserve has convinced the market to expect more rate hikes. Recall, investors were saying that the Fed should pause (or even cut) in March 2023. Yet the Fed raised rates in March, May, and now in July for a total amount of +0.75%. During that time, we’ve seen yields grind higher based on the Fed’s forward-guidance and follow-through in policy rate hikes. While I expect the Fed to do no more than 1 rate hike in the months ahead, I suspect that they will continue to jawbone and “talk tough”. This should keep rates stable/high.
Stronger than expected economic data has caused investors to command a higher return on their capital, therefore forcing the Treasury to issue bonds at a higher interest rate. It’s difficult to say where economic data will go next, but everything has shown us that it’s resilient & dynamic. Until proven otherwise, this is the trend and I am not ready to bet on a significant deterioration until we start to see early signs of deterioration. We’re not there yet.
While we have firm evidence of disinflation, it seems that investors are increasingly concerned about a re-acceleration of inflation dynamics in the months ahead. As you guys might guess, I do not share this fear; however, it’s fairly unequivocal that said fears of re-inflation are causing yields to push higher. I think that the market will get over this fear in the next two CPI prints.
I think it’s important to recognize that there are still tailwinds for Treasury yields to rise in the coming weeks (and potentially even months).”
All of these dynamics are still at play today & my takeaway has been accurate thus far.
The Treasury is issuing more debt, therefore increasing the supply of Treasuries and causing yields to rise. The market continues to absorb rhetoric from various Federal Reserve officials that reiterates that yields will be higher for longer and that more rate hikes are likely necessary. Economic data has been stronger than expected, on the aggregate, which has also been reaffirmed by Q2 2023 earnings season for the S&P 500. Finally, investors are concerned about the trend of disinflation and believe that we will see inflation re-accelerate in the months (and potentially quarters) ahead.
Together, these dynamics have pushed yields higher.
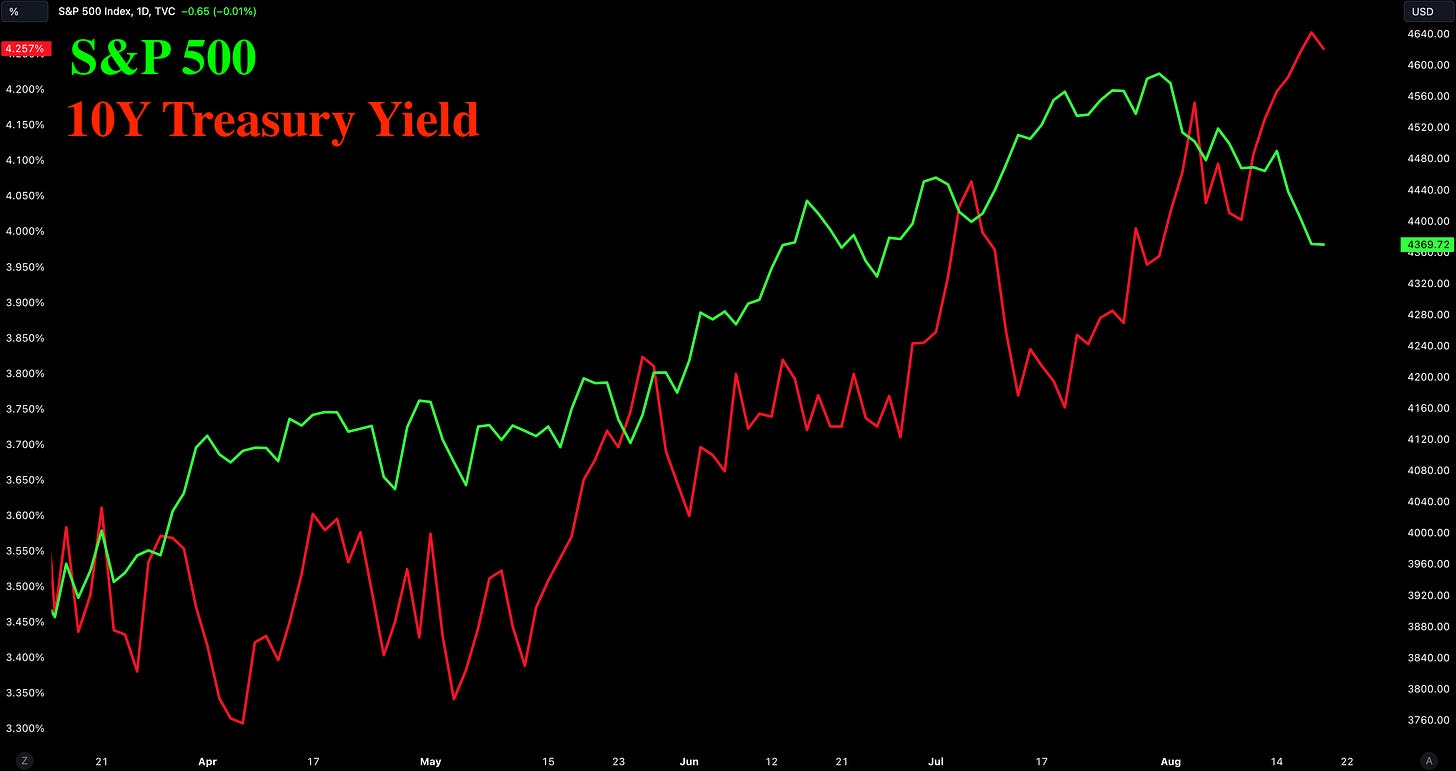
While this higher yield environment has been terrible for fixed income assets, like Treasuries, equities have been surprisingly resilient (and outright strong). Below is the correlation between the S&P 500 and the 10Y Treasury yield:
Equities & yields have been rising in tandem, seemingly betraying the key finance principle that I shared below. The logical explanation for this is that all else is NOT equal and that other factors in the net present value formula are causing investors to price assets at a higher value. Earnings season provides some clarity on this hypothesis, given that 78.4% of S&P 500 companies are beating EPS expectations.
On the aggregate, S&P 500 companies have reported an EPS growth rate of -7.6% YoY relative to expectations of -14.2%. While a decline of -7.6% is bad in a vacuum, it’s much better than what investors were expecting! However, it’s important to add even more context on this matter…
Given the fact that crude oil & energy prices were significantly lower in Q2 2023 than they were in Q2 2022, energy stocks in the S&P 500 have struggled to maintain both revenue and EPS. So how has the S&P 500 ex-Energy performed in Q2 2023 earnings?
Quite well, in fact!
Earnings per share for S&P 500 ex-Energy companies are down -1.3% YoY vs. estimates of -8.7%. Revenue for this cohort is actually up +4.4% vs. estimates of +2.5%, further proving that corporations are navigating the economy extremely well.
Additionally S&P 500 ex-Energy margins are improving relative to the prior quarter!

Investors have been reinvigorated, ignited by a disinflationary environment, a dynamic labor market, resilient economic data, and better-than-expected earnings.
Clearly, all else is not equal.
These factors have allowed equities to rise amidst a rising-interest rate environment for the past 5 months; however, equities are now slipping while yields keep rising.
Has the market reached a breaking point? Is this the straw that broke the camel’s back? It’s too early to tell in my opinion, but I’ll be sharing a chart later in this report that could provide some clarity on these questions.
In a way, equities have become their own worst enemy — stronger than expected corporate earnings have only pushed yields higher, and we may have reached a breaking point. Equities aren’t falling because news and economic data is deteriorating… equities are falling because the news is getting too good, which therefore exacerbates the “higher for longer” narrative. Given that the market is a forward-looking pricing mechanism, discounting all known and unknown events with varying degrees of likelihood, investors are able to adjust to economic data and therefore price in higher interest rates.
Here are the key highlights of macro data released this week:
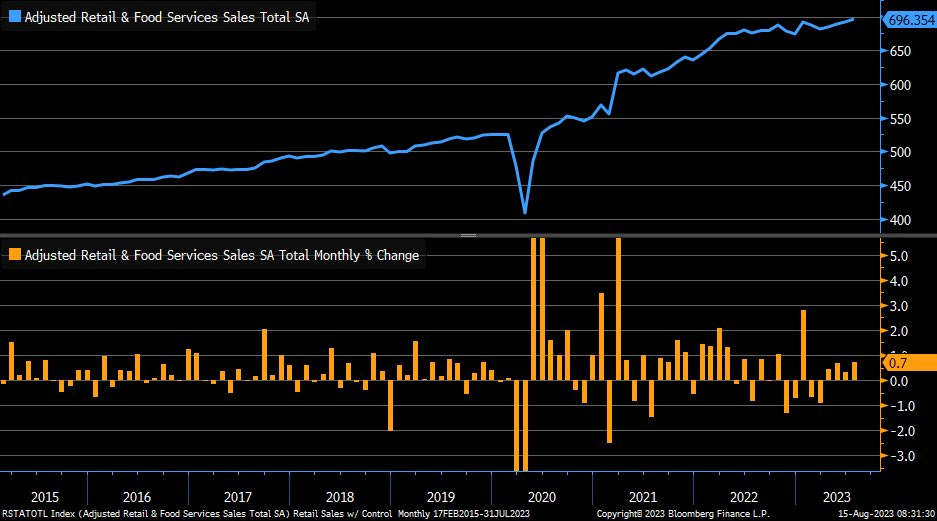
1. July Retail Sales data was much stronger than expected, coming in at +0.7% m/m vs. estimates calling for an increase of +0.4% and prior month results of +0.3% (which were revised up from +0.2%). On a YoY basis, retail sales increased +3.2% in July 2023, which was quite a bit stronger than the June 2023 result of +1.6%. The control group data, which is actually used as an input in GDP calculations, increased by +1.0% in July for a YoY growth rate of +5.0%. The data was strong… quite strong.

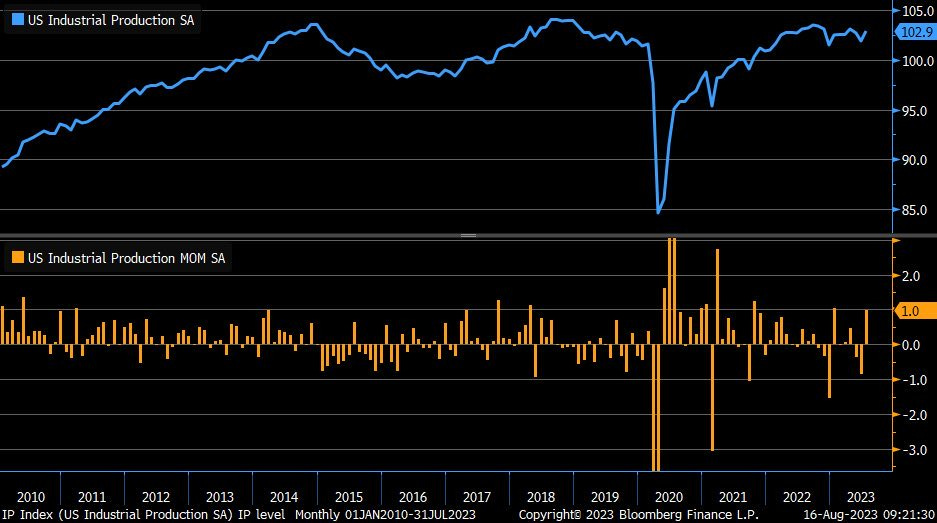
2. July industrial production grew at a pace of +1% month-over-month vs. estimates of +0.3% and prior results of +0.8%, highlighting some renewed optimism in the manufacturing sector.

3. The Philadelphia Federal Reserve’s Manufacturing Business Outlook Survey improved considerably, jumping to a level of 12 vs. expectations of -10.2 and prior results of -13.5. Given that we aren’t in a recession and didn’t have one in 2022, the ongoing recovery in Philadelphia’s manufacturing activity is reminiscent to the dynamics that took place in the mid-1990’s.
4. Initial unemployment claims for the latest week came in at 239k vs. estimates of 240k and prior results of 250k. While the result was only marginally better than expectations, I think it’s important to highlight that initial unemployment claims have fluctuated around 240k for the past 20 months. In January 2022, initial claims bounced between 228k and 251k. Since March 2023, we’ve been fluctuating around this same range. This is quite an amazing feat of strength given that the effective federal funds rate was 0.08% in January 2022 vs. 5.33% today.
5. In response to all of the data above (and more), the Atlanta Federal Reserve updated their forecast for real GDP growth in Q3 2023 to +5.8%. They initially raised their target from 4.1% to 5.0%, then immediately raised again to +5.8% the next day. The GDPNow forecast tool is strictly a model-based output, based purely on new and incoming data, so it’s worth noting that economists at the Fed aren’t making their own predictions, but rather their model is adjusting to new inputs.
So let’s tie this all back to yields and the stock market.
Yields, which have a positive correlation to strong economic data, jolted higher throughout the week. However, not all yields moved higher! Short-duration Treasury yields, like the 1M, 3M, 6M, and 1Y Treasury yields, moved sideways or even fell throughout the week. Conversely, long-duration Treasury yields, focusing specifically on the 5Y, 10Y, 20Y, and 30Y, increased substantially.
This dynamic of short-duration yields trending sideways vs. long-duration yields rising rapidly has caused the overall Treasury yield curve to re-steepen after inverting last year:
This exact dynamic is something I’ve warned about several times, both on Twitter and Substack, in which investors should be cautious once this inversion starts to “uninvert”. In November 2022, I shared that the relationship between the 10Y and 3M Treasury yield will provide an “important signal when it starts steepening.” I also shared a more direct warning in May 2023, in the post below:
With this information in mind, let’s look at how the S&P 500 has performed during periods where an inverted yield curve starts to re-steepen:
Therefore, given the consistency of the post-inversion steepening since May 2023, I think that bears have their strongest argument yet for the following opinions:
Being under-allocated and cautious/defensive
Having a significant cash position
Being outright short equities
Attentive investors will recognize that the peak of the inversion & subsequent steepening occurred 6+ months before the market peaked in 2007 and 2020, so it’s important to remember that this isn’t a short-term market timing signal. In other words, the market can still grind higher during this steepening process; but history shows us that patient investors have been rewarded for sitting on the sidelines to wait for a more opportune moment to allocate capital. As I alluded to earlier, perhaps the steepening process is indeed highlighting that yields are breaking the market’s back.
With the Treasury continuing to issue new supply of government debt and my general view that resilient & “better-than-expected” economic data will persist for the remainder of 2023 (most likely), I think there is substantive reason to believe that the ongoing steepening of the yield curve will continue. In turn, this means that long-duration Treasuries, notably on the 10Y and 30Y maturities, are likely to increase further and put downward pressure on Treasury prices.
Given the strong performance in equities this year, the outperformance of the S&P 500 relative to TLT is likely to persist, unless the economy quickly falls into a recession or some sort of financial crisis unfolds. With selling pressure in stocks seemingly coming from economic data that is too strong, I think it’s also vital to put this recent decline into context:
The S&P 500 has fallen -5.1% from the YTD highs.
The S&P 500 is still up +13.8% YTD.
The S&P 500 is still above the August 2022 highs.
The S&P 500 is still above the 200-day moving average.
The largest daily decline in the index during this consolidation is -1.38% on 8/2/23.
It’s also vital to remember that the market needs to take time to digest its gains. The S&P 500 gained +20.9% from mid-March through the end of July of this year. As far as I’m concerned, this 3-week consolidation has been a normal, healthy, and orderly decline as the market resets and cools off. I repeat: this is healthy.
The strongest uptrends are always (yes, always) accompanied by pullbacks that feel terrible in the short-term but are necessary for the persistence of the uptrend.
Data from Ben Carlson shows that years where the S&P 500 generated an annual return of at least +20% were accompanied by fairly significant drawdowns within that same year. In fact, the average maximum drawdown in these calendar years is -11%!
Considering that the current maximum drawdown of 2023 is -9.1%, the S&P 500 has already produced a drawdown that is close to the average. Investors had to sit through that drawdown if they wanted to capitalize on the +20.9% upside that followed over the subsequent four months. The purpose of this data above is to merely highlight that things can get worse before they get better, and that’s ironically what prudent investors want to see — more pain and less enthusiasm before another leg higher.
While I recognize that short-term headwinds are pushing equities lower over the past three weeks, meaning that downside momentum could persist for a bit longer, I am optimistic that this will provide long-term investors with more realistic levels to add or initiate new positions in companies that they were priced out of over the past several months.
Lacking a fundamental negative catalyst, this selloff in equities feels more psychological than anything else, which likely means that the underlying trend for the past 10 months is intact. I fully expect to see the S&P 500 make higher YTD lows in the coming weeks, which means that more market pressure could persist, but I heavily doubt that we fall below the March 2023 lows. More specifically, I’d be surprised if the index fell below the August 2022 highs, which would require a decline of -4.1% as of Friday’s close. It’s possible, but I’d be surprised.
Best,
Caleb Franzen
SPONSOR:
This edition was made possible by the support of MicroSectors, a financial services and investment company that creates an array of unique investment products and ETN’s. Their NYSE FANG+ products are the only one of their kind, allowing investors to gain exposure, leveraged/un-leveraged and direct/inverse, to the NYSE FANG+ Index. They have a suite of products ranging from big banks, to oil and gas, and even gold/gold miners.
I started a partnership with MicroSectors in 2023 because I’ve been using their products for over a year and it was an organic and seamless fit.
Please follow their Twitter and check out their website to learn more about their services and the different products that they offer.
DISCLAIMER:
This report expresses the views of the author as of the date it was published, and are subject to change without notice. The author believes that the information, data, and charts contained within this report are accurate, but cannot guarantee the accuracy of such information.
The investment thesis, security analysis, risk appetite, and time frames expressed above are strictly those of the author and are not intended to be interpreted as financial advice. As such, market views covered in this publication are not to be considered investment advice and should be regarded as information only. The mention, discussion, and/or analysis of individual securities is not a solicitation or recommendation to buy, sell, or hold said security.
Each investor is responsible to conduct their own due diligence and to understand the risks associated with any information that is reviewed. The information contained herein does not constitute and shouldn’t be construed as a solicitation of advisory services. Consult a registered financial advisor and/or certified financial planner before making any investment decisions.
This report may not be copied, reproduced, republished or posted without the consent of Cubic Analytics and/or Caleb Franzen, without proper citation.
Please be advised that this report contains a third party paid advertisement and links to third party websites. These advertisements do not constitute endorsements and are not necessarily representative of the views or opinions of the newsletter author. The advertisement contained herein did not influence the market views, analysis, or commentary expressed above and Cubic Analytics maintains its independence and full control over all ideas, thoughts, and expressions above. The mention, discussion, and/or analysis of individual securities is not a solicitation or recommendation to buy, sell, or hold said security. All investments carry risks and past performance is not necessarily indicative of future results/returns.


