The Resilient Fighter
Investors,
Stocks are up. Inflation is coming down. The economy remains resilient.
If you’ve been an avid reader of Cubic Analytics over the past nine months, these three points have been the key theme of my research. While I’ve acknowledged these positive developments, I’ve also conceded that things aren’t perfect and that there are weak aspects of the economy. My point has been (and continues to be) that we shouldn’t let “perfect” be the enemy of “good” and that, given the context of the rate hike shocks, everything is holding up extremely well.
Think of a boxing match where one fighter is outclassing their opponent, landing hard punches, accurate jabs, and putting on a clinic. The opponent is swollen & bloody from taking punch after punch… but they continue to march forward. They continue to get up quickly after knockdowns. They continue to stay in the fight to give themselves an opportunity to win — to score a knockout blow against their high-level opponent.
I just described the fight between the Federal Reserve vs. the economy, the labor market, the consumer, and the stock market in 2022 and 2023.
When we look at the judges scorecards, we see that the economy has produced strong levels of real GDP growth in 2023. The U.S. consumer has been solid, spending at record levels in some areas. The labor market is historically dynamic, recently showcasing record lows in the unemployment rate and above-average wage growth while labor force participation increases. The stock market, as I highlighted last week, is hitting new all-time highs in various indexes, sector ETF’s, and industry ETF’s.
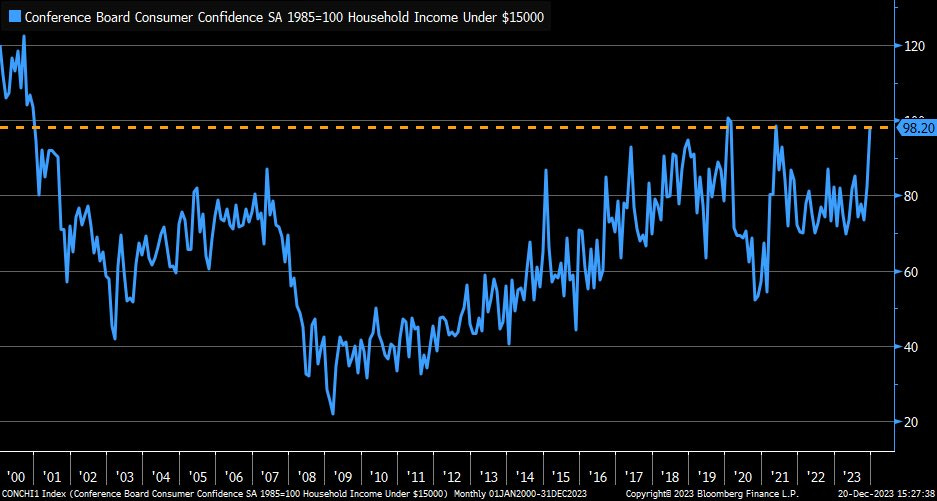
Even the lowest income-earners in the U.S. are expressing their highest levels of confidence in the U.S. economy since May 2021!

The resilient fighter who did everything they could to stay in the fight is winning.
Plain & simple.
Before diving into the remainder of this report, I want to wish everyone a Merry Christmas and a happy holiday season! It’s been a spectacular year and I applaud everyone who’s shown humility to change their minds throughout the year and acknowledge the objectively positive data & developments that have been unfolding.
If you’re not already subscribed to the premium version of Cubic Analytics, where I conduct a thorough review of stock market conditions, signals, internals, & data, while also covering the crypto market and individual stocks, consider signing up below!
I’m really excited to share this research with you, so feel free to skip to whichever section you’re most interested in if you only have a limited amount of time. As always, I discuss macro, the stock market, and Bitcoin individually in order to provide alpha in these three core disciplines. If you value technical analysis for Bitcoin, don’t miss that section in this report!
Macroeconomics:
This week was full of macro data, but the most important was the release of the November Personal Consumption Expenditures (PCE) data on Friday.
Personal income increased by +$86Bn in November, up +0.4% vs. the prior month.
The PCE Price Index, the Federal Reserve’s preferred method of measuring inflation dynamics, continued to prove that the U.S. economy is firmly within a disinflationary trend. Specifically, we saw the following:
Headline PCE was +2.6% YoY vs. prior +3.0% and estimates of +2.8%
Core PCE was +3.2% YoY vs. prior +3.5% and estimates of +3.3%
Headline PCE was -0.1% MoM vs. prior ±0.0%
This was the first time we’ve seen outright deflation on a MoM basis since April 2020!
There are two charts specifically that I want to focus on:
1. PCE Services YoY fell from +4.34% in October to +4.1% in November:
Given that the service sector is the driving force of the U.S. economy, this is an important variable to assess how price dynamics are evolving in the most important sector. It’s still above the 30-year range; however, we are on the verge of re-entering the normal range.
2a. PCE Nondurable Goods YoY fell from +1.6% in October to +0.7% in November:
“Nondurable” is economics jargon for goods that are only consumed once or within a short period of time (within 3 years, specifically). Examples include clothing, trash bags, cleaning products, bedding, etc.
In any event, we’re seeing rapid disinflation in this metric, on the verge of re-entering outright deflation on a YoY basis as it did briefly in June 2023.
But this is only half of the picture, so what happens when we look at the whole thing?
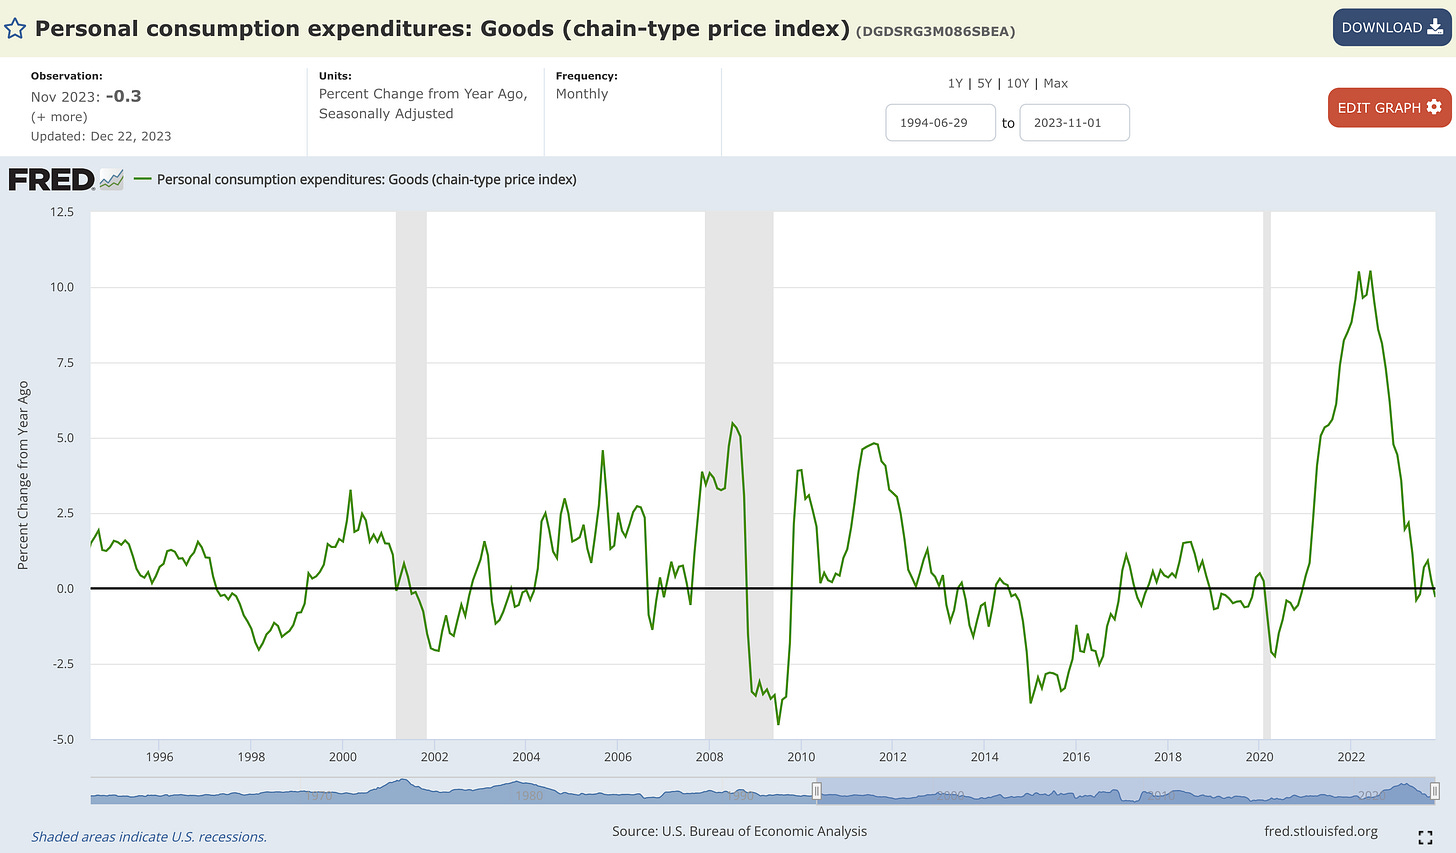
2b. PCE Goods YoY fell from +0.2% in October to -0.3% in November:
Encompassing both durable and nondurable goods, it’s evident that consumer goods are experiencing outright deflation on a YoY basis. This is a volatile datapoint, but we’re firmly within the historic range after reaching extremely elevated levels in 2022.
Given that nondurable goods are experiencing a positive rate of inflation while all goods are experiencing a negative rate of inflation, we can make the assumption that durable goods (refrigerator, cars, washing machines, etc.) are experiencing deflation.
All in all, PCE data confirms what we saw for CPI and PPI. Given the importance of PCE in the eyes of the Federal Reserve, the data showed a decisive step in the right direction, confirming the trend that I’ve been highlighting all year. As I look at the broader drivers of inflation today, including the leading indicators, I remain firmly in the camp that the U.S. economy will continue to experience disinflation in the months/quarters ahead and that the risk of deflation in 2024 will become an important topic of discussion in economic circles. Then we have the simple math of Shelter & housing being the largest (and laggiest) component of inflation. Per the latest update from CoreLogic, single-family rent growth continues to soften and reached its lowest reading of +2.3% YoY.
This descending trajectory & deceleration is what will occur in the Shelter component of CPI and PCE in the coming 12 months, due to the lag effects of owner’s equivalent rent (OER). For context, here’s the Shelter component of CPI, which has a weighting of 33% in headline and 41% in core measures.
With student loans now in repayment, wage growth decelerating with some minor labor market softness, China experiencing outright deflation in CPI & PPI, Germany experiencing outright deflation in PPI, producer prices in the U.S. softening, plus a contraction in M2 money supply & deposits, and an ongoing deceleration in loans & leases, the forward-looking indicators tell me that more disinflation is coming.
These are the same variables and metrics that I’ve been citing all year, some more recently than others as they have become appropriate, yet many have failed to listen.
For those who have listened to the disinflationary thesis that I’ve expressed since December 2022, congratulations are in order because you’ve almost certainly been on the right side of the market trend in 2023.
Stock Market:
The S&P 500 gained another +0.75% this week, generating 8 consecutive weeks of positive returns. This is quite a milestone, which doesn’t happen very often.
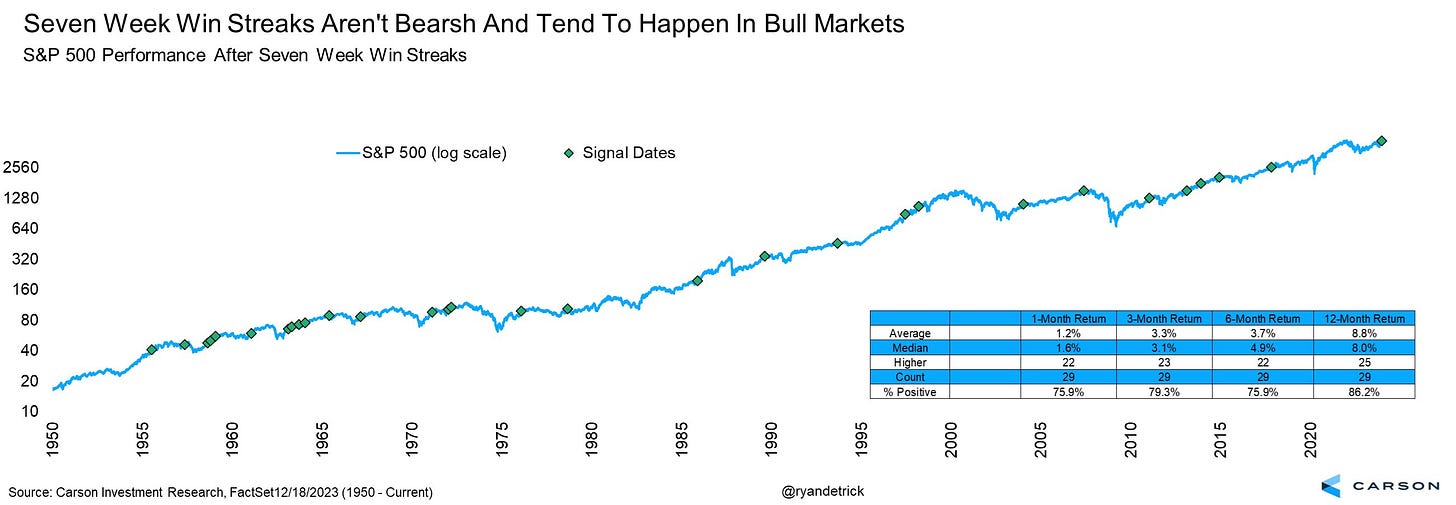
Unfortunately, I didn’t see it until this week, but Ryan Detrick from the Carson Group posted this analysis for the S&P 500 after it achieves 7 consecutive weekly gains:
The takeaway: strong bullish momentum can create a ripple effect of bullish behavior over the coming 12 months and these signals typically occur during broader uptrends.
But hey, maybe you dismiss the fact that markets trend and momentum is a valid factor. Think about it like this then… for some reason, whatever it might be, investors have been catalyzed to buy equities and/or not sell them. This catalyst has been so strong that investors are allocating based on their conviction that the catalyst is valid.
So again, regardless of what that catalyst is, buyers have stepped in with force.
Historical return data shows that the stock market is higher 86% of the time one year later after achieving this momentum signal, whereas the stock market is typically higher 70% of the time one year later on any given date. This spread between the study results and the typical result tells me that it’s a valid & significant signal.
Bitcoin:
These are three super important charts for Bitcoin from a TA perspective:
1. Long-term weekly Heikin Ashi: Bitcoin is on track for the 14th consecutive green weekly Heikin Ashi candle, the longest streak since October 2020 - January 2021 of 16.
I’ve been highlighting this streak very often lately because it’s a beautiful way to represent bullish momentum and could provide an important signal if/when a red weekly Heikin Ashi candle is formed.
2. Short-term daily candles with the supertrend indicator: I started using the supertrend indicator across various timeframes about a year ago, and I’ve been impressed with the effectiveness of the indicator.
Currently, the indicator is providing a bullish signal with a price floor of $39,965. In other words, if the price if Bitcoin falls below this dynamic floor, a decline of -9% from current price, that would be bearish.
So long as it stays above this level, the supertrend indicator is bullish. Keep in mind that the indicator flashed the bullish signal on October 1, 2023, when the price pierced above $27,500 and it has since gained +60%.
3. Short-term daily candles with the parabolic SAR indicator: The parabolic SAR is another excellent signal for determining whether or not we are in a bullish or bearish regime. It’s a bit more sensitive than the supertrend indicator above, so it’s great at providing a more dynamic gauge of market dynamics, especially in conjunction with the supertrend.
After a 9-day streak of showing a bearish signal, the parabolic SAR flipped bullish again on December 20th. The SAR is currently measured at $40,480, so a decline below that level would put us back in a bearish regime, according to the indicator.
We now have some solid confluence right around the $40k range with both the supertrend and the parabolic SAR indicators, so I think all traders should have these levels outlined on their charts and be checking on them daily to ensure that we are still in a bullish regime.
Best,
Caleb Franzen
DISCLAIMER:
This report expresses the views of the author as of the date it was published, and are subject to change without notice. The author believes that the information, data, and charts contained within this report are accurate, but cannot guarantee the accuracy of such information.
The investment thesis, security analysis, risk appetite, & timeframes expressed above are strictly those of the author and are not intended to be interpreted as financial advice. As such, market views covered in this publication are not to be considered investment advice and should be regarded as information only. The mention, discussion, and/or analysis of individual securities is not a solicitation or recommendation to buy, sell, or hold said security.
Each investor is responsible to conduct their own due diligence and to understand the risks associated with any information that is reviewed. The information contained herein does not constitute and shouldn’t be construed as a solicitation of advisory services. Consult a registered financial advisor and/or certified financial planner before making any investment decisions.


