Investors,
I’ve done my best to highlight the resilient nature of the U.S. economy.
I went from being one of the most outspoken bears in 2022 to becoming one of the most outspoken bulls in April 2023, when the aftermath of the banking “crisis” failed to produce additional calamities.
I pounded the table on disinflation.
I pounded the table on encouraging consumer data.
I pounded the table on the dynamic nature of the labor market.
I pounded the table on rate cuts coming in the second half of 2024.
I pounded the table on the significance of the ongoing bull market in stocks.
In December 2023, I said the following:
And what is this premier leading indicator telling us right now?
I spent 15 minutes after Friday’s close and published this chartbook, where I shared several indices, sectors, industries and investment themes that are doing the most bullish thing that any stock can do — go up.
In fact, they’re not just going up… they’re continuing to make new all-time highs.
Let’s talk about what else is important…
Executive Summary:
Macroeconomics:
Disinflation continues with PCE inflation down to +2.23% YoY, the labor market remains resilient with initial jobless claims at a 4-month low, and GDPNow forecasts +3.1% growth for Q3’24, reflecting a re-accelerating economy. Also, Q2’22 data was revised, putting an end to the 2022 recession conspiracy.
Stock Market:
The Nasdaq-100 triggered a bullish signal from the 60-day Williams%R Oscillator on September 26th. This signal, which tracks 3-month momentum, has occurred only three other times since 2023 and typically points to further strength in the weeks and months ahead.
Bitcoin:
Bitcoin is flashing a similar momentum signal, although it’s been less reliable than for the Nasdaq. Previous signals marked major rallies in January 2023 and October 2024. Adjusting the signal to a 90-day window improves its accuracy, suggesting BTC may be poised for another move in the coming days or weeks.
Macroeconomics:
This week, we continued to stack evidence that:
Disinflation is intact
The labor market is resilient
The economy is re-accelerating
Here’s the proof…
Regarding disinflation, the Personal Consumption Expenditures inflation data was released on Friday, coming in at +2.23% YoY. This was a modest deceleration vs. the prior result of +2.45% YoY, but a deceleration nonetheless.
This was the lowest YoY PCE inflation print since February 2021. In fact, headline PCE inflation on a YoY basis is now trading below the high range from 2000-2012, which I’ve highlighted in green above!
Other broad-based inflation data paints a similar picture, notably:
🔵 Core PCE inflation YoY increased to +2.67% from +2.65%
🟠 Median PCE inflation YoY decreased to +3.16% from +3.24%
While core PCE inflation did accelerate vs. the prior month, the acceleration was minimal and predominantly caused by a surprising acceleration in the PCE’s Shelter component, coming in at +5.3% YoY. Given that the core PCE datapoint strips out food & energy prices, it will be more heavily influenced (directionally) by Shelter than the headline datapoint, which explains why core accelerated while median & headline both decelerated.
Personally, I think this nuance is vital to properly grasp the dynamics of this data.
Moving to the labor market, the weekly initial unemployment claims data remains critically important.
Looking at the data going back to September 2021, we can see one clear dynamic: a rapid decline in Q4’21, followed by nearly 3 years of sideways choppiness.
The whole time, bearish analysts have cited this datapoint to justify “cracks in the labor market”, which haven’t materialized into any fissures or useful investment strategies.
The latest weekly report came in at new 4-month lows, with “only” 218,000 initial jobless claims, vs. estimates of 223k and prior results of 222k. I’m not trying to minimize the fact that 218,000 people applied for initial unemployment, but I am trying to contextualize this data properly…
With a total civilian labor force of 168.55M, 0.129% filed for weekly initial claims.
With total nonfarm employees of 158.78M, 0.137% filed for weekly initial claims.
With total private employees of 135.4M, 0.161% filed for weekly initial claims.
Respectfully, when thinking about broader macroeconomic trends, I’m not going to fret about percentages this small, especially when this data is consistent with (or better than) prior periods of economic growth.
Tying this all together, the latest GDPNow estimate from the Atlanta Fed was published on Friday, now forecasting real GDP growth of +3.1% (annualized) in Q3’24.
This is the highest projection so far regarding the current quarter, which ends in just a few days, coming on the back of the 2nd revision for the Q2’24 real GDP data, which stayed consistent at +3.0% (annualized).
Q1’24 real GDP growth was +1.6%.
Q2’24 real GDP growth was +3.0%.
Q3’24 real GDP growth estimates are right around +3.0%.
Objectively, this reflects dynamic growth and even an acceleration in terms of trend.
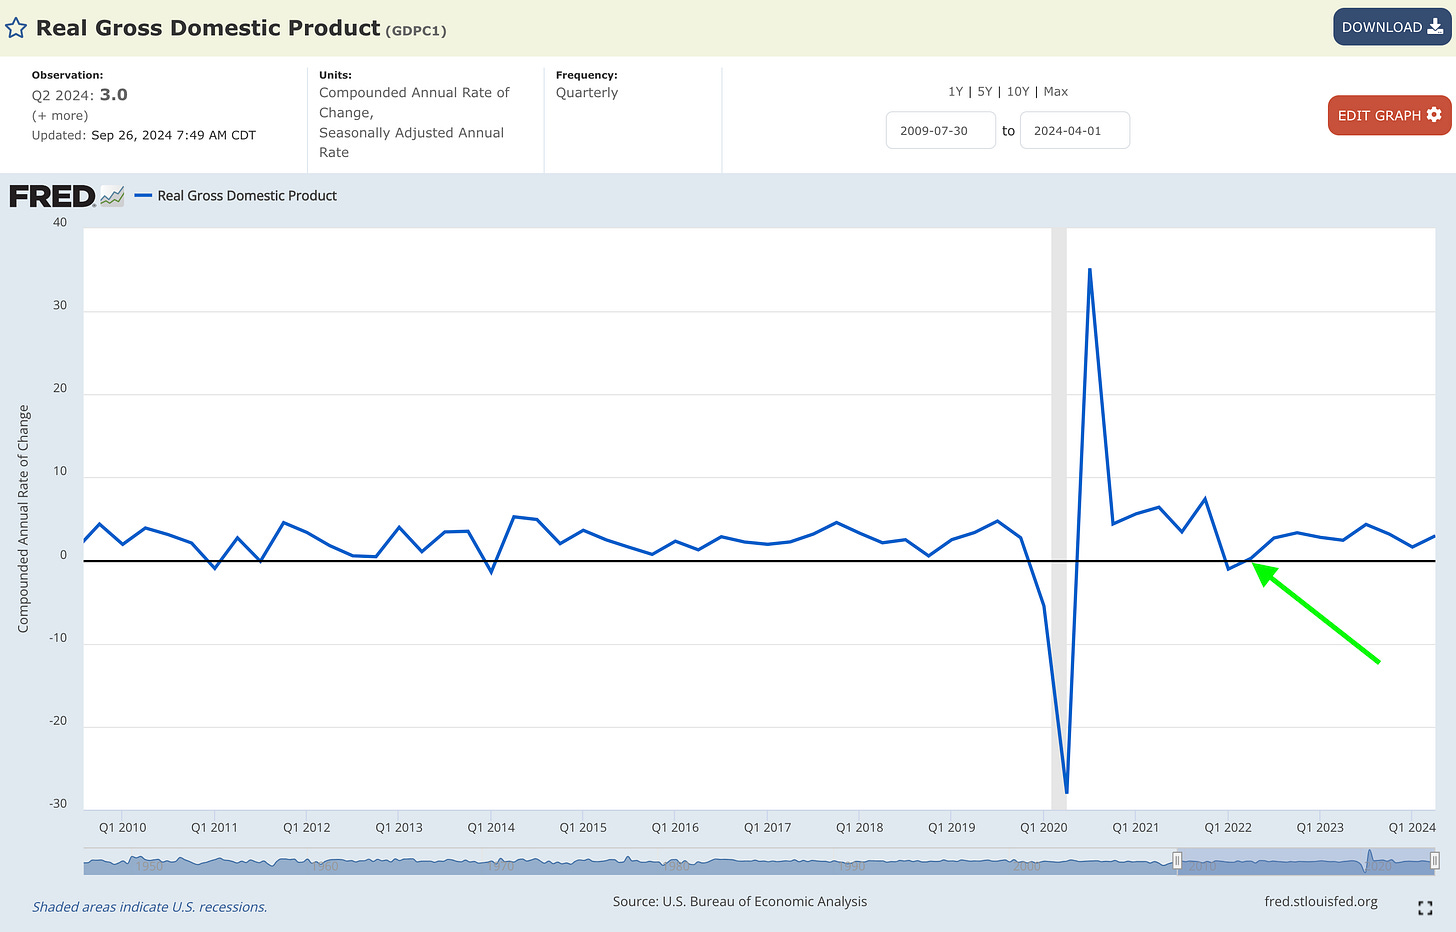
Also, do you remember how people claimed that we had a recession in 2022 because there were two consecutive quarters of negative real GDP growth in Q1 & Q2’22?
Well, not only was that a factually incorrect theory (that’s not the definition of a recession, per the NBER, which is the entity that actually determines recessions), but new revised data now claims that real growth in Q2’22 wasn’t actually negative!
The new Q2’22 data was just updated to +0.29% real growth, which finally puts to rest the superstition that the economy experienced a recession in 2022. Even if a recession was formally defined as two consecutive quarters of negative real GDP growth, we now know that the U.S. economy didn’t even trigger that signal.
Another Doomer narrative slayed.
Stock Market:
Regarding stocks, I only have two things to highlight:
1. Read the chartbook that I referenced in the intro. It will only take you 1 minute.
2. On the morning of September 26th, I posted that the Nasdaq-100 was about to flash a bullish signal for only the 4th time since the start of 2023. You can read that initial post here, but I wanted to update the analysis by sharing that the signal actually flashed later that day.
Specifically, the Nasdaq-100’s 60-day Williams%R Oscillator completed a full oscillation from the lower-bound to the upper-bound, something that I refer to as a momentum thrust:
Given that there are 20 trading days in a month, this signal measures a 3-month momentum thrust for the Nasdaq-100, providing a solid medium-term signal.
I’ve highlighted each of the signals since the beginning of 2023, showcasing how bullish dynamics tend to persist in the weeks, months, and quarters ahead. Statistics, as always, don’t guarantee anything… so for all we know, this signal could fail.
However, until proven otherwise, this signal has been an effective tool since the start of this bull market and given investors an edge to identify periods of strength.
Bitcoin:
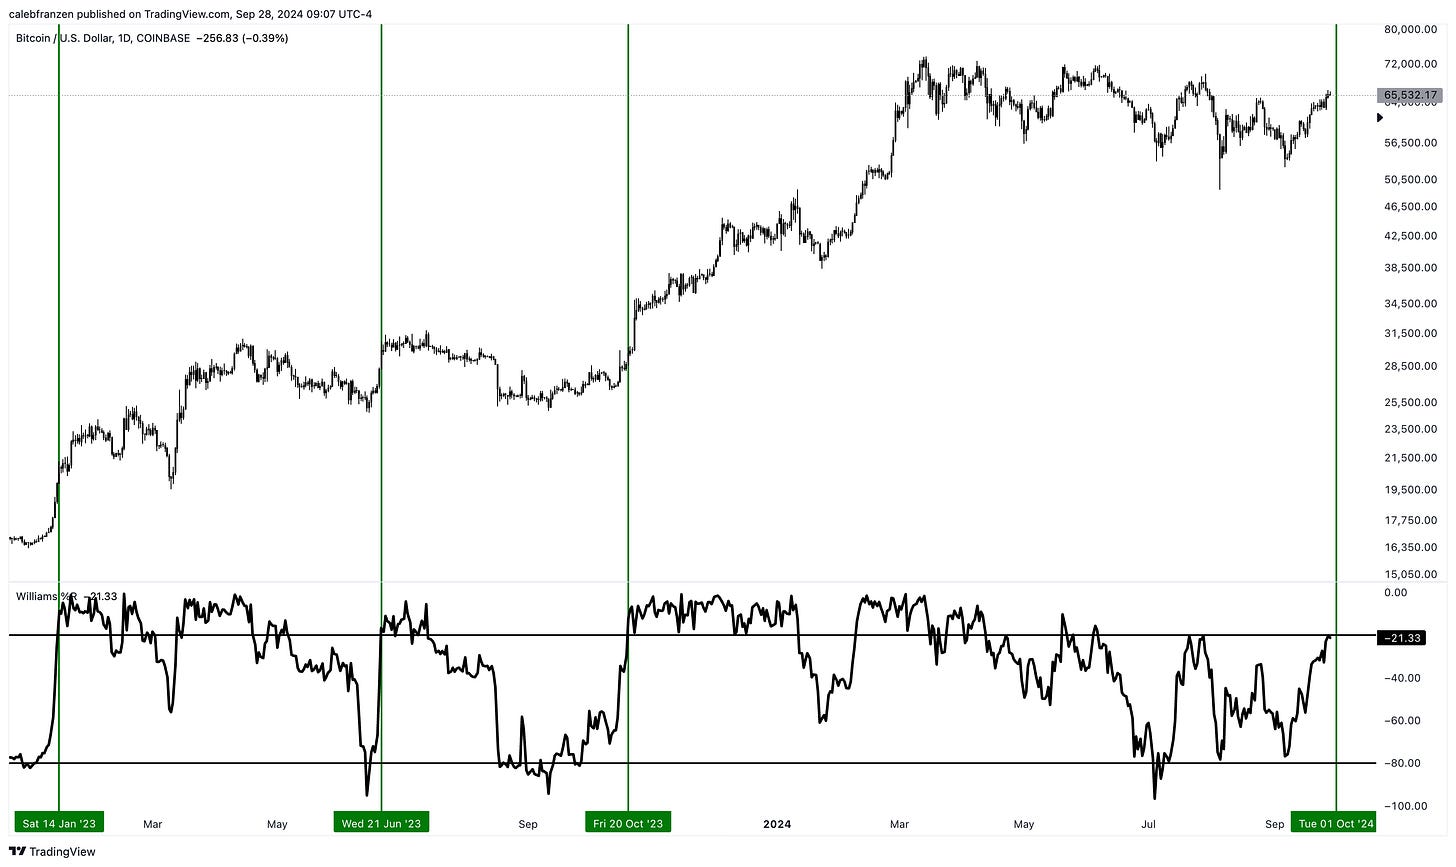
Building onto the analysis that we just covered for the Nasdaq-100, Bitcoin is also flashing the same exact signal!
Admittedly, this indicator has been less effective for BTC than it has been for the Nasdaq due to the fact that it marked local market tops following the signal in June 2023 and May 2024; however, it also ignited massive market rallies in January 2023 and October 2024.
However, because BTC trades 24/7, this 60-day signal measures the 2-month trend whereas the Nasdaq signal measures the 3-month trend.
Therefore, if we adjust this indicator to measure 90 days, we see the following:
The May 2024 signal never flashed with this adjusted indicator, significantly improving the win rate of this signal, which could be on the verge of flashing in the coming days/weeks. With a 67% short-term win rate since the beginning of 2023, I think that investors should be highly prepared for this potential signal to flash again.
Best,
Caleb Franzen,
Founder of Cubic Analytics
This was a free edition of Cubic Analytics, a publication that I write independently and send out to 11,000 investors every Saturday. Feel free to share this post!
To support my work as an independent analyst and access even more exclusive & in-depth research on the markets, consider upgrading to a premium membership with either a monthly or annual plan using the link below:
SPONSOR:
This edition was made possible by the support of REX Shares, a financial services and investment company that creates an array of unique investment products and ETNs.
I first collaborated with the REX Shares team in 2023 because I’ve been using their products as trading vehicles since 2022 and it was an organic & seamless fit. They have a unique product-suite, ranging from leveraged products, to inverse products, and income-generating products.
They recently listed their brand new and unique funds, providing directional leveraged exposure to Microstrategy. Whether you’re a bull or a bear on BTC or MSTR, these funds could provide significant opportunities, especially because there’s nothing like it in the rest of the market.
Please follow their X/Twitter and check out their website to learn more about their services and the different products that they offer. The REX Shares team did not have any say about the specific language, analysis, or commentary contained in this report
DISCLAIMER:
This report expresses the views of the author as of the date it was published, and are subject to change without notice. The author believes that the information, data, and charts contained within this report are accurate, but cannot guarantee the accuracy of such information.
The investment thesis, security analysis, risk appetite, and time frames expressed above are strictly those of the author and are not intended to be interpreted as financial advice. As such, market views covered in this publication are not to be considered investment advice and should be regarded as information only. The mention, discussion, and/or analysis of individual securities is not a solicitation or recommendation to buy, sell, or hold said security.
Each investor is responsible to conduct their own due diligence and to understand the risks associated with any information that is reviewed. The information contained herein does not constitute and shouldn’t be construed as a solicitation of advisory services. Consult a registered financial advisor and/or certified financial planner before making any investment decisions.
Please be advised that this report contains a third party paid advertisement and links to third party websites. The advertisement contained herein did not influence the market views, analysis, or commentary expressed above and Cubic Analytics maintains its independence and full control over all ideas, thoughts, and expressions above. The mention, discussion, and/or analysis of individual securities is not a solicitation or recommendation to buy, sell, or hold said security. All investments carry risks and past performance is not necessarily indicative of future results/returns.
Each investor is responsible to understand the investment risks of the market & individual securities, which is subjective and will also vary in terms of magnitude and duration.


Interesting that for Bitcoin, the 60-day Williams%R Oscillator has alternated between indicating local tops and indicating the beginning of rallies - ⬆️⬇️⬆️⬇️. Could just be coincidental, but if the pattern continues, ⬆️ is up next.
Could not access chartbook, as I do not use X. Ty.