Investors,
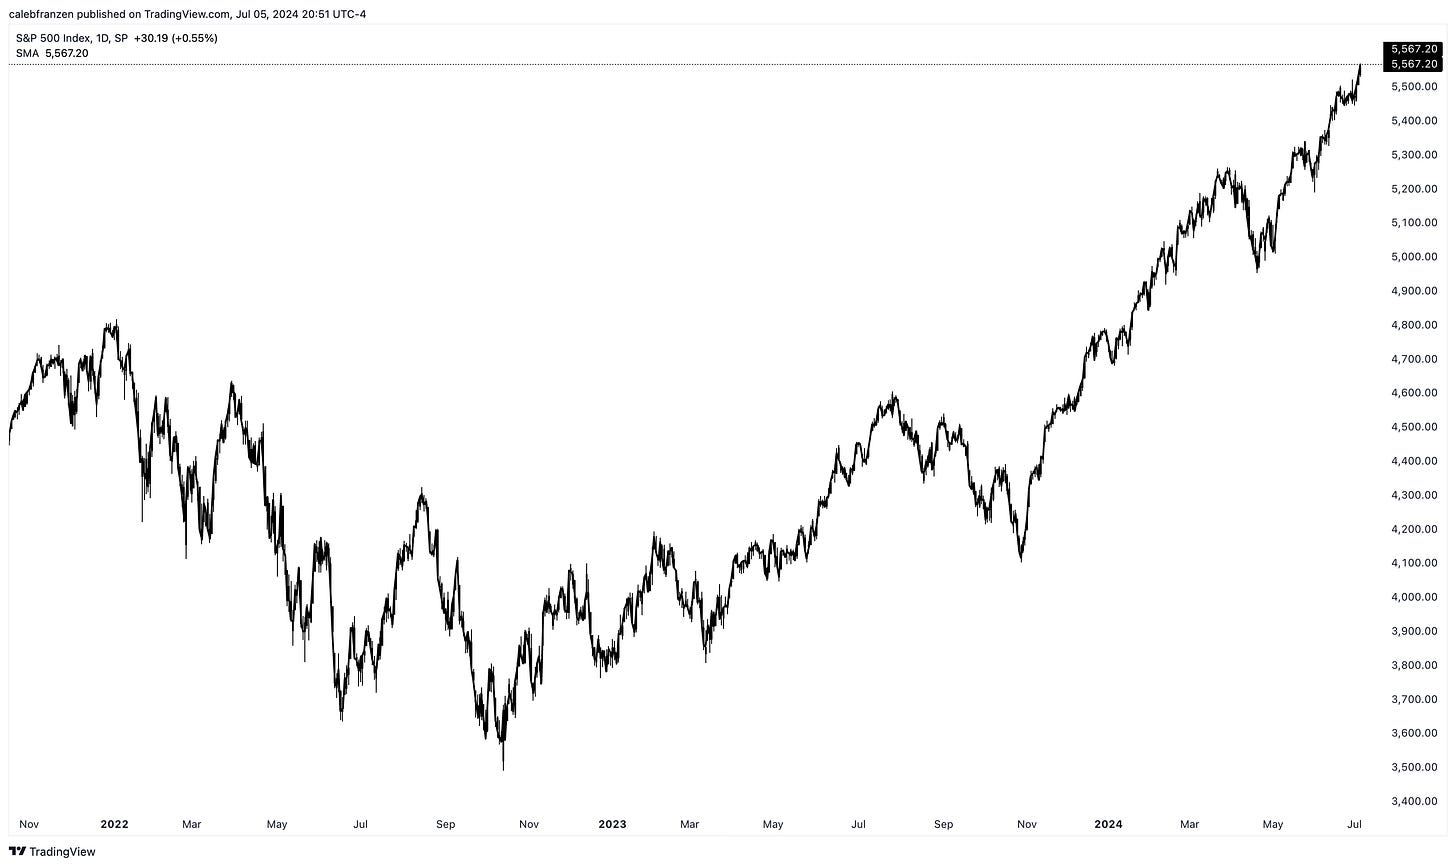
The S&P 500 has made new all-time highs in 4 of the past 5 trading days.
The index, which is up +16.7% YTD, just secured the highest weekly close ever (again).
So far in 2024, the S&P 500 has made new all-time closing highs in 34 trading sessions, highlighting the strength of the greatest index across global equity markets.
What is the driving factor behind this strength in the S&P 500?
Resilient & dynamic macro data that is modestly softening, amidst a disinflationary environment where forward earnings expectations are simultaneously rising.
In other words, the exact outlook that I shared in December 2023 (and prior to that) when I published “My Outlook Is Simple”. If you’re a relatively new subscriber to Cubic Analytics (welcome to the team), or if you’d like a refresher on my macro views, I’d encourage you to take 90 seconds to read the intro of that report.
The goal of this report is to highlight the key dynamics and interesting datapoints that I saw throughout the week, with the intention of making you more in-tune with ongoing market trends or to counter some misleading headlines you might’ve seen.
As always, these Saturday reports are completely free and available to all 11,700+ subscribers of Cubic Analytics, which means you can send this to any of your colleagues, family, or friends who will gain value from reading it.
Without further ado, let’s begin.
Macroeconomics:
Jobs, jobs, jobs.
The U.S. economy is creating plenty of them.
Yes, revisions are coming in lower than the initial reports had proclaimed, but context around this topic is vital in order to fully understand the dynamics of the labor market.
The simple truth is that the labor market remains resilient & dynamic, but is softening.
As always, I’ll embrace nuance and take the weight of the evidence.
There are three primary complaints coming from macro Doomers, which I will refute.
Part-time jobs are driving the increase in nonfarm payrolls.
Government jobs are growing while private market jobs shrink.
Downward revisions highlight the facade of labor market strength.
None of these statements are necessarily untrue; however, they are being overly emphasized to suggest that there is significant weakness in the labor market.
Therefore, my contention is that these dynamics are relatively insignificant.
Starting with part-time jobs, I’ll debunk each of these claims…
First of all, we must recognize that some people are working part-time jobs due to preference, lifestyle, or existing commitments. For example, an elderly person aged 65+ might choose to work less than 20 hours per week at their local grocery store or a college student might only be able to work 15 hours per week at the school library.
Due to their resource constraints or lifestyle, some folks actually seek part-time work!
There is a key subset of part-time work known as “part-time for economic reasons”.
This cohort refers to workers who are involuntarily employed part-time because of economic factors, such as:
Involuntary Reduction in Hours: The worker’s hours have been reduced by their employer due to slow business conditions, insufficient demand, or other economic reasons.
Inability to Find Full-Time Work: The worker is seeking full-time employment but is unable to find it, so they accept part-time work as a temporary measure. In some cases, if possible, these workers will take on multiple part-time jobs in order to replicate the total income from one full-time job.
In either case, these workers would prefer to work full-time but are constrained by external economic conditions that reduce their opportunities. They are distinct from those who choose part-time work for personal or voluntary reasons, such as attending school, caring for family members, or semi-retirement.
So this is the subset of part-time workers that actually matters in terms of representing economic dynamics, not the voluntary subset of part-time workers.
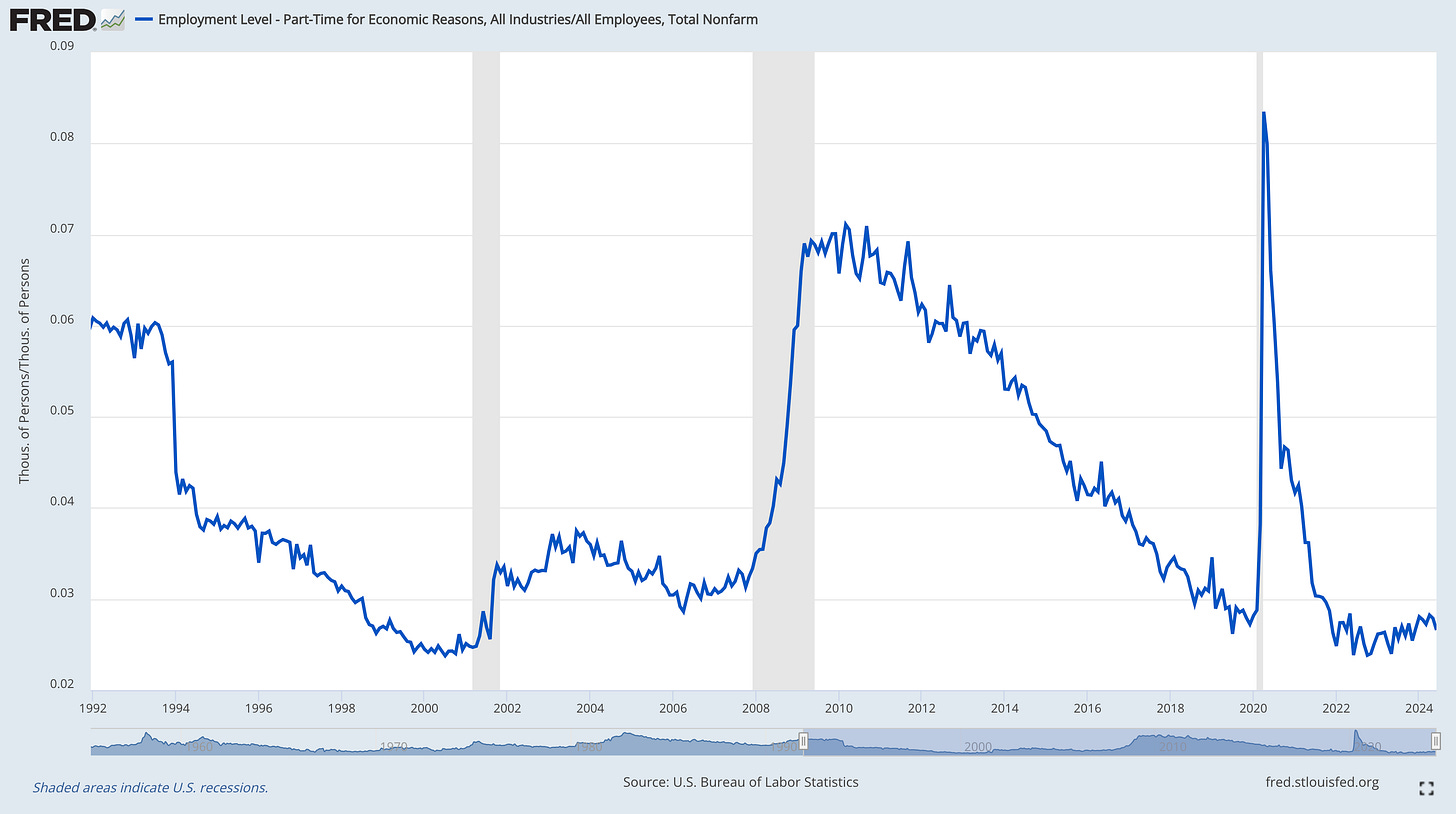
When we look at this group of part-time for economic reasons, we see the following:
Generally speaking, this cohort has been steadily on the rise since 2022; however, it’s actually decreased over the past two monthly reports.
The latest data from the June 2024 nonfarm payrolls showed that there were 4.22M part-time jobs due to economic reasons… but how does this compare to the total labor force?
The total nonfarm payrolls in June was 158.638M (growing by +206,000 jobs in the month of June), which implies that part-time jobs due to economic reasons are merely 2.66% of the total amount of jobs in the economy.
2.66%…
TWO POINT SIXTY SIX PERCENT!
This is the figure that the Doomers want you to worry about.
In my view, while it’s certainly sad that 4.22M jobs are being held by people who want to find full-time employment, this is a relatively insignificant portion of the total labor force and not something at all that is a major influence on broader labor market dynamics. I’d much rather focus on the 97.34%.
In fact, we can track this relative figure on a historical basis and quickly see that there isn’t an epidemic of part-time work with this one simple chart:
One of the key datapoints that I’ve referenced before is multiple jobholders as a percentage of the employed, which remained stable at 5.2%.
Together, these datapoints indicate that there isn’t an epidemic of part-time work.
I’ll let the Doomers focus on the 2.78% and the 5.2%, while they continue to proclaim that an imminent collapse of the labor market is around the corner. They’ve been screaming this for 2+ years, and some for even longer, to no avail.
On the other hand, I’ve been a staunch advocate that the labor is resilient & dynamic and that it will likely remain that way, with some modest but steady softening.
The second complaint about the labor market is that government jobs, which are often viewed as sub-optimal and unproductive because they are financed either via taxes or debt, are outpacing private market jobs.
As I alluded to, this is true.
But again, context is key…
Below is a graph of total private market jobs (blue) and total government jobs (red), with both on the same y-axis:
As of the latest data for May 2024:
🔵 Total private market employees = 135.274M
🔴 Total government employees = 23.364M
In other words, private jobs outnumber government jobs 5.8 to 1.
If we combine both private & government jobs (158.638M), then government jobs are only 14.7% of the total labor market. Thankfully, I’m able to calculate and display what this percentage has looked like throughout history and the result is stunning:
Factually, government jobs as a percentage of total U.S. jobs has been steadily declining since the 1970’s and is still trading below the pre-COVID lows. This is important because it highlights how private jobs have increased more than government jobs since the beginning of the COVID pandemic. Specifically, private market jobs have increased by +4.5% relative to their pre-COVID peak, while government jobs have increased by +2.3% over the same time period.
Given this context, it’s clear why Doomers’ concerns are overstated.
We can worry about a small subset of data or we can focus on the big picture within the historical context, recognizing that the labor market isn’t perfect, but it’s sufficiently supportive of broader economic activity & consumption.
The final point to acknowledge is the downward revisions. Oddly, Doomers only want to focus on downward revisions, but failed to acknowledge the upward revisions that occurred in February & March 2024. Instead, they make it sound as if each month receives a massive downward revision after the initial report, hinting that the data is being massaged to sound better than it actually is at first glance.
But let’s talk specifics, as the April & May data had combined downward revisions of -111,000 jobs. However, despite the updated figures coming in substantially lower than the initial estimates, the combined number of jobs created in April & May were +328,000 jobs!
While the initial estimates were too rosy, the updated figures are still very solid!
We’re talking about an average of 164k jobs being created per month!
It’s not as if the total amount of jobs in the U.S. economy are contracting or growing at an anemic pace of 20,000 per month. This is simple, but vital, to understand:
The economy added an average of 164,000 jobs per month over the past two months.
That is NOT recessionary.
In fact, the average amount of jobs created so far in 2024 is +222k jobs per month (which is adjusted for all of the subsequent revisions that occurred after the initial release).
As we assess each of these three primary arguments & complaints about the labor market, focusing on the full picture to understand the context of each datapoint, I think it’s obvious that the concerns are being over-exaggerated. We can’t miss the forest for the trees & we must embrace nuance to diagnose labor market conditions.
In doing so, the takeaway is that the labor market remains both resilient & dynamic.
Stock Market:
Arguably the most important trend in the market right now is the rapid resurgence of software stocks over the past ~30 days. Specifically, the iShares Expanded Tech Software ETF ($IGV) is up +16.8% since the intraday low on May 31st!
IGV has 115 individual stocks in the fund, with the following top 10 holdings:
Adobe (ADBE)
Salesforce (CRM)
Microsoft (MSFT)
Oracle (ORCL)
Intuit (INTU)
ServiceNow (NOW)
Palo Alto Networks (PANW)
Synopsys (SNPS)
CrowdStrike (CRWD)
Cadence Design Systems (CDNS)
Together, these 10 stocks combine for a total weighting of 62.04%.
The fund made new multi-year highs on Friday, generating a gain of +1.19%:
The current regression breakout, which I outlined in real-time on X, looks nearly identical to the momentum thrust from Q4’23, which generated a total trough to peak rally of +35.6% during a 3.5-month period.
Amazingly, IGV hasn’t even made new all-time highs yet (though it’s on the verge of doing so):
Personally, I expect to see a breakout to new ATH’s in the very near future.
Bitcoin:
I’m going to conduct a deep-dive on Bitcoin in tomorrow’s premium edition of Cubic Analytics… to receive that report and access the entire value of Cubic Analytics, consider upgrading to a premium membership using the link below:
I look forward to sharing that new & exclusive research with you!
Best,
Caleb Franzen,
Founder of Cubic Analytics
DISCLAIMER:
This report expresses the views of the author as of the date it was published, and are subject to change without notice. The author believes that the information, data, and charts contained within this report are accurate, but cannot guarantee the accuracy of such information.
The investment thesis, security analysis, risk appetite, and time frames expressed above are strictly those of the author and are not intended to be interpreted as financial advice. As such, market views covered in this publication are not to be considered investment advice and should be regarded as information only. The mention, discussion, and/or analysis of individual securities is not a solicitation or recommendation to buy, sell, or hold said security.
Each investor is responsible to conduct their own due diligence and to understand the risks associated with any information that is reviewed. The information contained herein does not constitute and shouldn’t be construed as a solicitation of advisory services. Consult a registered financial advisor and/or certified financial planner before making any investment decisions.


Facts, just facts. 👌🙏🏼
Golden information