The Music's Playing? Then Dance!
Investors,
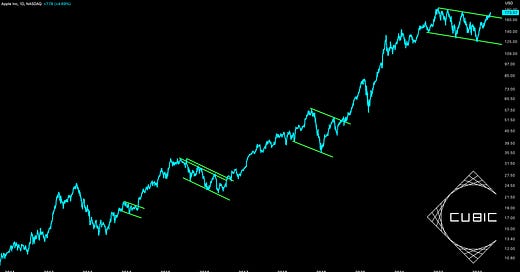
Apple Inc. ($AAPL) is the largest company in the world, valued at $2.764Tn as of Friday’s close. The stock has gained +39% YTD, requiring a mere +5.5% gain to create new ATH’s. In December 2022, I shared a medium-term analysis of Apple stock and noted that shares were trading in a descending parallel channel.
Today, the stock has shattered through the upper-bound of that channel, which appears to be a bull flag breakout and paint an optimistic view of the future. Generally, these types of breakouts for AAPL have been rare over the past 13 years, but generally suggest that bullish momentum is underway:
If the largest stock in the U.S. market is experiencing bullish tailwinds, the rest of the market will likely benefit from the upward momentum!
And guess what?
The second largest company in the world, Microsoft Corp, also broke out of a similar bull flag months ago, which I foreshadowed on Twitter in January:
MSFT stock has gained +30% since that post, achieving a massive breakout above the 200 day moving averages and the channel.
I’m not suggesting that AAPL will gain +30% in the coming months, though the stock has clearly exhibited an ability to produce those gains in a short period of time. I’m merely acknowledging that the two largest stocks in the market are experiencing bullish price dynamics and this could have a ripple effect on the broader market. Specifically, AAPL + MSFT combine for 25% of the Nasdaq-100’s total market cap. If 25% of the index is experiencing a bullish breakout, it’s very possible that the rest of the market follows suit.
In the days and weeks ahead, it will be vital to ensure that AAPL holds & confirms the breakout signal we reviewed above. If so, I wouldn’t be surprised to see the rest of the market bid higher. As the saying goes, “when the music’s playing, you have to dance.”
In the remainder of this report, I’ll share exclusive analysis covering:
S&P 500 market internals.
Mega-cap price structure.
Sentiment.
Leverage.
Positioning.
In total, we’ll review 13 exclusive charts to provide meaningful takeaways about ongoing market dynamics and the potential impact that could follow.


