
The Most Underrated Chart

Investors,
This is the most underrated chart for the stock market right now, showing the relative performance between small cap growth and small cap value (IWO/IWN):
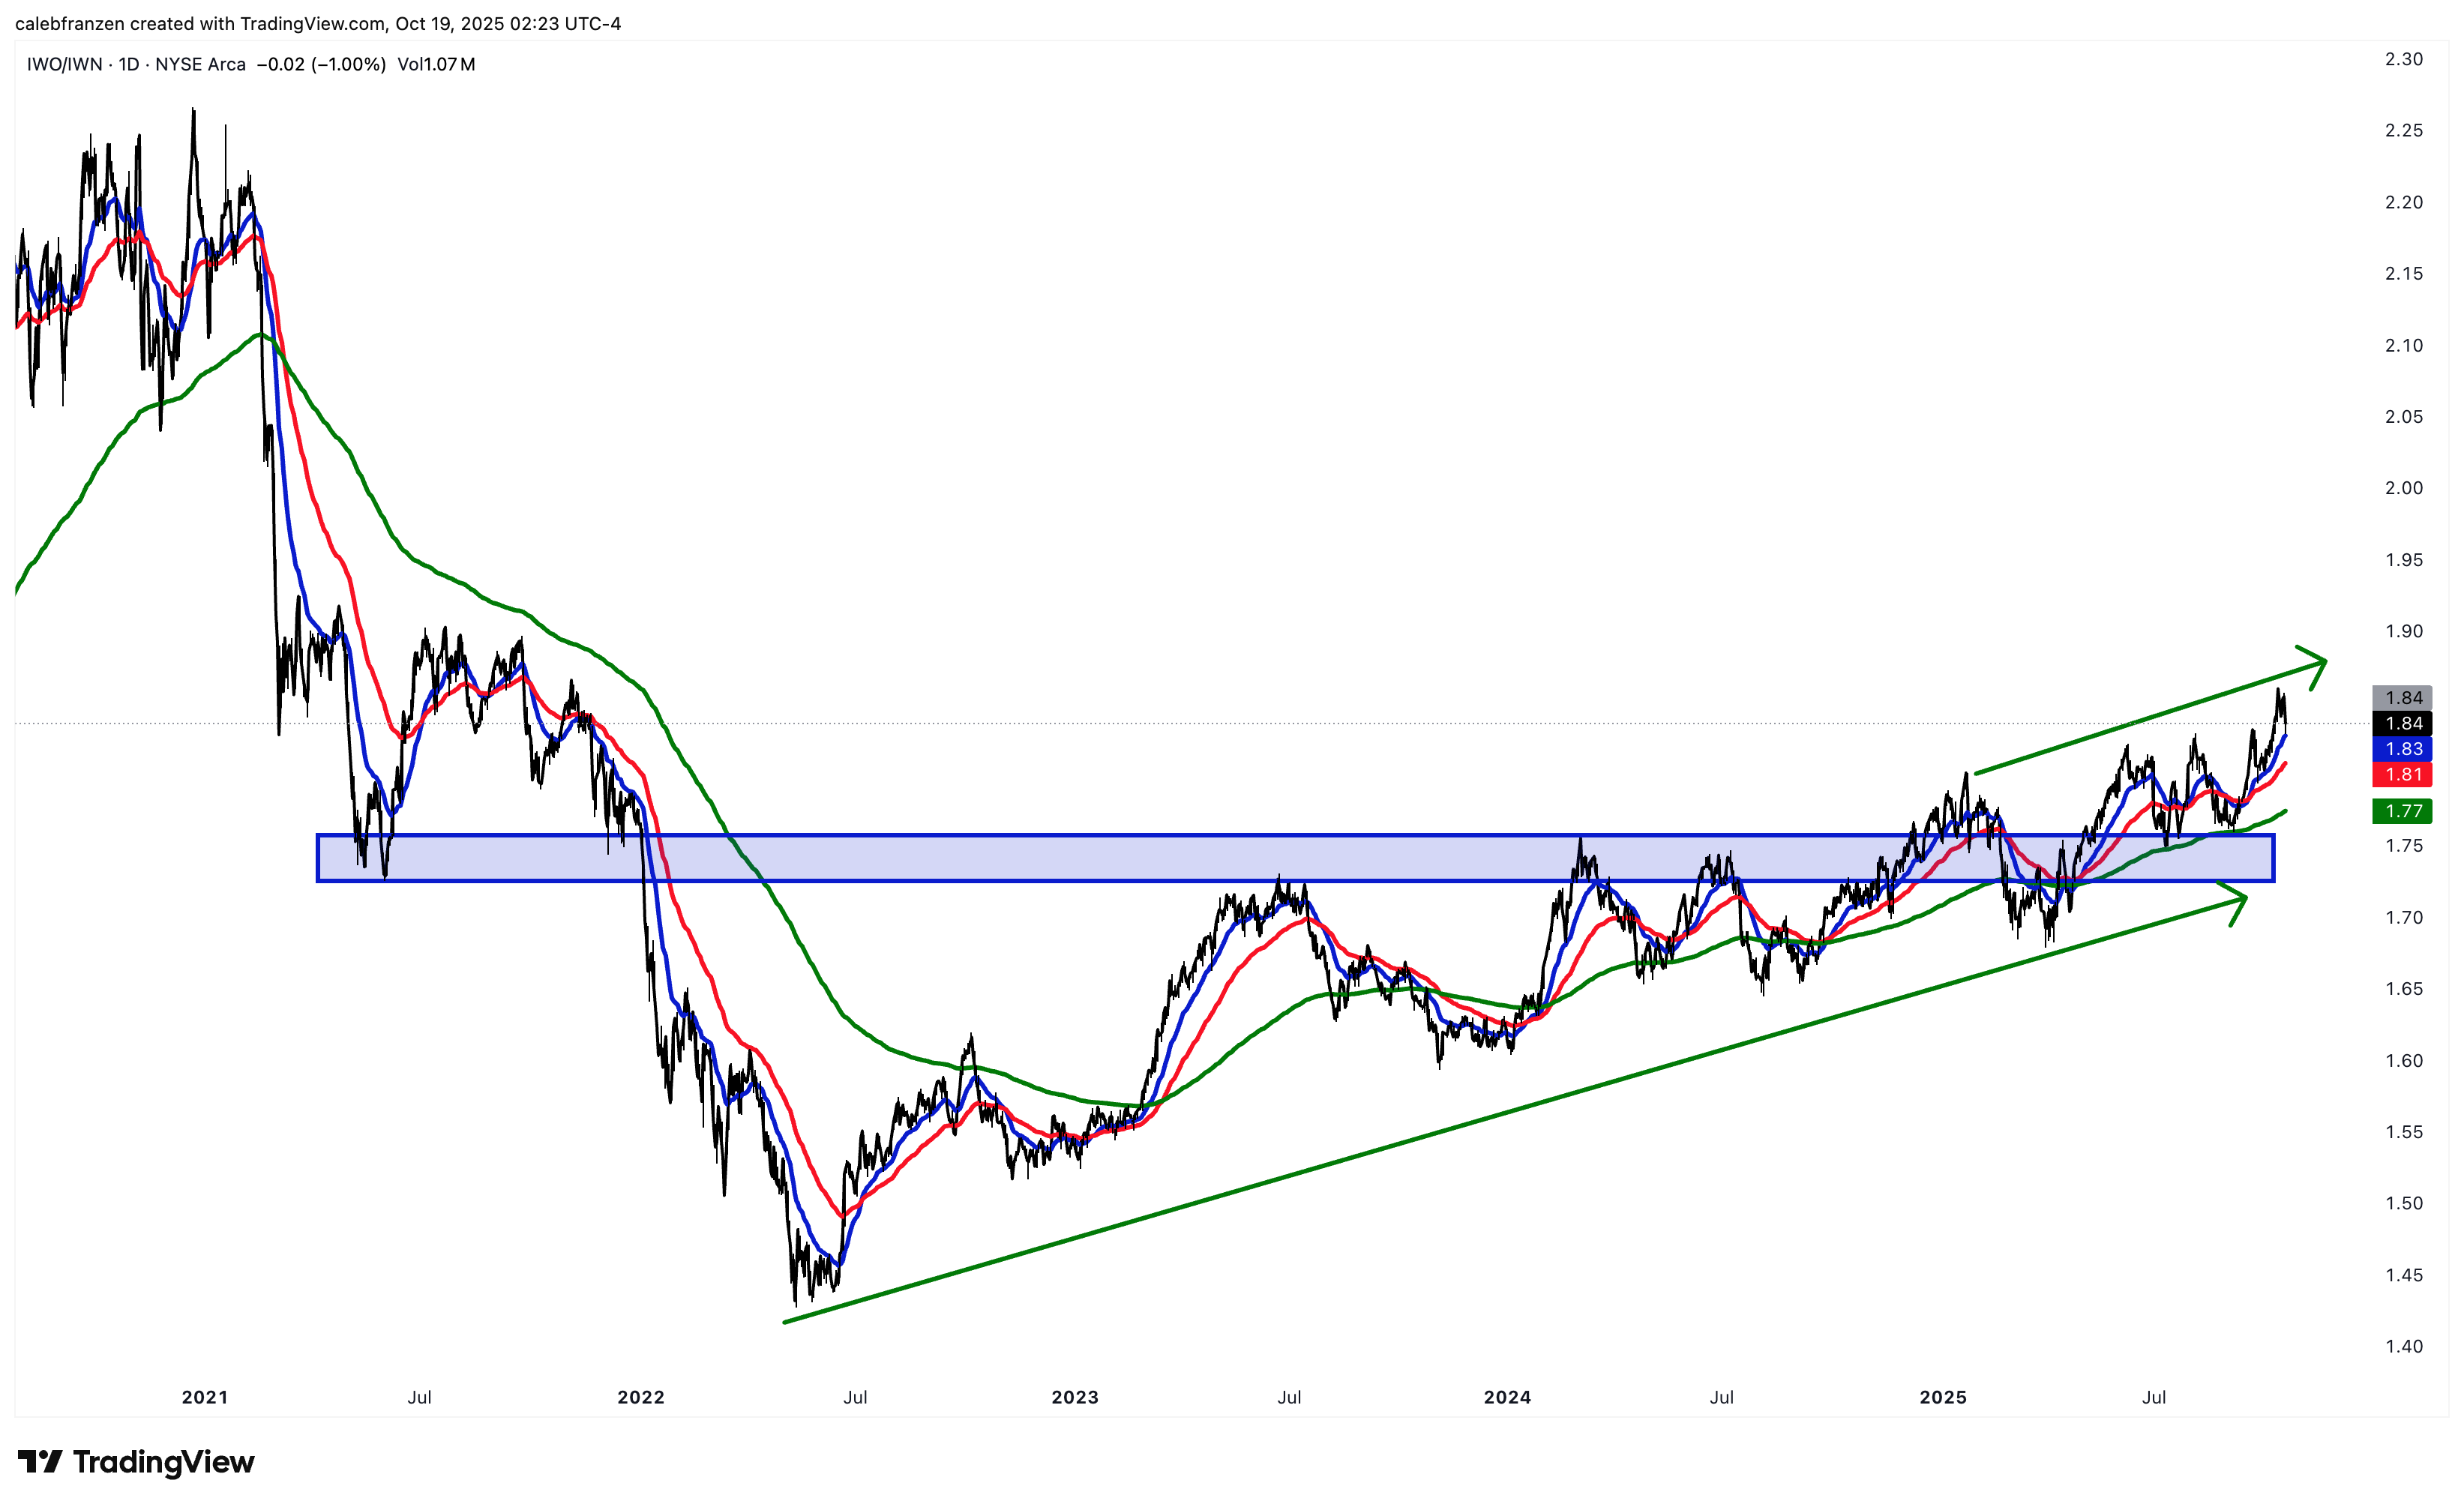
This risk-on vs. risk-off ratio just made new multi-year highs this past week, trending beautifully above its 21/55/200-day EMAs, while producing a string of higher lows since mid-2022.
In other words, for as long as this broad-based bull market has been intact, this ratio has been rising.
Therefore, if we want to reaffirm or challenge the validity of this bull market, this ratio can provide sufficient evidence to confirm or negate the uptrend.
Given that it’s producing higher highs, it’s likely that the stock market and Bitcoin will resume in their existing uptrends; however, we must recognize that all uptrends experience pullbacks in order to have the opportunity to produce a higher low.
If this chart consolidates, which would be perfectly normal, by retesting its moving averages or even the blue accumulation zone, we should expect to see weakness in risk appetite and a contraction for the stock market and Bitcoin.
But given that the ratio of IWO/IWN is firmly in an uptrend (for 3+ years), my bias must align with this uptrend and expect that it will continue to produce higher highs & higher lows.
Interestingly, this ratio is also useful as a macroeconomic tool…