Investors,
We’re often reminded of the phrase that “history doesn’t repeat, but it rhymes”, but I want to add another layer to this by acknowledging that the market is symmetrical.
Not all the time, but sometimes…
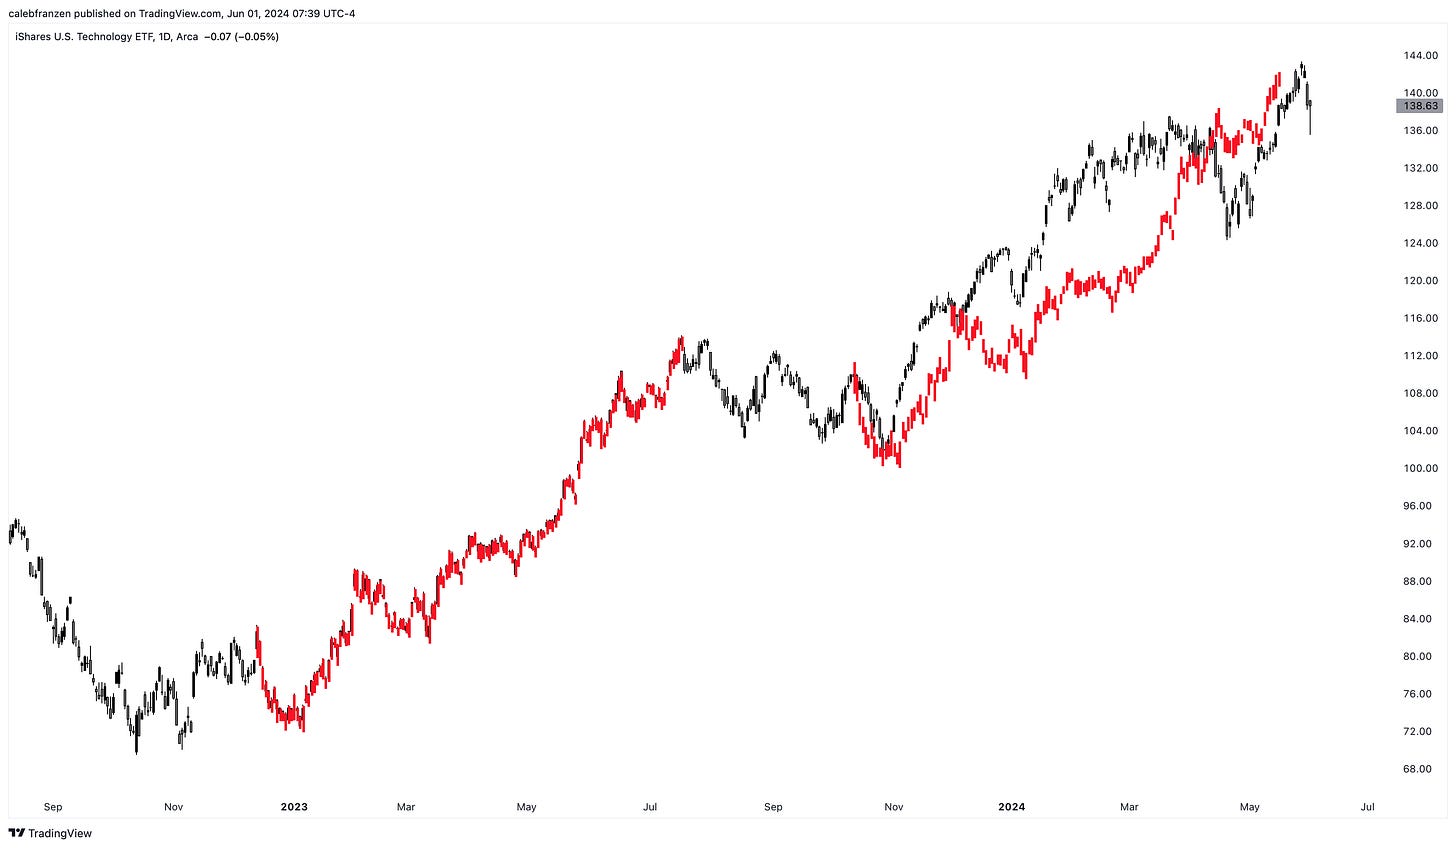
Take the technology sector ($IYW) as an example:
If we measure the market rally from the January 2023 lows to the July 2023 highs, then duplicate the price action and anchor it to the starting point of the Q4’23 rally, we see that the market is symmetrical in terms of the length & magnitude of the rally!
Maybe you think I’m cherry-picking (I’m not), so here’s another piece of symmetry:
We can even pivot the starting point to the December 2022 highs and measure the market movement through the July 2023 highs. This mirrors the final leg lower in Q4’23 that eventually sparked the ongoing rally.
Again, we can identify symmetry in the price action of technology stocks, which are the largest and most important stocks in the entire market.
But it gets even weirder…
If we zoom out further and measure the price action from the COVID lows to the November 2021 highs, then duplicate that rally and anchor it to the October 2022 lows, we see the following:
While the path is different (history rhymes), the length & magnitude of the current rally since the October 2022 is identical to the bull market of 2020 - 2021.
Does this mean that the current bull market is over? Personally, I don’t think so.
Does this mean that we might experience a local market top that could last for a few weeks/months before continuing to make new all-time highs and resume higher?
Possibly.
While these charts are interesting food for thought, we can replicate this analysis for the Dow Jones Industrial Average and argue that there’s plenty of room to run!
Therefore, it’s impossible to come to any concrete conclusions with this analysis, but it’s fascinating to know that the market can be so symmetrical in such key moments.
In the remainder of this report, I’m going to highlight the key dynamics that I’m currently seeing in the economy, the stock market, and Bitcoin/crypto…
Macroeconomics:
Inflation data continues to decelerate, which is the definition of disinflation.
Specifically, the April PCE data confirmed the recent dynamics in both the CPI & PPI, which should continue to give the Federal Reserve confidence that inflation trends are still moving in the right direction, though slower than desired.
On a year-over-year (YoY) basis, Personal Consumption Expenditures inflation was:
🟢 Headline PCE = +2.7% YoY (vs. +2.7% prior)
🔵 Core PCE = +2.8% YoY (vs. +2.8% prior)
🟠 Median PCE = +3.3% YoY (vs. +3.4% prior)
When rounding to the nearest tenth, YoY figures for headline & core PCE were stable; however, it’s important to note that modest decelerations were apparent when measured in hundredths.
So while disinflation was not material in headline or core, it was visible, particularly for median CPI, which measures the item whose expenditure weight is in the 50th percentile of the price change distribution. Even the Dallas Fed’s metric for trimmed-mean PCE inflation decelerated in April:
Is this disinflationary progress sufficient for the Fed to cut rates? Absolutely not.
But it’s progress nonetheless and Powell has repeatedly said that the Fed is simply looking for more evidence that inflation is moving “sustainably towards 2%”.
This latest round of data is a step in the right direction.
Stock Market:
The S&P 500 had one of the most incredible days that I’ve ever witnessed on Friday.
The S&P 500 erased all of the losses from Wednesday, Thursday, and the first half of Friday’s session, producing an intraday rally of +1.74% from the lows in the final 3.5 hours of the trading session.
What made it even more amazing is that there was no news to catalyze the rally…
What happened? Why did it happen?
These questions don’t matter to me.
I only care that it did happen.
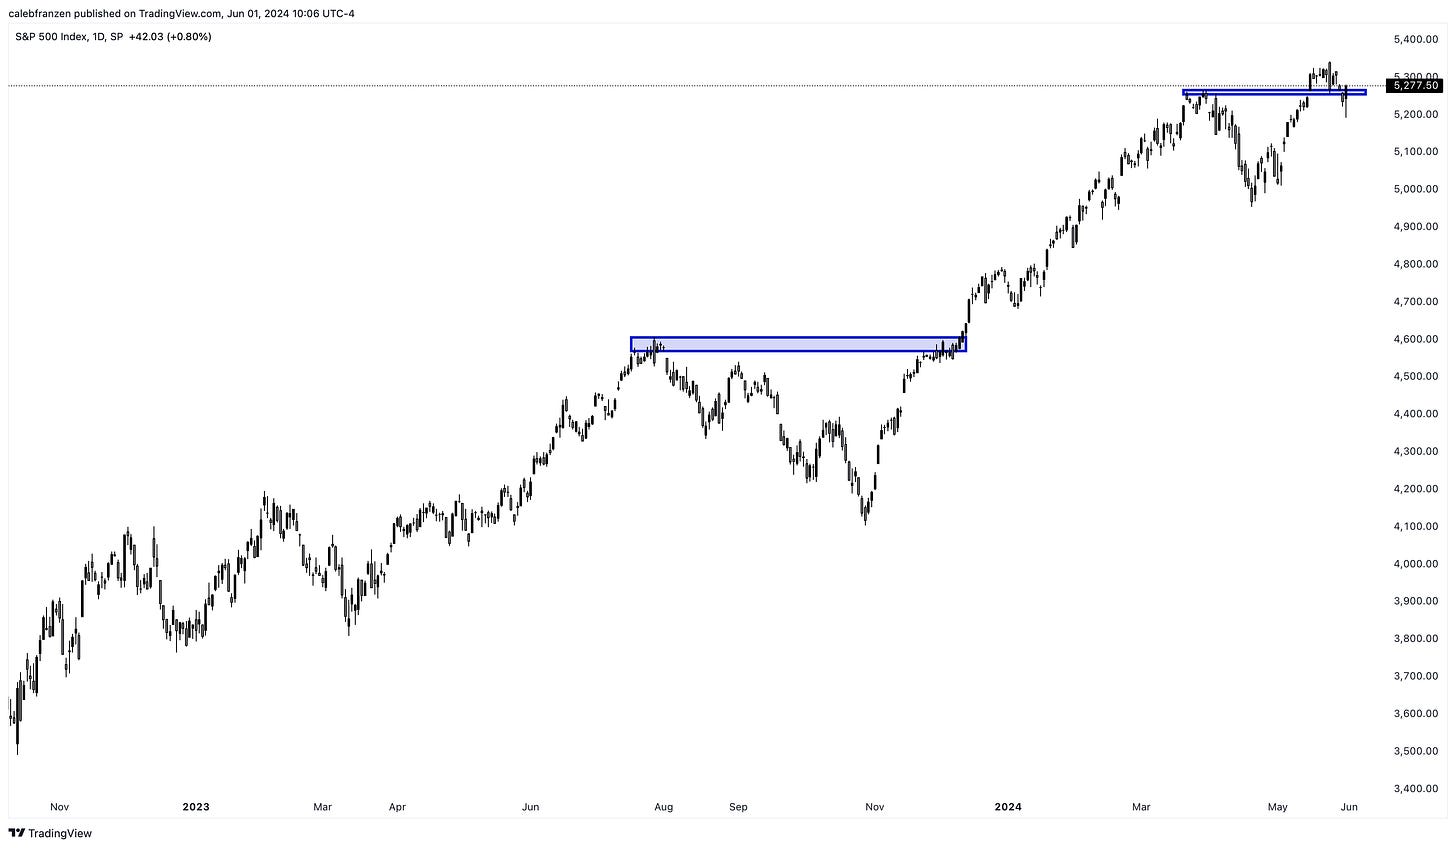
With the massive intraday rally to end the week, we had strong closes on a daily, weekly and monthly basis:
S&P 500 daily close, recovering back above the former YTD (and all-time) highs:
Equal-weight S&P 500 ($RSP) recovered back, appearing to produce a higher low:
The Nasdaq-100 experienced a similar intraday recovery on Friday, securing an amazing monthly return of +6.28% for May 2024 (the highest monthly close ever).
For what it’s worth, the S&P 500 also had the highest monthly close of all-time, generating a monthly return of +4.8%:
None of this is bearish, whatsoever, especially because bearish setups failed to persist.
Bitcoin/Crypto:
Last week, I mentioned how the Biden administration had seemingly made a 180° turn with respect to their position on crypto… however, all of that progress was reversed on Friday evening when Biden decided to veto the SAB 121 bill.
This was a complete flip-flop on policy, as Biden had previously stated that he would no longer plan to veto the bill, if it had passed.
He initially planned to veto, then stated that he wouldn’t veto, but decided to veto.
As I stated last week, “it’s likely that crypto will, in part, act as a proxy for Trump’s likelihood of winning the presidency, whether we like it or not.”
This recent veto by Biden only cements this concept even further.
Nonetheless, Bitcoin is currently trading at $67.7k, a noticeable decline from the weekly peak of $70.6k on Monday. The decline was correlated with stock market dynamics through the week:
Therefore, based on this correlation, the resurgence in the stock market on Friday could bode well for BTC & crypto prices in the event that stocks continue to rally.
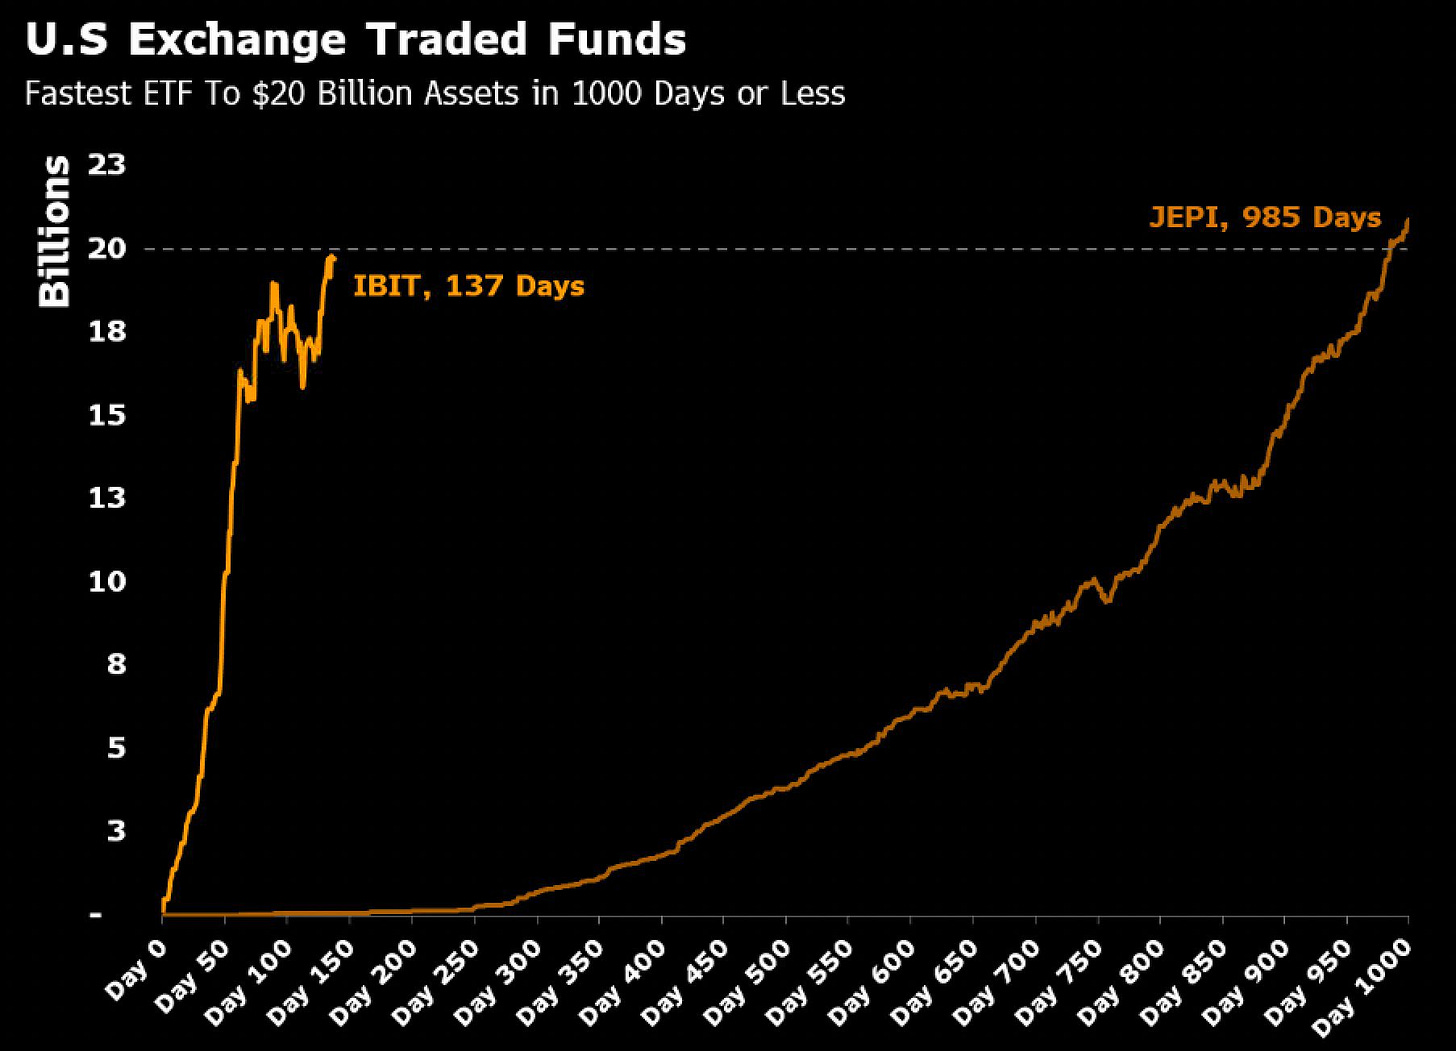
One piece of amazing information that I came across is the fact that the BlackRock Bitcoin ETF ($IBIT) is only the 2nd ETF in history to reach $20Bn in AUM in less than 1,000 days:
The difference is that it took IBIT 1/7th the amount of time that it took JEPI.
When we think about the success of the spot Bitcoin ETFs and the amount of demand that institutional capital has to acquire BTC, this chart in and of itself gives us a clear answer.
Caleb Franzen,
Founder of Cubic Analytics
DISCLAIMER:
This report expresses the views of the author as of the date it was published, and are subject to change without notice. The author believes that the information, data, and charts contained within this report are accurate, but cannot guarantee the accuracy of such information.
The investment thesis, security analysis, risk appetite, and time frames expressed above are strictly those of the author and are not intended to be interpreted as financial advice. As such, market views covered in this publication are not to be considered investment advice and should be regarded as information only. The mention, discussion, and/or analysis of individual securities is not a solicitation or recommendation to buy, sell, or hold said security.
Each investor is responsible to conduct their own due diligence and to understand the risks associated with any information that is reviewed. The information contained herein does not constitute and shouldn’t be construed as a solicitation of advisory services. Consult a registered financial advisor and/or certified financial planner before making any investment decisions.


When the swarm of crypto writers targets your emotional leverage, only a few focus on real due diligence work. My first is the best investment of the year—$20 monthly for ChatGPT. The second is $20 to Kaleb Franzen. Way to go!