Investors,
Panic has arrived.
Volatility is accelerating.
The Fear & Greed Index has reached “Fear”.
Yet the S&P 500 has fallen a mere -6.25% from the YTD highs in mid-July.
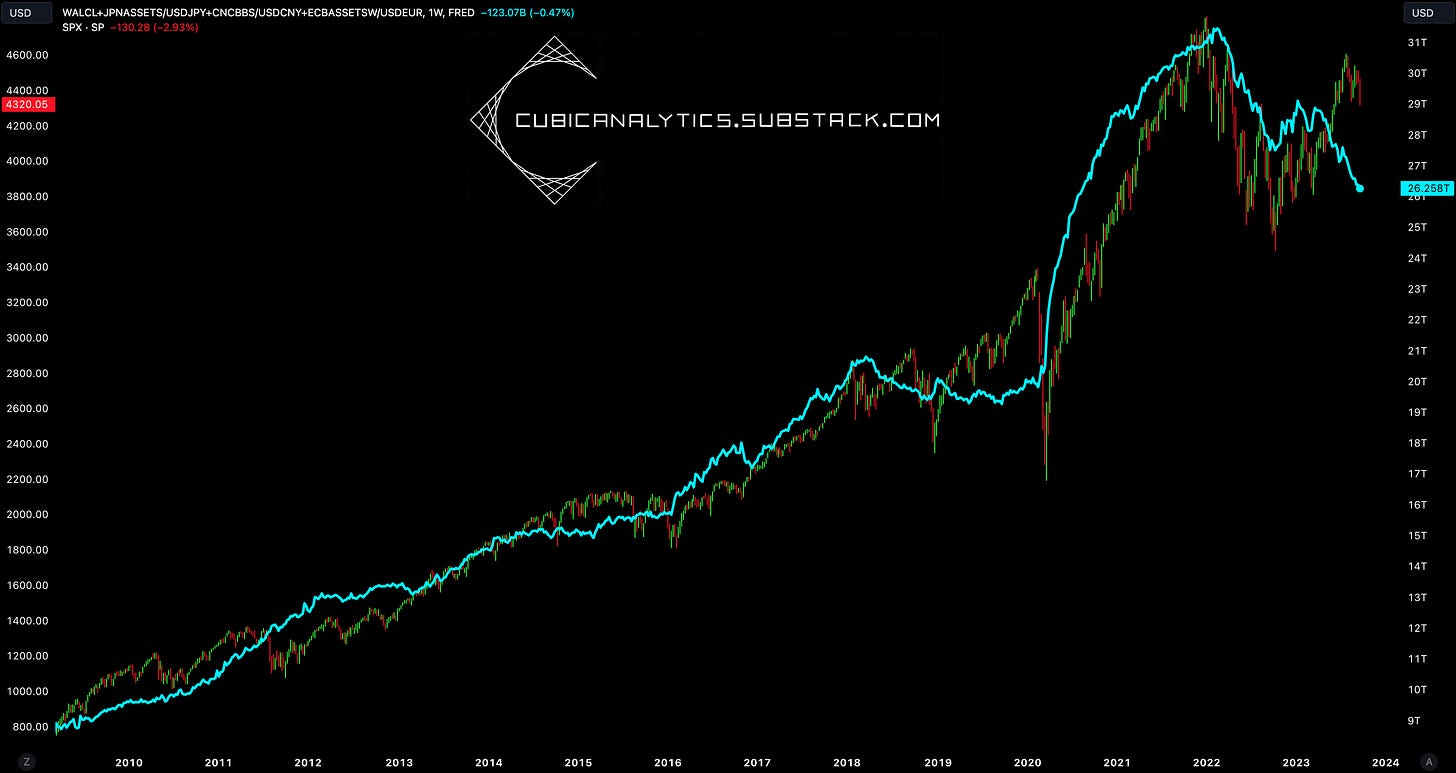
A decline of this magnitude is completely normal for the stock market, and I’ll be sharing specific data to support that claim in the “Stock Market” section of this report. The unique aspect of the current market environment is the massive divergence between asset prices and global central bank liquidity.
To be more specific, this chart is comparing the S&P 500 vs. the total amount of assets held by the following central banks, reflected in U.S. dollar terms:
The Federal Reserve
The European Central Bank
The Bank of Japan
The People’s Bank of China
Is central bank liquidity, in and of itself, solely responsible for the direction of the stock market? No, it’s not. However, I would certainly argue that it’s one of a few primary components that influence asset prices, given that central bank assets are a function of the interest rate environment, more or less.
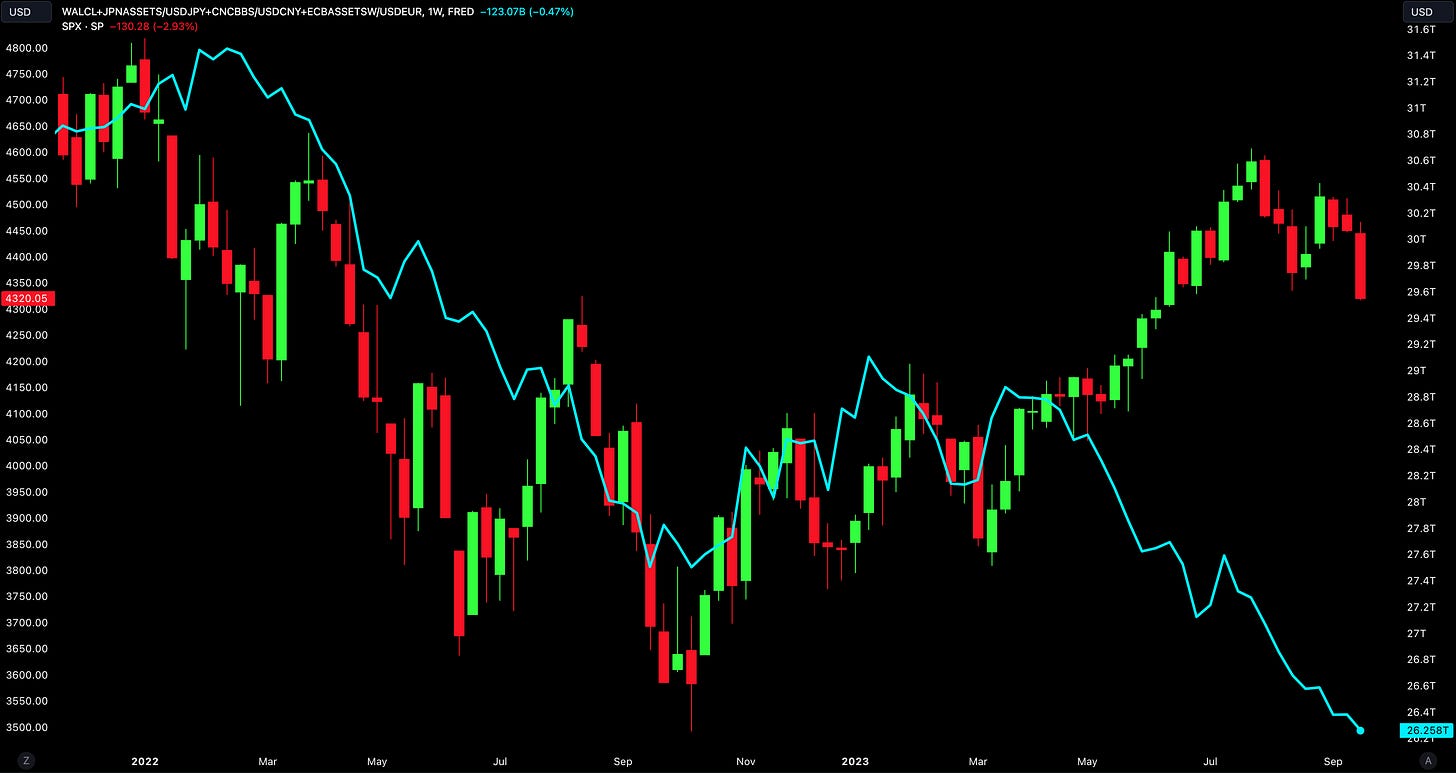
It doesn’t take a rocket scientist to recognize that the recent divergence in these two variables is quite rare, implying that we’ve been in a unique market environment. If we zoom in on this relationship since their respective peaks in Q1 2022, we can see a more detailed view of the ongoing divergence.
This relationship isn’t painting a rosy picture of what stocks are likely going to do next, particularly as the S&P 500 achieved its lowest weekly close since early June 2023. Given the heightened level of fear in the market, rising volatility, and shaky investor sentiment, we must confront the potential reality that the jaws of this divergence will close. Central banks, led by the Federal Reserve, appear committed to reducing the size of their balance sheet in an ongoing battle against global inflation.
In other words, expect the teal line to remain in a downtrend.
Will the S&P 500 be able to retain its upward momentum or will the jaws shut?
If you believe in the former, stay patient & wait for the formation of a higher low.
If you believe in the latter, short the stock market (and technology stocks in particular).
That’s your decision to make, not mine.
As a reminder, please make sure to read about the sponsor for this edition of Cubic Analytics, MicroSectors, in the section at the end of this report.
Macroeconomics:
The largest event of the week, by far, was the FOMC Policy Decision meeting and Jerome Powell’s press conference that ensued on Wednesday, September 20th. While it was seemingly the most important event of the week, investors and market participants already knew what to expect:
The Fed was going to pause (99% likelihood according to CME FedWatch).
The Fed was going to sound hawkish (74% probability according to X polls).
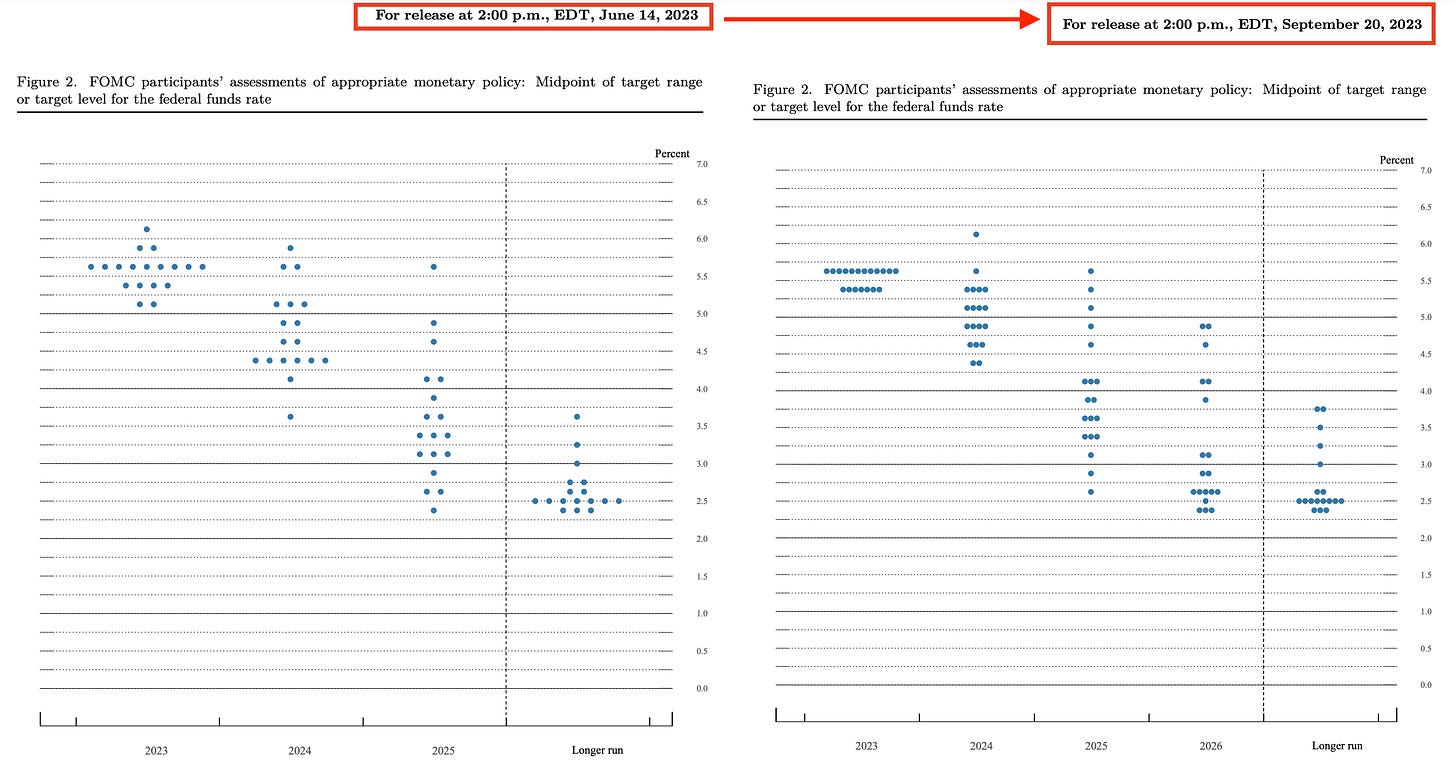
Both of those assessments were accurate, with the Federal Reserve maintaining the federal funds rate between 5.25% and 5.50% while raising their median forecast of the FFR in 2024. The Federal Reserve reaffirmed their commitment to higher for longer, using forward guidance as their policy tool to influence yields right now.
Specifically the median 2024 forecast was raised from 4.6% to 5.1%, a clear message that the Fed is still committed to fighting inflation & keeping interest rates elevated.
The hawkish tone is exactly how the Federal Reserve wants to conduct itself in this environment, especially when we consider the alternative!
Imagine a scenario where the Fed reduced their forecast for the 2024 federal funds rate vs. the forecast that they provided in the June meeting. Markets would celebrate based on the expectation that rates would be coming down sooner than previously anticipated. However, that celebration could be unwarranted in the event that inflation would reaccelerate, or perhaps become stickier than anticipated. In that scenario, the Fed would have backed themselves into a corner! They’d be forced to spring back into action at the risk of disrupting the market, which would be caught off-guard from another sudden shift in monetary policy.
As the saying goes, “plan for the worst and hope for the best.”
By raising their expectation of the federal funds rate in 2024, the Fed is planning for the worst and hoping for the best. This is significantly better than the alternative of reducing their forecast for the fed funds rate and potentially being forced later to tighten even more. During an inflationary cycle, the Fed thinks that it’s better to overpromise and under-deliver on tightening rather than underpromise and over-deliver on tightening. The Fed chose to talk tough, knowing full well that they might not have to follow-through on that forecast.
For right or for wrong, the Federal Reserve is committed to their fight against inflation and still believe that the current inflation rate is too high. While the inflation rate is decelerating, the Fed can’t declare victory at this point and want the market to believe in their steadfast commitment and resolve to “get the job done”, as Powell has said so many times. As far as I’m concerned, the Fed did what they needed to do.
It’s important to understand that one year ago today, the effective federal funds rate was 3.08% vs. the current level of 5.33%. Given that monetary policy operates with a long and variable lag, we can calculate a 12-month spread of 2.25% as the amount of monetary tightening that hasn’t had a full impact on the economy and financial system yet. While this is merely an approximation, it’s a basic rule of thumb that we can apply in order to estimate how much monetary tightening is still coming down the pipeline. Quite simply, another +0.25% rate hike would be quite minimal relative to this 12-month spread.
Better yet, we can recognize that the various metrics of inflation on a YoY basis are all less than the current effective federal funds rate. This correctly implies that the Federal Reserve has achieved a positive real federal funds rate, which is likely to produce further strains on economic activity and inflation, based on the Keynesian model of economics. For example, take the comparison between the effective federal funds rate and the core CPI inflation rate on a YoY basis:
While the direct correlation implied by the Keynesian model isn’t perfect, I believe that the magnitude of monetary tightening over the past 18 months, the lag effects of said policy, and the fact that we have a positive real federal funds rate will continue to reduce inflationary pressures going forward.
Stock Market:
As I stated in the introduction, the S&P 500 has fallen more than -5% from the recent YTD peak in mid-July. Investors sentiment has completely deteriorated, with the market firmly in a position of fear, based on the Fear & Greed Index:
Is this warranted? Perhaps.
Is this rare or unique? Not at all.
In fact, the S&P 500 has experienced 125 individual drawdowns of -5% since 1950. On average, that’s roughly two -5% drawdowns per year. This current drawdown is officially the second -5% drawdown of 2023, which means that we’re perfectly aligned with the historical average data. The market is doing exactly what it’s done for the past 70+ years. Seasonality data adds to this perspective of normalcy, which we can measure in two different ways:
1. Average return per month: Given that September is the worst month of any month, the current weakness that we’re experiencing isn’t much of a surprise. Investors should be aware of the strong performance that typically ensues in Q4…

2. Pre-election year seasonality: Diving further into time-based correlations, pre-election years are notoriously strong for the stock market. However, the market composite measurement typically experiences choppiness and volatility starting in Q3 and ending in Q4. While we shouldn’t rely on this composite model precisely, it provides a “most likely” path for the market, which we have followed with some degree of consistency in 2023.

So far, we’re not seeing anything abnormal in the market…
September is historically a weak month. September has been a weak month.
Pre-election year seasonality implies choppiness. We’ve experienced chop.
The S&P 500 averages two -5% declines per year. We’ve had two -5% declines.
Again, everything we’re seeing right now is historically normal and within the middle of the bell curve of potential probabilities. Therefore, we shouldn’t be surprised.
Does that mean that we should abandon the need for risk management? No!
Historically, a decline of -5% leads to a total decline of -10% approximately 40% of the time. In the other 60% of cases, the S&P 500 goes on to make new all-time highs before reaching the -10% drawdown milestone. As Warren Pies from 3Fourteen Research describes in his analysis, the odds of a -5% decline materializing into a -10% decline increase during periods where the yield curve is inverted, which it currently is. During these inverted yield curve periods, a decline of -5% has a 53% probability of turning into a -10% decline.
While we shouldn’t rule out the possibility of a further decline, I am actually welcoming this current price action. In June, I suggested that the most bullish outcome for the stock market was a -5% to -10% decline, which you can read here.
Based on the current YTD highs, here’s what that scenario looks like:
The S&P 500 closed perfectly on the August 2022 highs, a key level from a structural perspective. Unquestionably, a breakdown below this green range would imply more weakness for the market; however, the -10% drawdown level would be a valid downside target, which is right around 4,150 for the index. If we suppose that the S&P 500 completes the decline to 4,150, it’s important to note that the index would still be up +8.1% YTD, basically matching its average calendar year return since WW2.
Once again, completely normal stock market behavior.
Bitcoin:
Meh, there’s nothing to say about Bitcoin right now so I won’t try to pull a rabbit out of a hat or waste your time.
Best,
Caleb Franzen
SPONSOR:
This edition was made possible by the support of MicroSectors, a financial services and investment company that creates an array of unique investment products and ETN’s. Their NYSE FANG+ products are the only one of their kind, allowing investors to gain exposure, leveraged/un-leveraged & direct/inverse, to the NYSE FANG+ Index.
They have a suite of products ranging from big banks, to oil & gas, and even gold & gold miners.
I started a partnership with MicroSectors in 2023 because I’ve been using their products for over a year and it was an organic and seamless fit.
Please follow their Twitter and check out their website to learn more about their services and the different products that they offer.
DISCLAIMER:
This report expresses the views of the author as of the date it was published, and are subject to change without notice. The author believes that the information, data, and charts contained within this report are accurate, but cannot guarantee the accuracy of such information.
The investment thesis, security analysis, risk appetite, and time frames expressed above are strictly those of the author and are not intended to be interpreted as financial advice. As such, market views covered in this publication are not to be considered investment advice and should be regarded as information only. The mention, discussion, and/or analysis of individual securities is not a solicitation or recommendation to buy, sell, or hold said security.
Each investor is responsible to conduct their own due diligence and to understand the risks associated with any information that is reviewed. The information contained herein does not constitute and shouldn’t be construed as a solicitation of advisory services. Consult a registered financial advisor and/or certified financial planner before making any investment decisions.
This report may not be copied, reproduced, republished or posted without the consent of Cubic Analytics and/or Caleb Franzen, without proper citation.
Please be advised that this report contains a third party paid advertisement and links to third party websites. These advertisements do not constitute endorsements and are not necessarily representative of the views or opinions of the newsletter author. The advertisement contained herein did not influence the market views, analysis, or commentary expressed above and Cubic Analytics maintains its independence and full control over all ideas, thoughts, and expressions above. The mention, discussion, and/or analysis of individual securities is not a solicitation or recommendation to buy, sell, or hold said security. All investments carry risks and past performance is not necessarily indicative of future results/returns.


It's rare when a financial analysis newsletter makes me laugh out loud, but I got to the Bitcoin section and couldn't help myself. Your Bitcoin analysis was spot-on, as always, but particularly this week. "Meh." There really isn't any other way to describe the current price action. LOL!