The Inflection Point Is Here
Analyzing PCE Inflation, Investor Sentiment, and Bitcoin Price Action
Investors,
The S&P 500 is trading at an inflection point with respect to key statistical indicators.
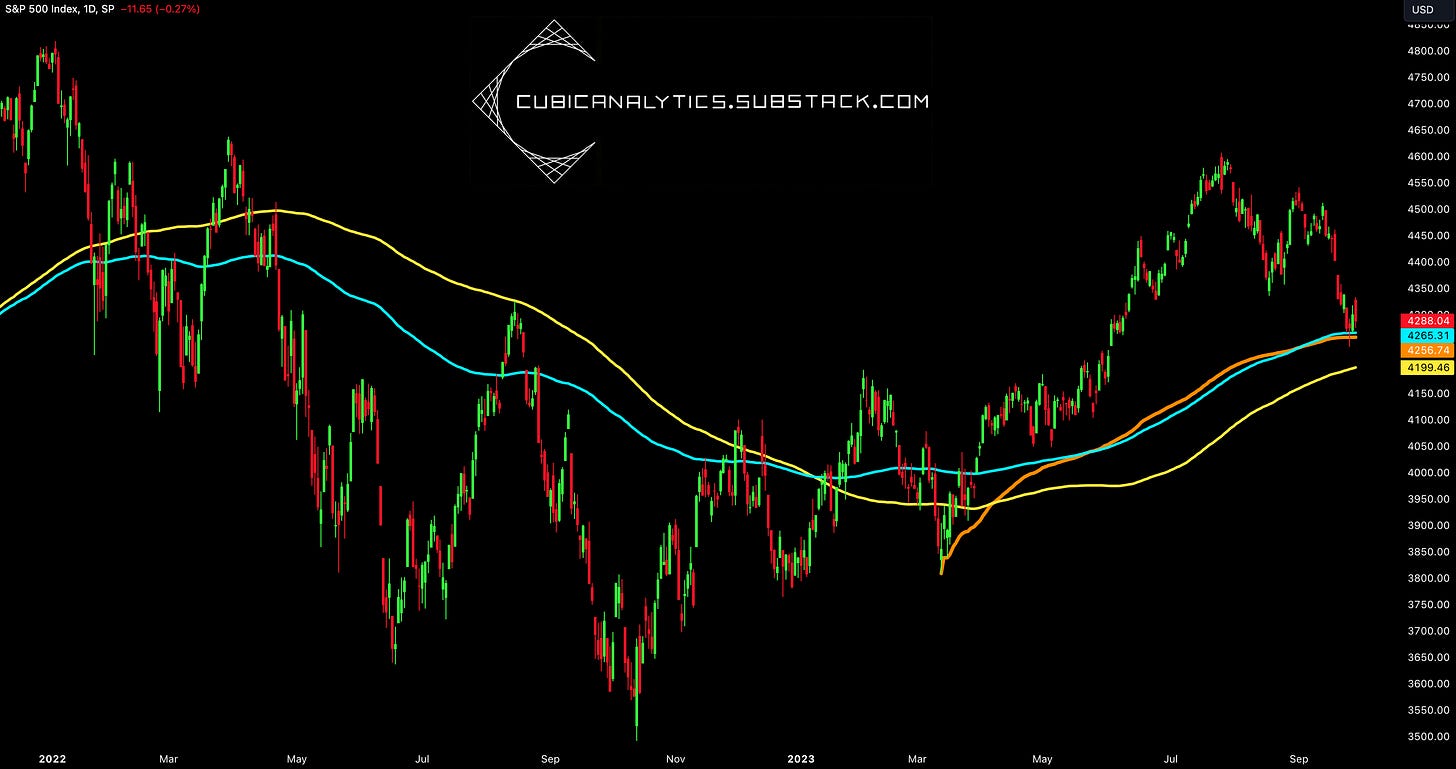
First and foremost, the 200-day moving average cloud was my downside target that I’ve been sharing for months, which was officially retested this past week. The 200-day moving average cloud is represented by:
🔵 200-day exponential moving average
🟡 200-day simple moving average
Rather than focusing on one vs. the other, my strategy is to create an entire dynamic support or resistance range based on the “cloud” created by these two indicators. While the S&P 500 could slip further into the cloud towards the lower-bound of the range, approximately 4,200 for the index, the current retest might be (key words) sufficient for support.
The second level that I’m focused on is the AVWAP (anchored volume-weighted average price) from the YTD lows that followed immediately after the banking crisis in March 2023. The AVWAP, shown in orange, is so important because it essentially shows us the cost basis of all investors who have bought the S&P 500 since mid-March 2023. Given that investors are emotional being who are tethered to their cost basis, this is an important tool to measure and track the price memory of any specific asset over a specific period of time.
As we can see from the chart above the AVWAP from the YTD lows is perfectly aligned with the 200-day EMA (teal), which was retested on Wednesday & Thursday this past week. While we tried to regain some upward momentum on Friday, there was a significant amount of intraday selling that caused the S&P 500 to reverse. While the index was up roughly +0.75% at one point on Friday, the index closed down -0.27% for the session and was down more than -0.5% at one point during the day.
The confluence of these statistical indicators is an encouraging sign that boosts the probability for this zone to act as support; however, nothing is promised or guaranteed in the market. Therefore, I think it’s vital for investors to be closely monitoring how the index reacts to this range in order to gauge who wins the battle.
It’s very possible, if not likely, that these statistical ranges serve as an inflection point or line-in-the-sand for bulls vs. bears.
Rebound = bulls win, increasing upside probabilities in the short-term.
Breakdown = bears win, increasing downside probabilities in the short-term.
Staying flexible & objective in this range will be key for both short and long-term investors alike, and I encourage all investors to stay attentive to how price reacts to this level in the days and weeks ahead.
Thankfully, MicroSectors has a variety of different investment products to benefit investors whichever direction the market goes via their inverse & direct ETN’s! Perhaps you believe the market will rebound exactly on this level and you want leveraged, high-beta exposure to technology stocks. Their 3x FANG & Innovation ETN ($BULZ) should warrant your attention — designed to create leveraged exposure to a basket of the following tech stocks:
Or perhaps you think that the S&P 500 will slice through this critical support zone and experience more downward pressure in the weeks/months ahead. In that case, technology stocks will likely experience even more downside than the broader market and MicroSectors’ -3x FANG & Innovation ETF ($BERZ) will be a beneficiary.
Without further ado, let’s jump into the key data & charts for the week across the three disciplines that we monitor on a daily basis:
Macroeconomics:
The most important economic release this week was the report for August’s Personal Consumption Expenditures (PCE), which the Federal Reserve uses as their preferred method for measuring inflation dynamics, specifically core PCE. To be clear, their 2% inflation target is not applied to the PCE, however, they heavily rely on the evolution of the PCE data to gauge how inflation is trending.
As far as I’m concerned, the latest round of PCE data is still showing disinflation.
With median estimates projecting for a YoY change of +3.5%, perfectly in-line with estimates of +3.5%. This was a modest acceleration vs. the July result of +3.4%; however, analysts have been expecting this uptick given the dynamics in the August CPI & PPI data that were released earlier this month.
On a month-over-month (MoM) basis, headline PCE increased by +0.4%, which was also in-line with analyst expectations. The headline data wasn’t a surprise, by definition of matching median estimates, but it wasn’t great at a surface-level given the modest uptick in both MoM & YoY figures. Still, the PCE data was a major win when we dive deeper into the data and take a more nuanced approach.
Here’s what I mean…
Core PCE, which is the Federal Reserve’s preferred measure that they place a more significant weight on, continued to decelerate in the August data. This matches the same evolution that we saw in the August CPI & PPI data, which I’ve discussed at length in prior editions of Cubic Analytics. Core PCE increased +3.9% YoY in August 2023, down from July’s result of +4.3%. In fact, this was the lowest YoY reading in core PCE since November 2021!
As we can see from the YoY evolution in core PCE, we’re witnessing rapid & substantial disinflation and a deceleration in the rate of price increases. While the existing level is still too high, we are certainly trending in the right direction in order to meet the Federal Reserve’s goal of taming inflation. Considering that the MoM increase in core PCE was +0.1% (below estimates & prior results), that’s a major win from the Federal Reserve’s perspective.
If we look at another component for PCE Services, which actually includes energy services, we also see clear evidence of disinflation! Again, the +4.9% increase in August is still too high, but trending in the right direction & showing a deceleration.
My favorite chart from the August PCE data is below, showing the YoY rate of change for the trimmed-mean PCE inflation, which decelerated from +4.18% YoY in July to +3.89% in August.
Considering that the YoY trimmed-mean PCE was +4.95% in August 2022, I think this is a massive win amidst calls from Team Inflation that PCE has been sticky.
As a final note on PCE dynamics, it’s important to monitor how short-term trends are evolving to give even more context to YoY measurements. The data below from the Wall Street Journal’s Nick Timiraos is extremely valuable, showing the 3-month & 6-month annualized trends relative to the YoY evolution in core PCE:
All three metrics decelerated in August vs. their respective results in July.
Again, this confirms that disinflation is still in effect and I continue to reiterate my conviction that disinflationary pressures will persist in the months ahead, and likely through the first half of 2024. My conviction is strengthened by the ongoing deceleration in credit creation from commercial banks in the United States, which has continued to decelerate since my prediction in February 2023:
For those who understand the mechanics of the Federal Reserve’s monetary tightening & easing cycles, this chart provides vital context about the Fed’s balance sheet dynamics. More specifically, how bank reserve assets (influenced by QE and QT) are evolving into credit creation, which is what actually “prints money”. If you believe, as I do, that inflation is a monetary phenomenon, this deceleration in credit creation is telling us that inflation itself will continue to decelerate with a lag.
Stock Market:
Based on the statistical dynamics that we reviewed in the intro, it’s important to recognize that equities are likely at an inflection point that will determine market direction for the remainder of the year. As I alluded to, the blueprint is simple:
Breakdown = headwinds for equities are likely
Rebound & remain above = tailwinds for equities are likely
Aside from this key point, I also wanted to address two stock market developments:
1. Valuations have become more attractive on a fundamental basis:
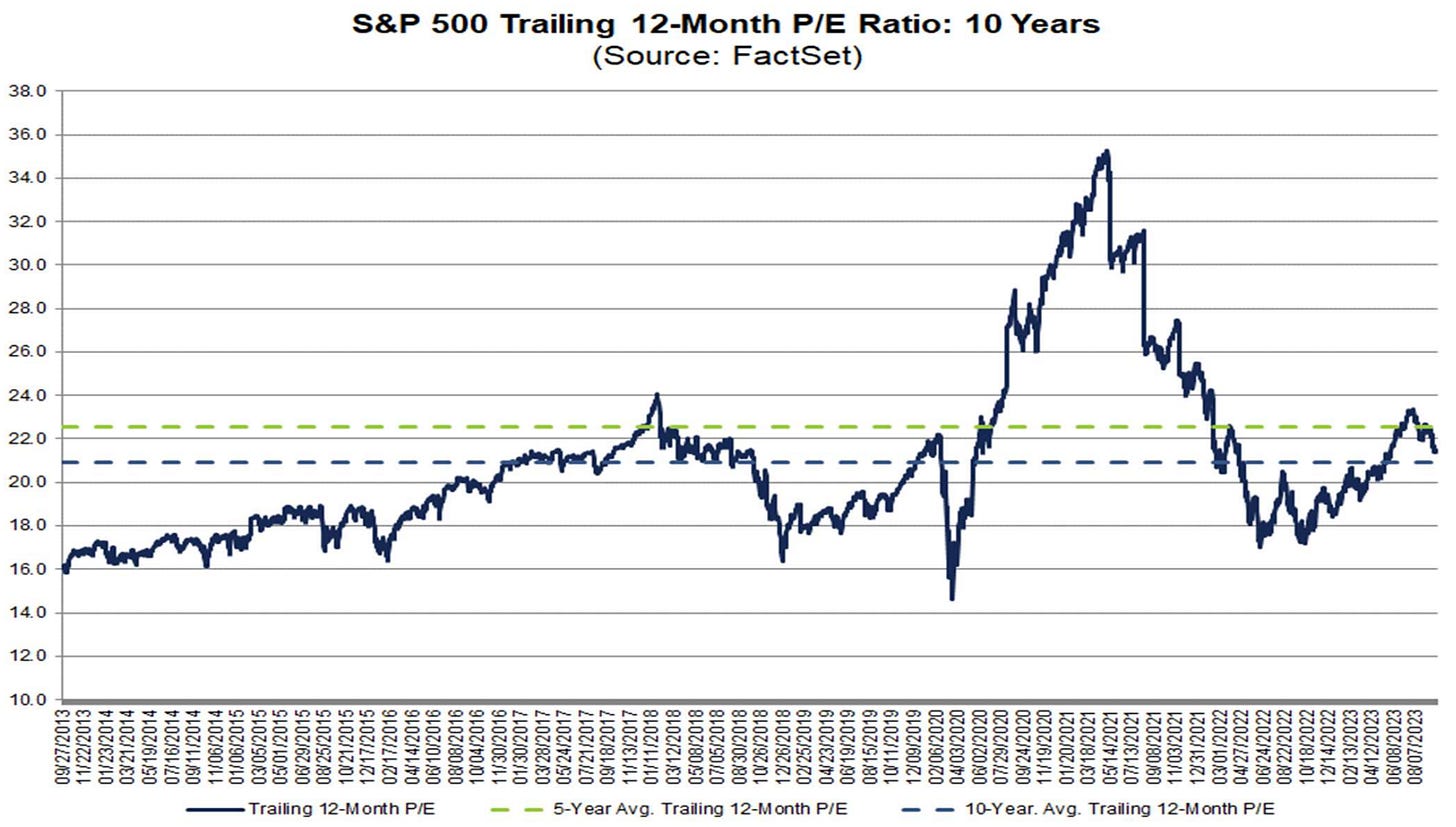
On September 23, FactSet published an updated report on S&P 500 earnings data, which includes important data about valuations. Specifically, the data clearly shows that valuations are in-line with historical averages and are actually becoming “cheap” relative to the 5Y trend when analyzing the trailing 12M price/earnings ratio:
While the index is slightly more expensive relative to the 10Y average, the data suggests that valuations, on the aggregate, are not exorbitant and that investors are paying average multiples for equities. We can even take this a step further by looking at more forward-looking fundamentals like the 12M-forward EPS:
Given that equities are priced, in part, on the future expectation of earnings, this chart shows that the stock market is priced nearly perfectly based on the current expectation of future earnings! Perhaps the argument could be made that future expectations are too optimistic, but the same argument could be made that they’re too pessimistic! The fact of the matter is, we don’t know what the next year entails for earnings and we must rely on the aggregate opinion of market participants and forward-guidance provided by companies in their earnings reports. Based on this analysis, it’s apparent that equities are fairly priced in the current environment.
2. Sentiment & positioning are reaching extremely bearish levels:
Analyzing sentiment & positioning data in tandem is useful because it allows us to gauge how investors are feeling about market dynamics and fundamentals, while ensuring that these investors are putting their money where their mouth is. Together, these measurements can provide powerful contrarian signals when they reach extreme levels. Regarding sentiment, the Fear & Greed Index is deep within the “Fear” category and even hit “Extreme Fear” recently:
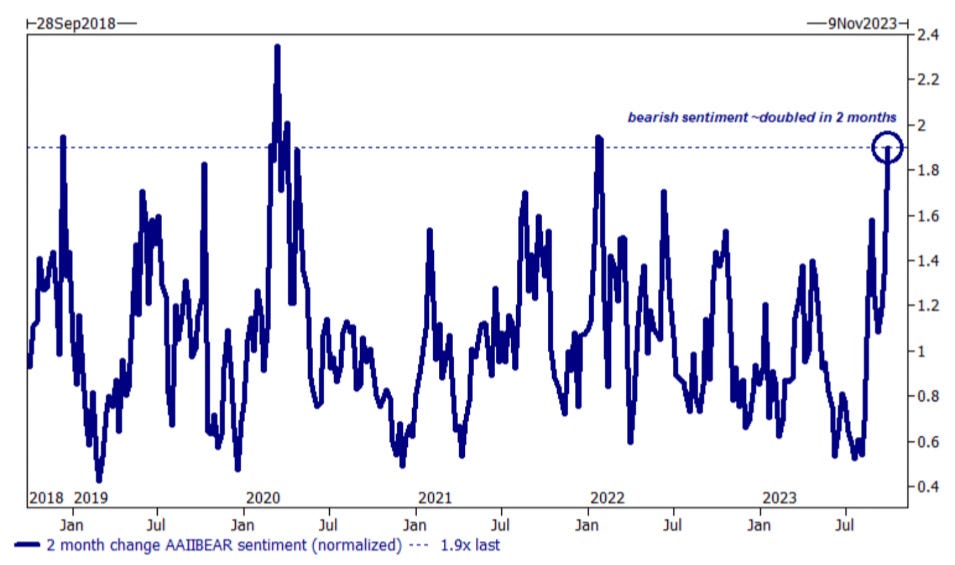
Based on the investor sentiment I’m seeing on Twitter/X, it’s clear that we’ve entered an “enthusiasm capitulation”, which is the term I created last year to describe the overwhelming deterioration of investor sentiment. According to data from Goldman Sachs, the 2-month change in sentiment has become significantly bearish.

So what about positioning? Well, it’s quite bearish as well!
The put/call ratio, which measures the amount of bearish vs. bullish bets on the stock market, reached its highest levels of 2023 on Wednesday, September 27th.
Investors have significantly transitioned towards bearish positioning, though not quite at extreme levels over a long-term basis. In combination with overwhelmingly bearish sentiment (which could certainly deteriorate even further), we can conclude that the “pain trade” is higher and would require short bets to be covered & squeezed.
Bitcoin:
I remain cautious about the price action of Bitcoin in this environment, as I have since we fell below the 200-day moving average cloud in mid-August 2023. Since then, I’ve been pointing out how the MA cloud has the potential to act as resistance, and that’s exactly what’s taken place:
As price retests this range once again as dynamic resistance, I encourage all investors to pay attention to how price reacts at this level.
🔵 200-day EMA =$26,952
🟡 200-day SMA =$28,006
🟠 Bitcoin price = $26,937
I can’t guarantee that prices will get rejected here, but I do know that we should all be paying attention to see if a trend shift can occur via a breakout. That would be a massive hint that we could be re-entering another bullish phase of price action.
Until then, I’ll remain cautious.
Additionally, the short-term holder realized price is currently $27,736:
My rule of thumb here is very simple:
When BTC > STHRP, good things tend to happen.
When BTC < STHRP, bad things tend to happen.
To re-establish the bull case on a short-term basis, I’m going to need to see the price of Bitcoin break above the 200-day moving average cloud and the STHRP. Ideally, the STHRP would also develop a positive & rising slope.
Best,
Caleb Franzen
SPONSOR:
This edition was made possible by the support of MicroSectors, a financial services and investment company that creates an array of unique investment products and ETN’s. Their NYSE FANG+ products are the only one of their kind, allowing investors to gain exposure, leveraged/un-leveraged & direct/inverse, to the NYSE FANG+ Index.
They have a suite of products ranging from big banks, to oil & gas, and even gold & gold miners.
I started a partnership with MicroSectors in 2023 because I’ve been using their products for over a year and it was an organic and seamless fit.
Please follow their Twitter and check out their website to learn more about their services and the different products that they offer.
DISCLAIMER:
This report expresses the views of the author as of the date it was published, and are subject to change without notice. The author believes that the information, data, and charts contained within this report are accurate, but cannot guarantee the accuracy of such information.
The investment thesis, security analysis, risk appetite, and time frames expressed above are strictly those of the author and are not intended to be interpreted as financial advice. As such, market views covered in this publication are not to be considered investment advice and should be regarded as information only. The mention, discussion, and/or analysis of individual securities is not a solicitation or recommendation to buy, sell, or hold said security.
Each investor is responsible to conduct their own due diligence and to understand the risks associated with any information that is reviewed. The information contained herein does not constitute and shouldn’t be construed as a solicitation of advisory services. Consult a registered financial advisor and/or certified financial planner before making any investment decisions.
This report may not be copied, reproduced, republished or posted without the consent of Cubic Analytics and/or Caleb Franzen, without proper citation.
Please be advised that this report contains a third party paid advertisement and links to third party websites. These advertisements do not constitute endorsements and are not necessarily representative of the views or opinions of the newsletter author. The advertisement contained herein did not influence the market views, analysis, or commentary expressed above and Cubic Analytics maintains its independence and full control over all ideas, thoughts, and expressions above. The mention, discussion, and/or analysis of individual securities is not a solicitation or recommendation to buy, sell, or hold said security. All investments carry risks and past performance is not necessarily indicative of future results/returns.


