The Great Non-Recession
Investors,
Welcome to the Great Non-Recession.
The inevitable recession that everyone forecasted at the end of 2022 is nowhere in sight, and in fact, the labor market, the consumer, and the broader U.S. economy are stronger than even the most optimistic analysts predicted.
After I first acknowledged that soft-landing probabilities were rising in Nov.’22, I was still skeptical that we could avoid a recession until the immediate aftermath of the Silicon Valley Bank collapse in Q1’23. Since then, I’ve done my best to champion the resilient aspects of both the fundamental economy and the stock market itself. As someone who entered 2023 predicting a recession, I was forced to acknowledge the reality that a recession could be avoided and that the Federal Reserve might pull this thing off.
I analyzed the data, reviewed the weight of the evidence, acknowledged that the market is a forward-looking pricing mechanism, and I changed my mind.
The same way that I went from Team Inflation in May 2021 to Team Sticky Inflation in early 2022 to Team Disinflation in December 2022.
The economy evolves.
The market evolves.
Analysts should evolve.
Maybe I’ll change my mind again in the coming months/quarters, but here’s the situation right now (and the the one that’s existed for 12+ months):
Immaculate disinflation is intact
The labor market is resilient & dynamic
Real economic activity is growing (and accelerating)
The housing market has stayed strong, despite activity plummeting
The manufacturing sector is showing signs of improvement
The service sector remains tough to crack
The consumer is consuming
Combine all of these factors and couple it with the fact that the U.S. stock market is trading at all-time highs and I think we have a conclusion:
Welcome to the Great Non-Recession.
Recent economic data reaffirms that these trends are intact, and my plan is to review some of these dynamics in this report. This will be a unique edition of Cubic Analytics, where I’ll only be focusing on macro in order to highlight the key data that suggests we’re in a Great Non-Recession.
If you’d like access to my updated analysis on the stock market & Bitcoin, consider upgrading your membership to premium and keep an eye out for tomorrow’s report.
Those premium reports are published every single Sunday, exclusive for paid members of Cubic Analytics, in addition to an array of benefits like our weekly investor calls. In those reports, I also share all of the investment actions that I take during the week, with screenshots of buy/sell orders. This information is only available for monthly or annual members, so I’d love to welcome you to the team whenever you’re ready!
As always, these Saturday reports will continue to be completely free!
Let’s begin!
Macroeconomics:
The resilient nature of the economy within a disinflationary environment was reaffirmed this week, with the release of the Q4 2023 GDP data and the Personal Consumption Expenditures inflation data.
Starting with GDP, the reported figure was that real GDP grew at an annualized pace of +3.3% in Q4 2023. This was significantly higher than the estimate of +2.0%, though it came in below the strong growth in Q3’23 of +4.9%.
It’s important to note that these figures are calculated by taking the quarterly growth rate and then compounding it four times in order to calculate the projected 1-year growth.
I don’t prioritize the annualized data and instead prefer to measure the YoY rate of change because it actually encapsulates the full 4-quarter trend. If/when I do measure analyzed data, I do it to reaffirm the trends that I’m seeing in YoY figures. To be clear, I don’t throw away the annualized data, but I don’t prioritize it over the YoY figures.
Therefore, while the quarterly annualized growth rate decelerated in Q4’23 relative to Q3’23, the year-over-year rate of growth actually accelerated from +2.9% to +3.1% YoY!
Not only does this provide a smoother result, but it actually describes the past in order for us to review how economic data evolved in 2023. Again, despite most folks calling for a recession in 2023 and many of them still being stuck with that perception, the inflation-adjusted economy grew at a pace of +3.3% in 2023, dramatically stronger than the +0.65% real GDP growth rate in 2022.
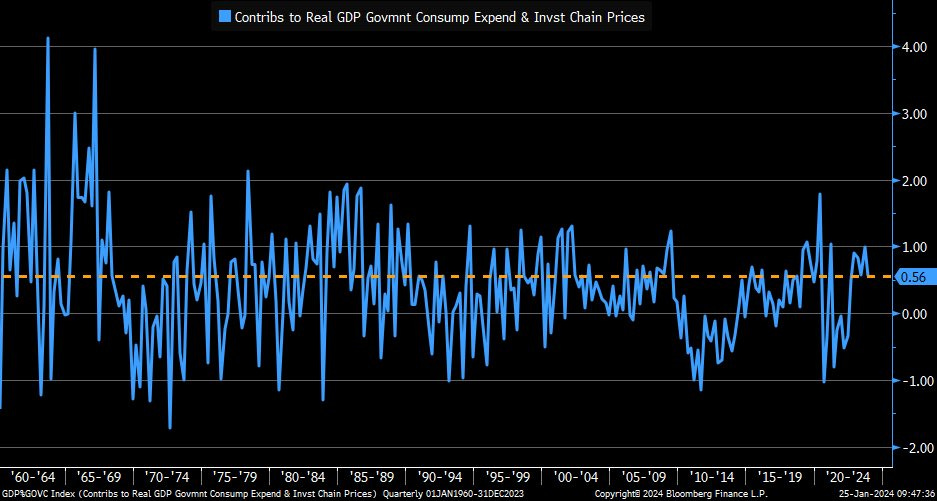
To add to the good news, we can see that government’s contribution to GDP growth in Q4 actually decreased relative to the contribution in Q3, showing how the private sector picked up the slack and acted as the engine for growth.
If we deduct government’s contribution to GDP growth, the other components of the real economy grew at an aggregate pace of +2.74% (annualized). This helps to highlight just how strong the private-sector is, but should we be surprised given the resilience of the labor market and the consumer?
Nope.
If the labor market continues to flex, then incomes will continue to be strong, and consumers will continue to be the driving engine behind economic growth.
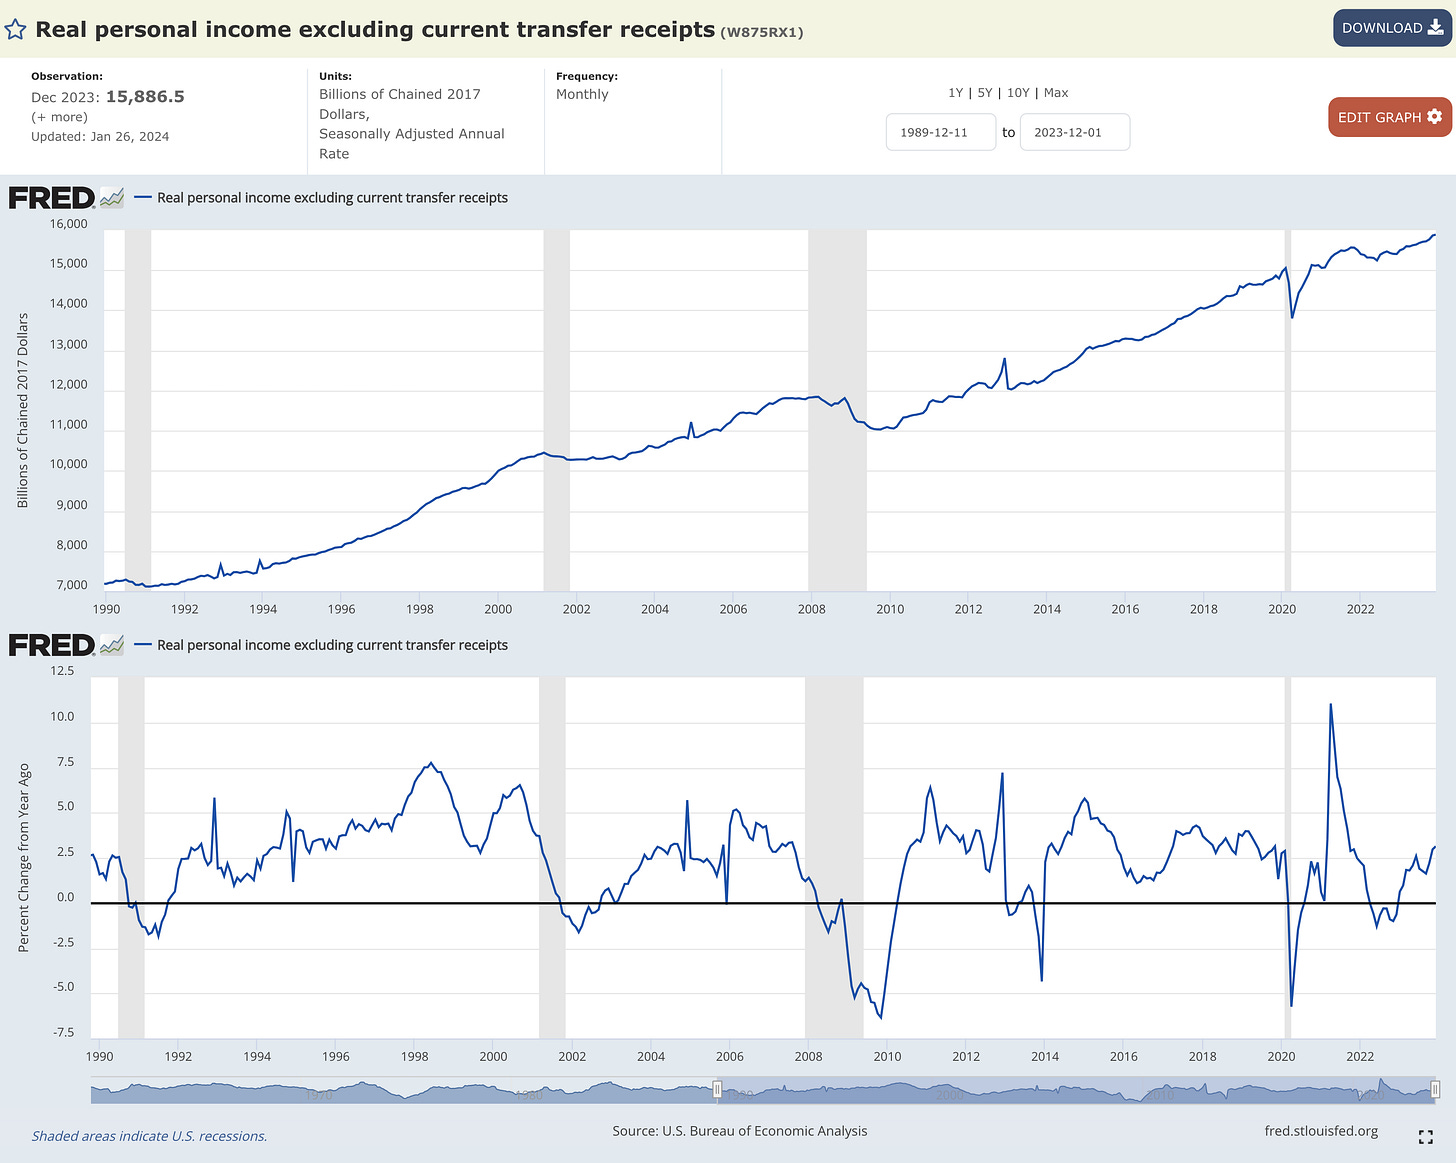
Analyzing real incomes and excluding government transfer payments (like unemployment benefits or social security), we can paint a clear picture for how real incomes are doing. In the chart below, I’m showing:
Top: the total amount of real income ex-transfer payments
Bottom: the YoY rate of change in real incomes ex-transfer payments
The takeaway: not only are real incomes hitting new all-time highs ($15.886Tn), but they are also accelerating higher since the trough in June 2022, now growing at a pace of +3.14% YoY.
If real personal income excluding government transfer payments are rising, how could we be in a recession? It’s just simply not true. In fact, if you look at the bottom-pane chart above, you can see that real personal income ex-transfer payment only starts to re-accelerate again after the recession ends.
Given that we didn’t have a recession in 2021, 2022, or 2023, and real incomes are accelerating for 18 consecutive months, it’s likely the case that the economy will continue to be resilient & dynamic in the months & quarters ahead.
There’s one final datapoint that I want to highlight from the Q4’23 GDP data, known as the “deflator”. This deflator is the piece that bridges the difference between nominal GDP and real GDP, as it attempts to encapsulate how the price of goods and services changed within the quarter. Therefore, we can use the deflator as an alternative metric of inflation, helping to confirm the trends that we’re seeing in the Consumer Price Index (CPI)!
The deflator in Q4’23 was +2.6% YoY, down from +3.2% in Q3’23 and from +6.4% Q4’22.
This continues to provide unquestionable confirmation of disinflation, arguably the most important macro trend that I’ve been highlighting for the past 12+ months.
Thankfully, we also received the Personal Consumption Expenditures data for December on Friday, which also confirms that immaculate disinflation is intact.
Headline PCE increased at a pace of +2.59%, down slightly from +2.63% in the prior month and in-line with estimates for +2.6%. Meanwhile, core PCE increased at a pace of +2.93%, down from +3.15% in the prior month and below estimates of +3.0%.
This was a fantastic result, which is important because the core PCE datapoint is the Federal Reserve’s preferred method of measuring inflation. In other words, so long as we continue to see disinflation in core PCE, the Fed is getting closer and closer to achieving their target and taking their foot off of the monetary tightening gas pedal.
In addition to the YoY figures above, I also decided to calculate the quarterly annualized rates of change in both headline & core PCE (similar to how the real GDP growth data is reported).
The result was astounding…
On an annualized basis, Q4 headline PCE grew at +0.5% and core PCE grew at +1.5%.
The PCE inflation rate for both metrics have returned back to their normal ranges from the post-Great Recession period, unquestionably confirming that the Fed has defeated the inflationary spike from 2021 and 2022. While I recognize that this is annualized data, it’s vital to recognize the trend of the data and that it’s rapidly moving towards outright deflation. On top of that, it continues to confirm what we’re seeing in the YoY data across a variety of different inflation metrics.
Disinflation is intact. It’s been intact. It will continue to be intact.
If anything, the potential for deflation by the end of 2024 is rising — which, could be incredibly bullish if it’s coupled with a non-Keynesian increase in economic activity.
As the risk of deflation rises, the Fed will have a high degree of motivation to cut rates because they still view the economy through a Keynesian lens, in which inflation and growth are directly correlated.
Finally, I want to share a few miscellaneous macro charts in rapid-fire fashion:
Initial unemployment claims jumped higher to 214k vs. 189k prior. Nonetheless, the 4-week moving average of initial claims continued to inch lower.
The Flash Purchasing Managers Index (PMI) data was published for January 2024, in which the results came in much better than anticipated.
Services: 52.9 vs. estimates of 51.2
Manufacturing: 50.3 vs. estimates of 47.6
Composite: 52.3 vs. estimates of 51.0
The manufacturing sector, which has generally been a weak spot in the U.S. economy made a thrust into expansionary territory. With the PMI data, it’s important to remember that a reading above 50 indicates an expansion while a reading below 50 indicates a contraction.
With all three components (services, manufacturing, and composite) all in contractionary territory, this is a fantastic sign, though it’s important to acknowledge that it’s the preliminary data and not wholly representative of what the final results for January 2024 will be.
Within the PMI data, we also received their updated Output Prices Index, which had a sharp decline! This is important because there’s a strong correlation with inflation, which therefore indicates that more disinflation is coming down the pipeline.
As a final note, I decided to look deeper into the manufacturing sector…
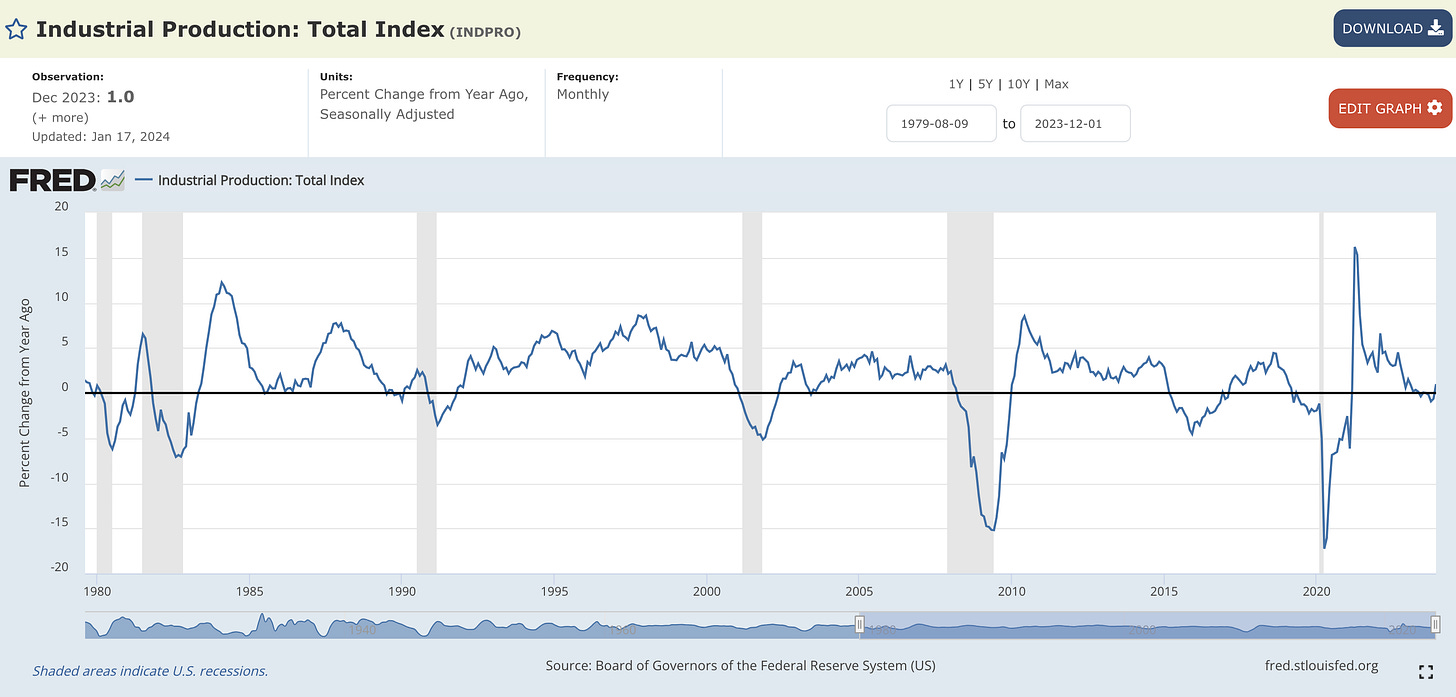
First & foremost, industrial production has generally been trending sideways for the better part of this century. It typically experiences sharp declines during recessions and then it gradually rises in the aftermath of the economic contraction, and then stabilizes.
The reality of the situation is that industrial production has been treading water for the past two years, but we can also contextualize this trend by analyzing the YoY rate of change in the index:
This shows us that industrial production actually increased by +1.0% in 2023!
We’ll need to confirm that this data continues to re-accelerate in the months ahead, but this looks like a fantastic sign to suggest that the manufacturing sector is doing better than the PMI data indicates.
As I said in the into, welcome to the Great Non-Recession.
Best,
Caleb Franzen
DISCLAIMER:
This report expresses the views of the author as of the date it was published, and are subject to change without notice. The author believes that the information, data, and charts contained within this report are accurate, but cannot guarantee the accuracy of such information.
The investment thesis, security analysis, risk appetite, & timeframes expressed above are strictly those of the author and are not intended to be interpreted as financial advice. As such, market views covered in this publication are not to be considered investment advice and should be regarded as information only. The mention, discussion, and/or analysis of individual securities is not a solicitation or recommendation to buy, sell, or hold said security.
Each investor is responsible to conduct their own due diligence and to understand the risks associated with any information that is reviewed. The information contained herein does not constitute and shouldn’t be construed as a solicitation of advisory services. Consult a registered financial advisor and/or certified financial planner before making any investment decisions.


