The Fed's Tightrope
Investors,
The Federal Reserve is walking a tightrope, which I’ll explain in this macro report.
But first, Bitcoin is currently retesting a key support indicator that I created using ChatGPT several weeks ago, building on my favorite indicator, the 200-day moving average cloud. Specifically, this indicator tracks the 200-day SMA and creates a buffer range with a ±2 standard deviation band of the 50-day SMA.
It sounds like complex math, but I promise it’s straight forward.
Just look at the chart/indicator:
The indicator worked perfectly as:
Resistance in November 2022
Resistance in December 2022
Support in March 2023
Support in June 2023
Both support & resistance in August - October 2023
Support (so far) in the ongoing market consolidation
Breakdowns or breakouts (like in Jan.’23) signal inflection points in the trend
But the chart above only highlights the effectiveness of the indicator over the past 20 months, so how has it performed on a more long-term basis?
Extremely well.
The indicator worked perfectly as support in the 2012/13 bull market, the 2016/17 bull market and even in the 2020/21 bull market, with breakdown representing an end in the uptrend and a shift into a bear market regime. It also worked as resistance in the 2014/15 bear market, the 2018 bear market, and also the 2022 bear market.
Therefore, as we look at this objective evidence, we must accept some basic facts:
This is a key level of interest to monitor right now, with a range of $61.4k-$58.6k.
This is a potential support zone, based on historical behavior.
A breakdown at this range would warrant a defensive, if not bearish, posture.
Earlier in the week, when Bitcoin was trading at $66k, I outlined several levels where I would be interested in buying more BTC at lower prices based on different indicators.
Now that we’re trading within those ranges, I’ve been allocating again.
I even bought more BTCL 0.00%↑ in my Roth IRA on Friday, adding leveraged exposure in a tax-advantaged manner. I’m super proud to have the REX Shares team sponsoring this edition of Cubic Analytics, which has been a seamless partnership due to my natural interest in buying a leveraged spot Bitcoin ETF, rather than the other futures-based leveraged products on the market.
Irrespective of what your outlook is on Bitcoin, they have a leveraged product to fit your directional bias and I’d encourage you to read more about their products here.
Macroeconomics:
This report will be very macro heavy, because macro continues to drive markets and we continue to inch closer to an inflection point in monetary policy.
Specifically, I’m going to cover two topics:
The FOMC meeting, Powell’s press conference, and the timing of rate cuts.
Recent labor market data
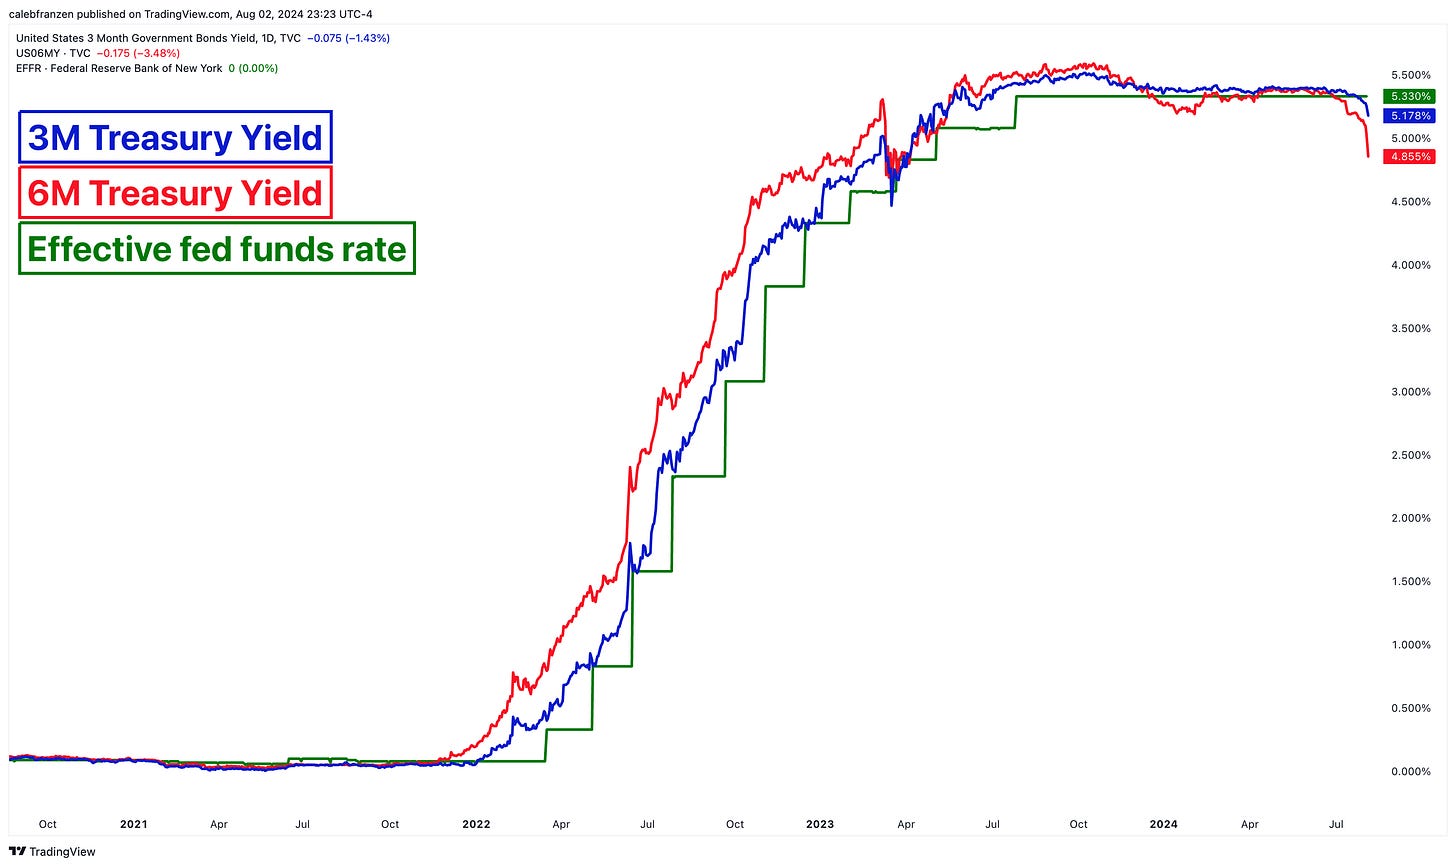
The quick summary is the following: The Federal Reserve is likely to cut in September, followed by additional cuts in the remaining meetings this year, which is now being confirmed for the first time by the 6M Treasury yield. Labor market data is softening, which has become a more prominent aspect of the Fed’s dual-mandate, which will simply accelerate the timing (and magnitude) of rate cuts; however, broader macro data is still resilient. Personally, I felt that the concerns from this week’s data were overstated and that the market overreacted to the data, fearing that a recession is right around the corner.
But let’s talk about the details and get nuanced…
The FOMC policy decision was exactly as expected, another pause at 5.25%-5.50%.
We’re now officially 12 months removed from the Fed’s last rate hike, which occurred in July 2023, a period in which the S&P 500 has gained +21% between YoY meetings.
Powell’s most important quote from the press conference was the following:
“If the economy remains solid and inflation persists, we can maintain the current target range for the federal funds rate for as long as appropriate. If the labor market were to weaken unexpectedly, or inflation were to fall more quickly than anticipated, we’re prepared to respond. Policy is well-positioned to deal with the risks and uncertainties that we face in pursuing both sides of our dual-mandate.”
He referred several times to the fact that “risks have come into better balance”, referring to how they adjust their reaction function and prioritize labor market data vs. inflation data to meet their dual-mandate.
In plain English, the Fed is becoming less concerned about inflation and more concerned about the labor market… but again, we’ve known this for some time.
At the time of the press conference, I was relatively dismissive of the idea that the Fed would move forward with a cut in September, though Powell did say that a cut in the September meeting could be on the table if certain conditions around inflation, the labor market, and the broader economy warranted such a cut.
The signal that I was looking for was a sufficient decline in both the 3M and the 6M Treasury yield, which have now fallen to specific levels that are signaling a cut at the next meeting in September 2024.
I wrote about this extensively on X, which you can read here, but the gist is that both yields have officially signaled that a cut is coming for the first time since the rate hike cycle began in March 2022.
While the 2Y Treasury yield, the CME FedWatch tool, fed funds futures, and SWAPs have incorrectly forecasted rate cuts several times over the past 18+ months, the 3M and 6M yield are officially saying that cuts are coming for the first time.
These two yields have been the most effective signals and my belief is that their current signal is worth paying attention to, knowing that they are dynamic indicators and could reflect a different picture (or larger magnitude) in the coming days, weeks, and months ahead.
It’s why I pay attention to the 3M & 6M Treasury yield every day — they are dynamic!
Baseline, right now, my expectation is that the Fed will cut at least twice in the remainder of 2024, and that one cut might be a 0.5% cut.
If my view changes, based on data, then I will update this group of investors here and on X with a full explanation to support my new outlook.
The primary reason for the significant decline in yields this week was softer-than-expected labor market & broader macroeconomic data.
In my view, overall data remains resilient & dynamic, but it’s clearly softening.
Overall, this has been my base case for the year.
The Federal Reserve and the U.S. economy are walking the tightrope, balancing between softness on one side and outright deterioration on the other. Yet at the same time, other economic datapoints are showing a clear acceleration, like the Q2’24 real GDP data that we reviewed last week. The issue is that the Q2’24 real GDP data is 1-3 months old, providing a backward-looking view of the past rather than necessarily telling us where we’re going.
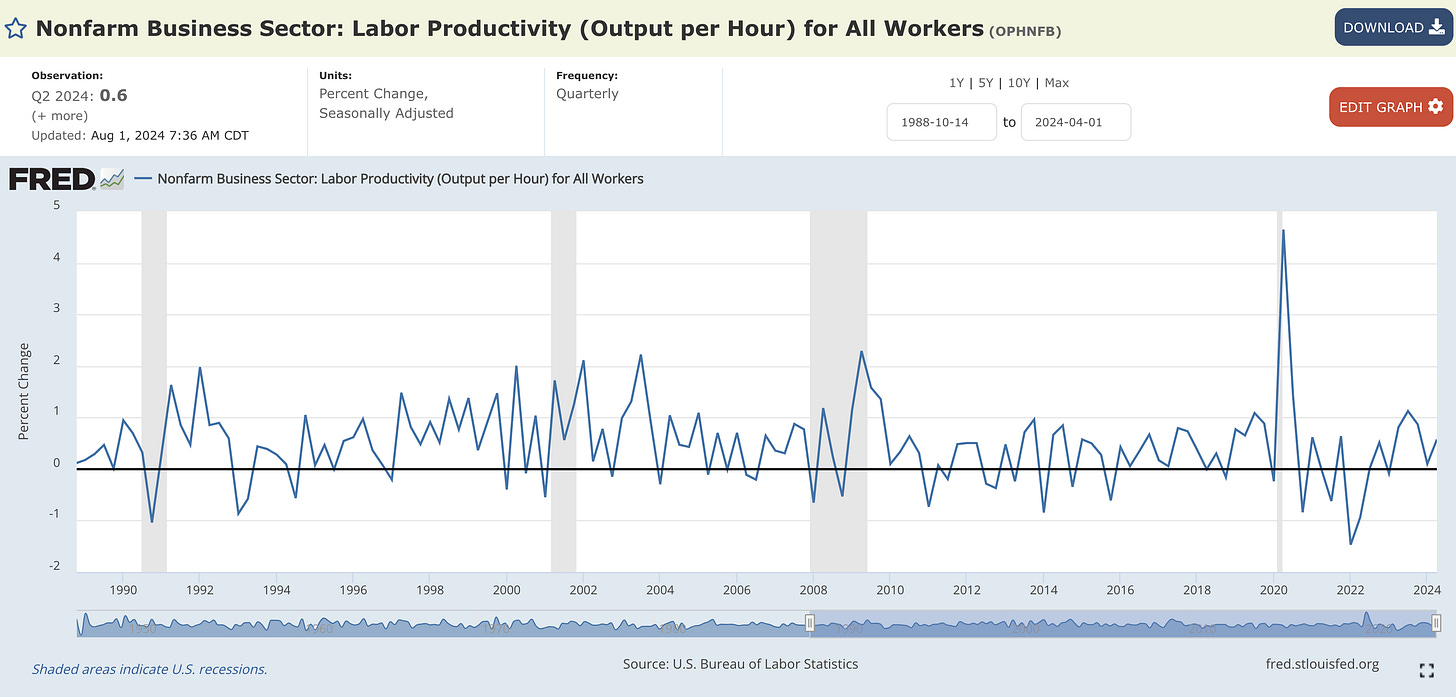
Even the labor productivity data that we received on Thursday was for Q2, which did show a markedly strong improvement, but it’s old data at this point.
Along the tightrope, the acrobat will occasionally swing from one side to the other.
So far, that’s what the Fed and the economy have done for the past 2+ years when the rate hike cycle began in March 2022.
We’ve had bad data.
We’ve had good data.
We’ve had weakening data.
We’ve had strengthening data.
But the Fed has been able to stay on the rope.
The issue is, how much further does the Fed need to walk on the rope in order to safely get to the other side and officially achieve their dual-mandate?
Unfortunately, we don’t know, but that’s why it’s necessary to constantly evaluate the conditions in the labor market and the economy.
Turning to the labor market, we had three key reports this week:
ADP Private Payrolls
Job Openings and Labor Turnover Survey (JOLTS)
Nonfarm Payrolls (NFP)
Regarding the ADP data, private payrolls added 122,000 jobs in July, reaching a new all-time high in U.S. private employment.
Payroll gains were seen in every size category, except for firms with 20-49 employees:
Regarding wage growth measurements from ADP, job stayers experienced median wage growth of +4.8% YoY while job switchers had wage growth of +7.2% YoY, both of which decelerated vs. the prior month results. This deceleration in wage growth was also evident in the nonfarm payroll data, which we’ll address further below.
Overall, this was solid data. With ADP being the largest payroll processor in the world (and therefore the United States), they provide keen insights on the status of the labor market and continue to provide evidence that private payrolls are growing.
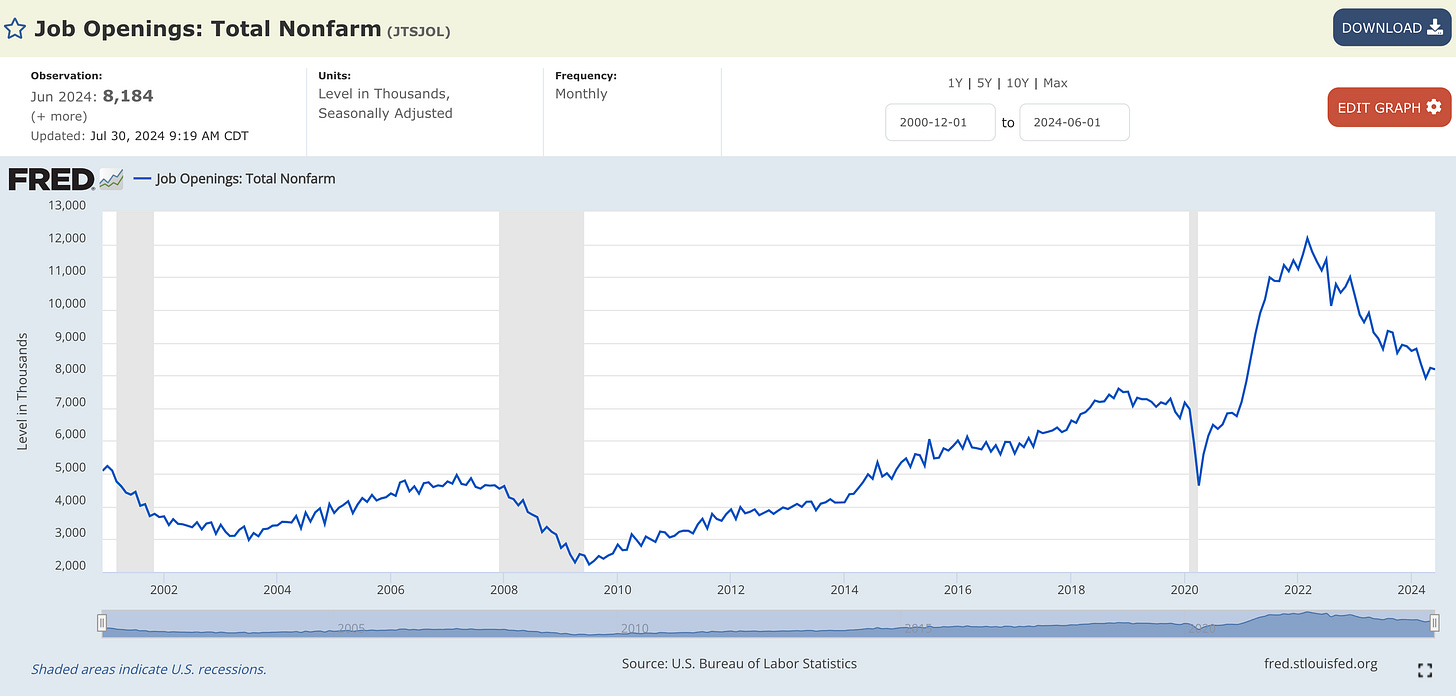
Job openings from the June 2024 JOLTS data moderately ticked lower, chopping around in a downtrend since the peak in March 2022.
This is important for a few reasons, but most notably because job openings has a direct correlation with YoY inflation data:
🔵 Job openings (JOLTS)
🔴 Core CPI inflation YoY
The most important data from the JOLTS report was the layoffs figure, which decreased during the month of June to 1.498M. This number seems quite large, but it’s necessary to provide some context by comparing it to the size of total employees!
In doing so, we see that the layoffs rate is 0.94%, the lowest reading since April 2022!
Yes, you read that right.
Less than 1% of employees were fired in the month of June.
This is lower than the pre-Pandemic level, which was 1.18% in December 2019.
It’s also lower than it was in June 2023 at 1.02%.
This is critically important context, which is required to develop a nuanced & thorough understanding of labor market conditions, which continue to imply that the headline figures aren’t as dire as pundits are making you believe.
Additionally, the private quits rate from the JOLTS data also decreased, which has strong disinflationary implications in the months & quarters ahead, which will in turn help to shape monetary policy and usher in rate cuts.
🔵 Quits rate (JOLTS)
🔴 Core CPI inflation YoY
So the ADP & JOLTS data both indicate that the labor market is both resilient & dynamic, but softening moderately. In no way are these bad reports or indicative of recessionary dynamics, but both of these reports are much less significant than the nonfarm payroll data that we received on Friday, which is the most important labor market report of the economic news cycle.
Expectations were for NFP to show +185k jobs created, however, the result came in at a disappointing level of +114k in July. The June figure, which had initially been reported at +206k jobs, was revised lower to +179k, still showing strong growth.
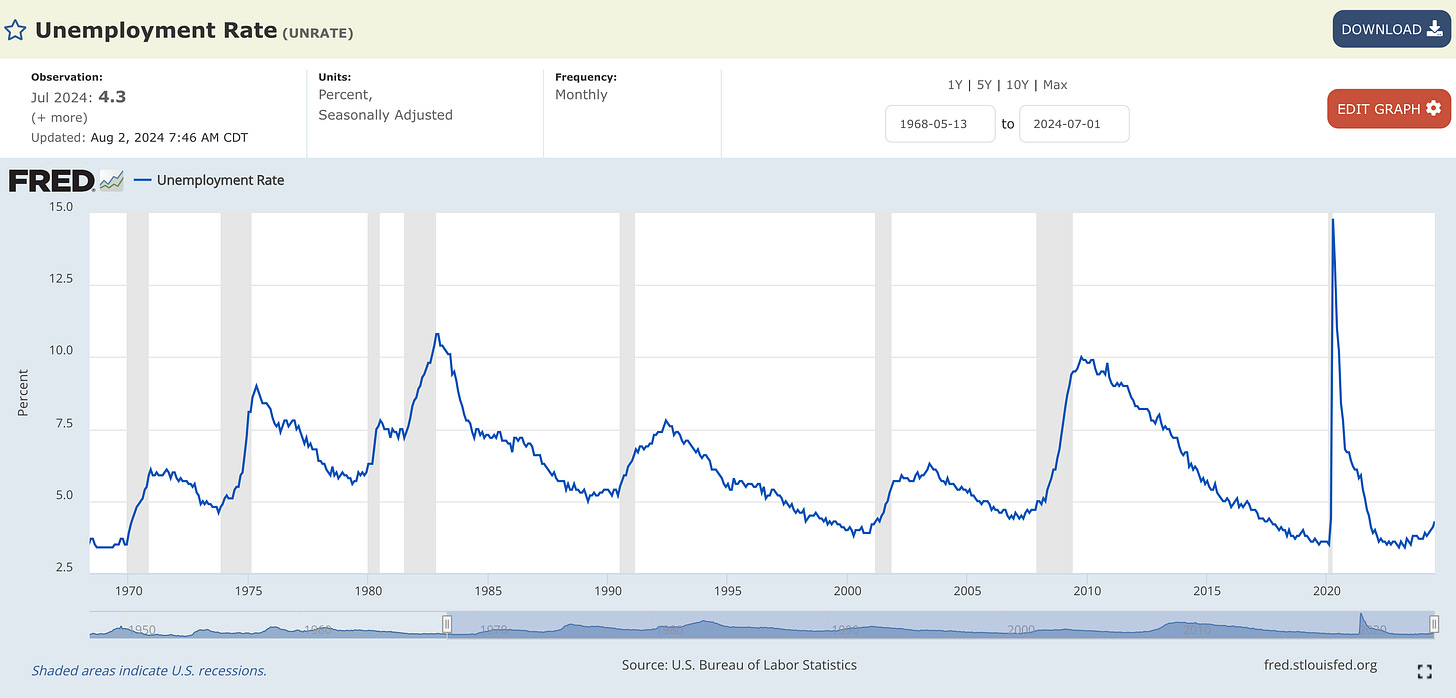
The part that really caught the attention of the market was the unemployment rate, which drastically increased from 4.1% to 4.25%.
In recent months, I’ve talked about how the rise in the unemployment rate can largely be explained by the simultaneous increase in the labor force participation rate. In summary, discouraged workers (who aren’t previously counted as unemployed) rejoin the labor force and begin looking for work, they are officially counted as unemployed.
The same dynamic took place again in July, with the prime-age labor force participation rate rising to the highest levels since March 2002 at 84.0%. I wrote about this extensively on X, which you can read here.
Unquestionably, the rise in the unemployment rate is a concern.
I’m not dismissing it.
However, this is vital context that needs to be accepted in order to properly understand what’s happening in the labor market, and the fact of the matter is that the unemployment rate is rising because more people are joining the labor force and starting to look for work.
I also want to highlight the nominal wage growth figure, which came in at +4.1% YoY.
Similar to the deceleration in median wages from the ADP data, this deceleration helps to foreshadow more disinflation in the months & quarters ahead:
🔵 Average hourly earnings YoY
🔴 Core CPI inflation YoY
So as we think about the Fed’s reaction function and the fact that Powell has repeatedly highlighted how “risks are coming into better balance” with respect to their dual-mandate, this latest round of data shows the following:
Softness in the labor market will produce more disinflation.
Softness in the labor market & more disinflation will prompt the Fed to cut.
This was, without question, the softest NFP data that we’ve seen in a long time, but it doesn’t necessarily indicate that an impending economic collapse is around the corner.
However, as I’ve said in the past, softness does not necessarily equal weakness.
Based on the aggregate data, I’m hard-pressed to say that the macro data is weak, but I will unequivocally agree that it’s softening, which has been my base case all year. As far as I can tell, we’re undergoing a normalization process in the labor market, which could have negative effects on the broader economy in the months/quarters ahead.
To me, this stresses the importance of staying data-dependent, flexible, and objective.
So that’s exactly what I’m going to do, here on Substack and on X.
In tomorrow’s report, I’ll be giving a full breakdown of ongoing dynamics in the stock market and Bitcoin in order to help keep investors on the right side of the trend.
Best,
Caleb Franzen,
Founder of Cubic Analytics
This was a free edition of Cubic Analytics, a publication that I write independently and send out to 10,000+ investors every Saturday. Feel free to share this post!
To support my work as an independent analyst and access even more exclusive & in-depth research on the markets, consider upgrading to a premium membership with either a monthly or annual plan using the link below:
SPONSOR:
This edition was made possible by the support of REX Shares, a financial services and investment company that creates an array of unique investment products and ETN’s.
I first collaborated with the REX Shares team in 2023 because I’ve been using their products as trading vehicles since 2022 and it was an organic & seamless fit. They have a unique product-suite, ranging from leveraged products, to inverse products, and income-generating products.
Please follow their Twitter and check out their website to learn more about their services and the different products that they offer.
DISCLAIMER:
This report expresses the views of the author as of the date it was published, and are subject to change without notice. The author believes that the information, data, and charts contained within this report are accurate, but cannot guarantee the accuracy of such information.
The investment thesis, security analysis, risk appetite, and time frames expressed above are strictly those of the author and are not intended to be interpreted as financial advice. As such, market views covered in this publication are not to be considered investment advice and should be regarded as information only. The mention, discussion, and/or analysis of individual securities is not a solicitation or recommendation to buy, sell, or hold said security.
Each investor is responsible to conduct their own due diligence and to understand the risks associated with any information that is reviewed. The information contained herein does not constitute and shouldn’t be construed as a solicitation of advisory services. Consult a registered financial advisor and/or certified financial planner before making any investment decisions.
Please be advised that this report contains a third party paid advertisement and links to third party websites. The advertisement contained herein did not influence the market views, analysis, or commentary expressed above and Cubic Analytics maintains its independence and full control over all ideas, thoughts, and expressions above. The mention, discussion, and/or analysis of individual securities is not a solicitation or recommendation to buy, sell, or hold said security. All investments carry risks and past performance is not necessarily indicative of future results/returns.
Each investor is responsible to understand the investment risks of the market & individual securities, which is subjective and will also vary in terms of magnitude and duration.


Excellent report, sir!
Hello, you mentioned some very important points that may not be seen at first glance, thank you for this good article. If possible, I would be grateful to know your opinion about the weakness in the ISM data, because in my opinion, they were much more visible in most dimensions.