Investors,
Like the U.S. economy, the stock market continues to be resilient & dynamic.
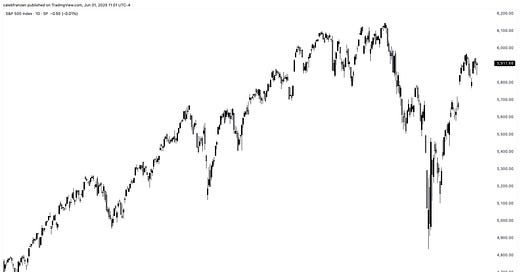
The S&P 500 has managed to rally +22.3% from the lows on April 7, 2025, and has exceeded even the most grandiose expectations that even the biggest bulls had.
Thankfully, despite being bearish in both March and April, I had quantitative signals flash at the beginning of May that told me to flip bullish. So that’s exactly what I did and those signals have proven to be right, once again.
Regardless of market direction, this is the power of dynamic indicators.
They allow you to capitalize on the trend, whatever the trend might be.
Yes, trends can change (as we’ve seen since April).
That’s why it’s vital for investors to be willing to adjust and modify their stance, using statistical indicators and objective truth to their advantage.
So right here, right now, I want to share this piece of free alpha with you…
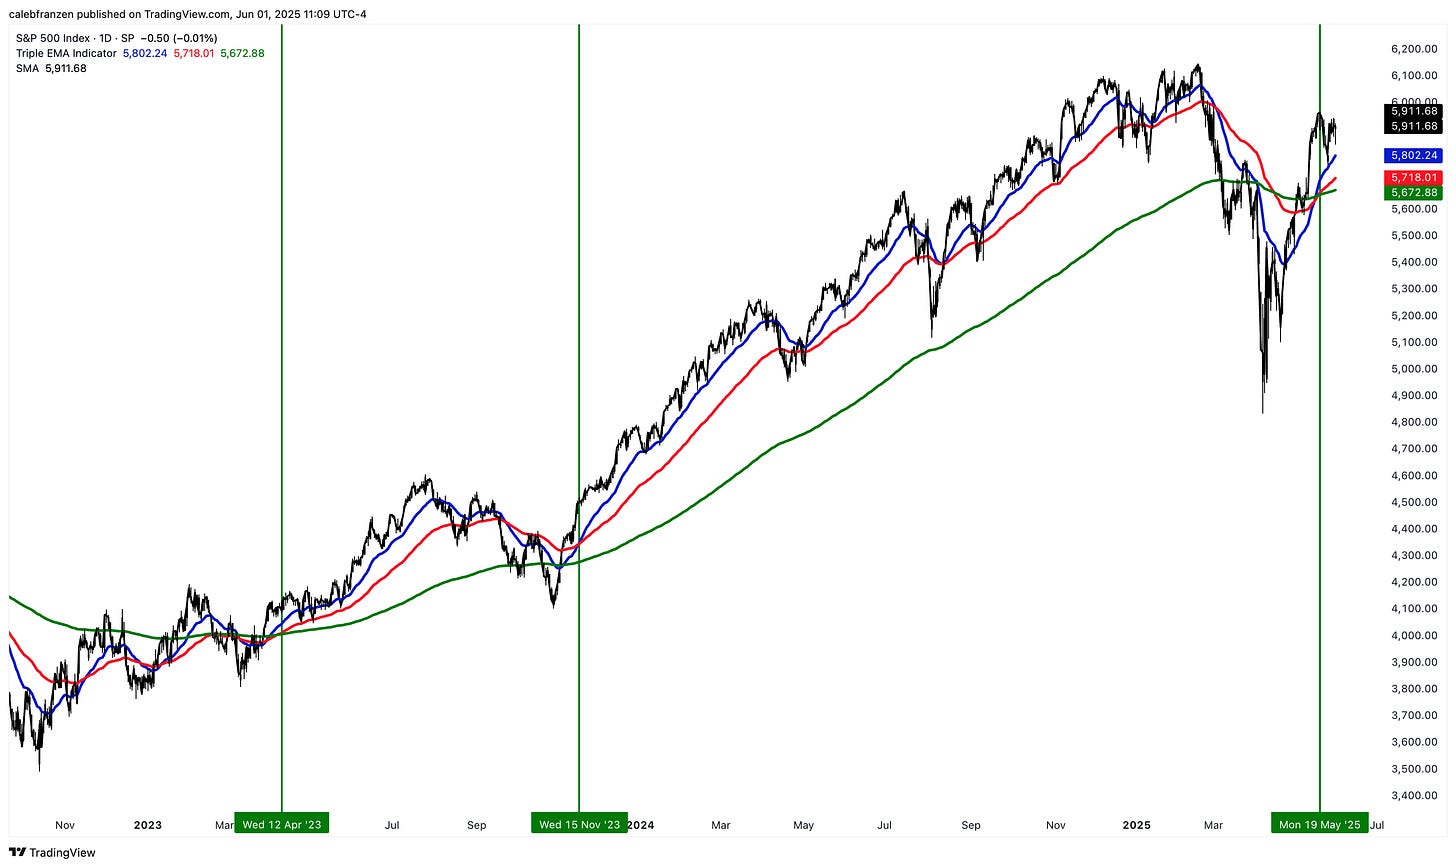
The S&P 500 is currently trading above its upward sloping EMAs and each of those EMAs are in a bullish formation:
🔵 21-day EMA
🔴 55-day EMA
🟢 200-day EMA
When I say the EMAs are in a “bullish formation”, I mean that the following is true:
🔵 > 🔴 > 🟢
Here are the last two times that this has occurred since 2022:
Be objective.
Embrace the nuance.
Were these prior signals emblematic of uptrends or downtrends?
Hint: they were emblematic of uptrends.
Were these prior signals effective as a meaningful bullish indicator?
Hint: they were highly effective.
So is this current signal, which flashed just a few weeks ago, worth listening to?
In my view, absolutely!
But here’s where we need to embrace nuance…
I recognize that the market doesn’t operate in a vacuum where statistics are the only thing that matters. The reality is that the market will do whatever it wants, whenever it wants, regardless of what we want it to do or what we think it will do.
Knowing that the market can give a middle finger to this analysis, here’s how we can embrace nuance and follow the data in the current environment:
So long as the S&P 500 stays above its 200-day EMA, we can have a bullish stance.
If/when the S&P 500 falls below its 200-day EMA, we can flip into a bearish stance.
It’s really that simple.
Now, using this data, we can position ourselves accordingly, whatever the market does.
But here’s where it could get even more interesting…


