Investors,
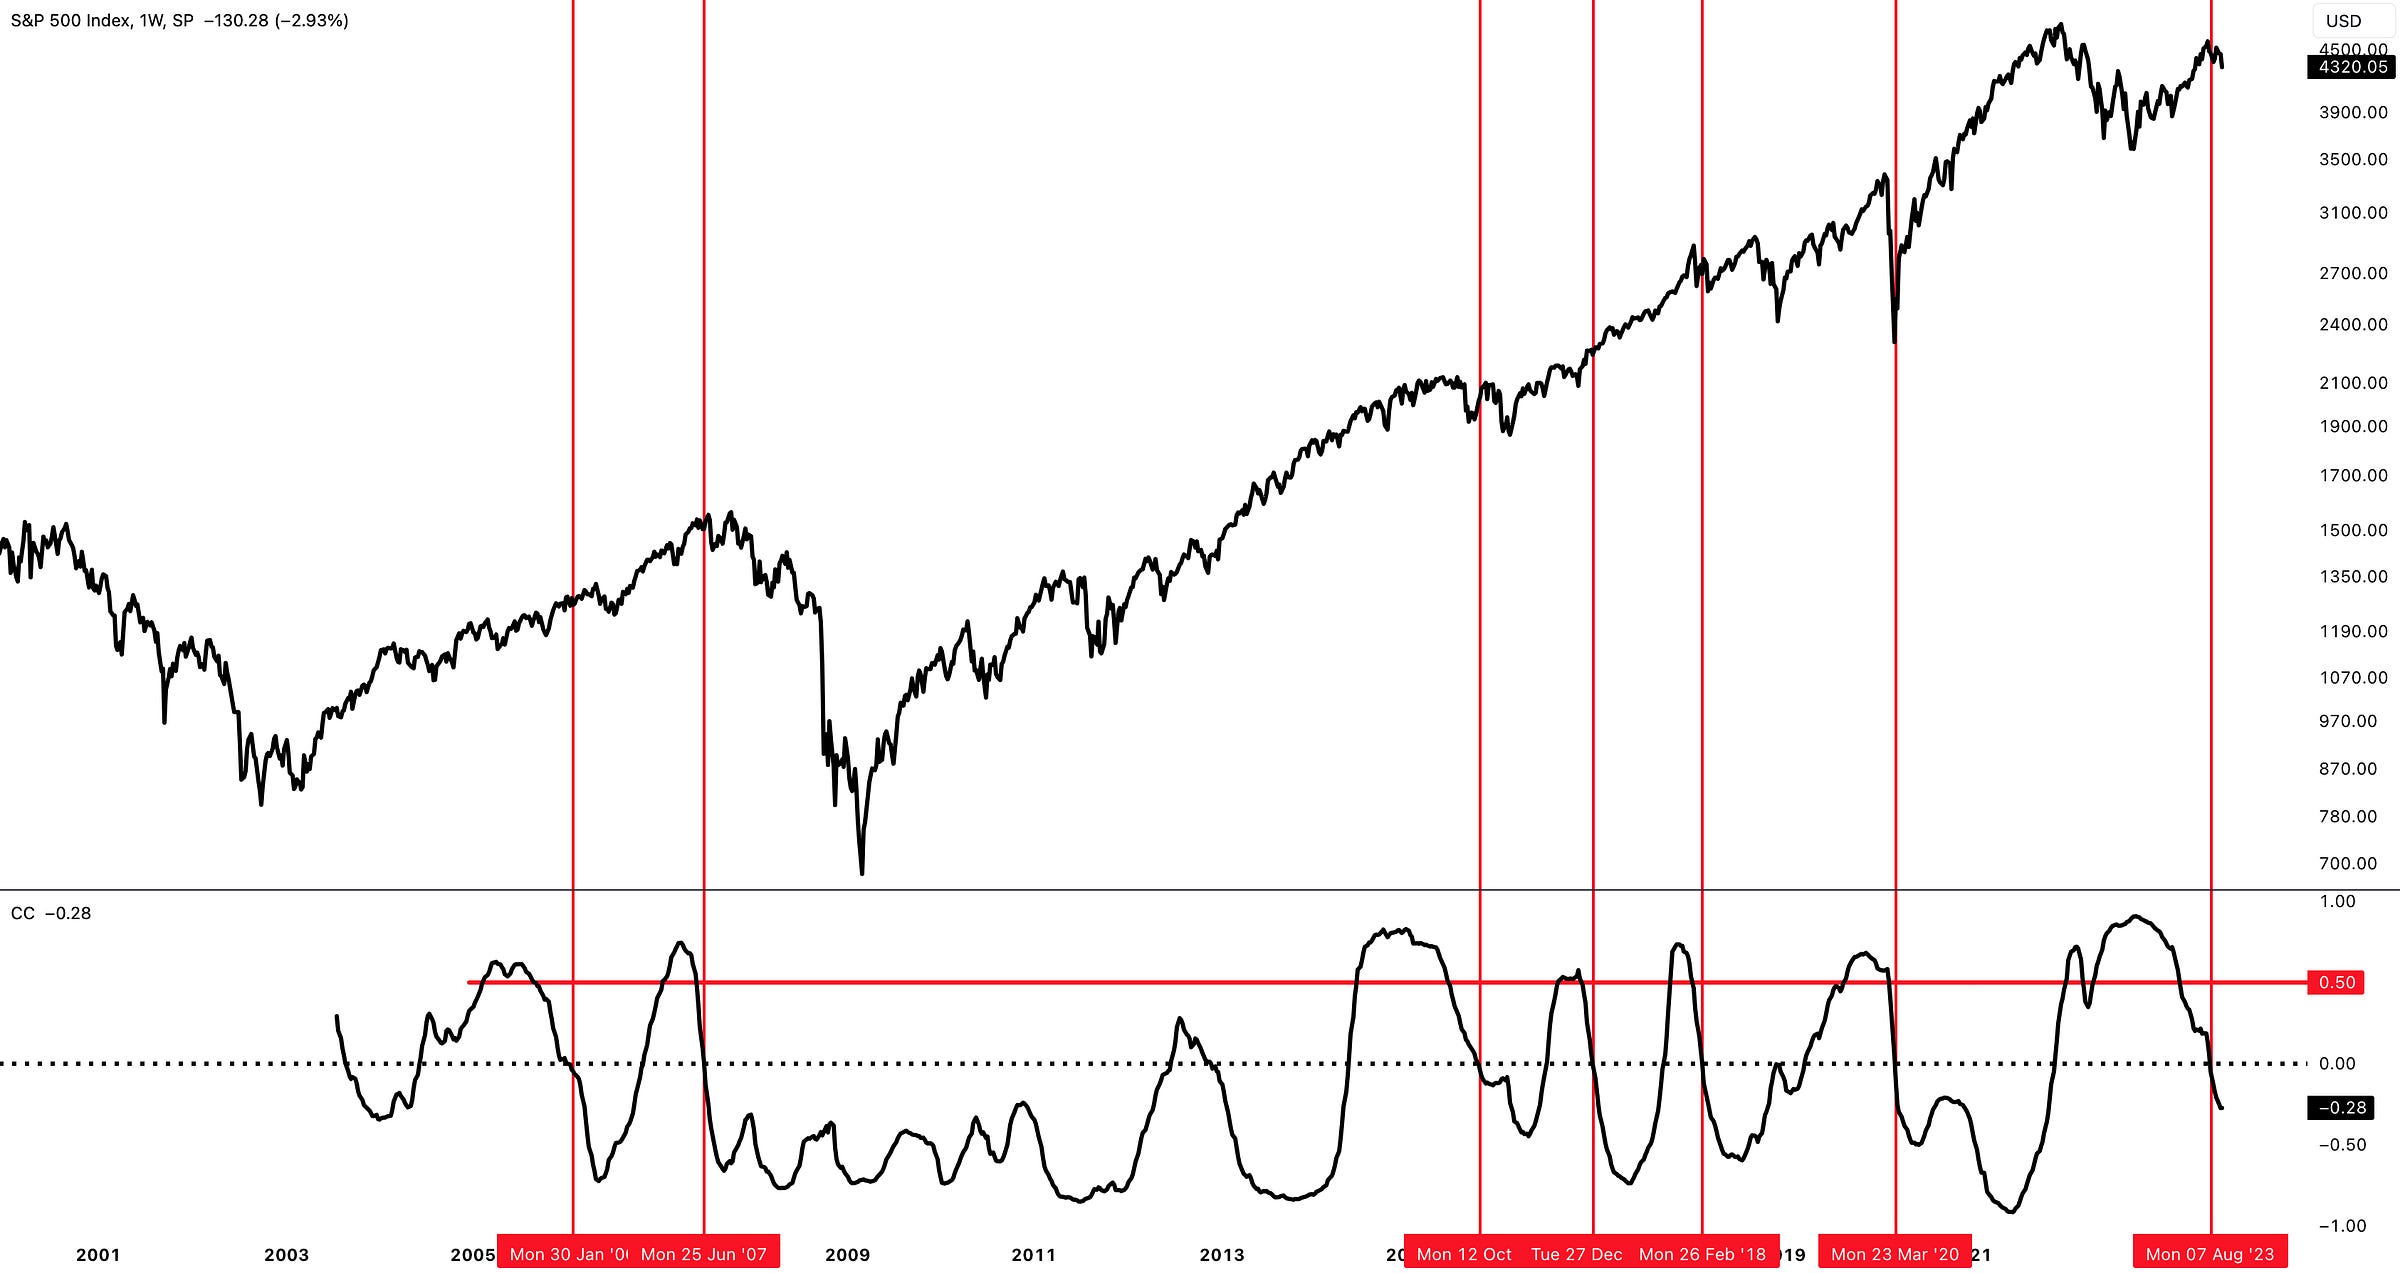
The 1-year correlation between stocks & bonds is plummeting.
Last year, the 1Y correlation between the S&P 500 & the 20+ Year Treasury ETF ($TLT) reached an all-time high of 91% in October 2022.
Today, the 1Y correlation stands at -28%.
This kind of precipitous drop & reversal was so surprising to me that I decided to investigate. The goal was to see how common this type of behavior is and whether or not there are any major implications for future returns. I conducted a simple study, highlighting all of the occasions where the correlation between the S&P 500 did the following: correlation > 50% followed by correlation < 0%.
It turns out, this has only happened six prior times before this seventh occurrence. While this study is inherently limited because of the fact that the TLT fund was launched in 2002, the forward-looking return table is below:
Forward returns appear strong at a surface level, but require us to dig deeper once we realize that the data is being skewed by 2 highly abnormal signals:
June 2007 (just before the Great Financial Crisis)
March 2020 (the COVID lows)
Both of these signals are influencing the study in opposite directions, with the pre-GFC signal reducing forward returns and the COVID signal boosting forward returns.
Interestingly, we can also interpret this as the signal having a 33% chance (2/6) of forecasting extreme market conditions, in either direction. It’s a very limited sample size, I’m aware, but we have to work with the cards that we’re dealt with.
Personally, I think we’re closer to a recession than an economic boom, so I am putting more weight on the ex-COVID signal data. On average, forward-looking returns for the non-COVID signals (bottom row) are extremely poor. With a 1-year average return of +5.6%, that’s significantly lower than the S&P 500’s average calendar year return of roughly +9% since WW2. Shockingly, the 2Y return is even worse at +3.5%!
I’ll need to think deeper about why the declining correlation is so important, but it’s clear that the forward-looking returns (albeit from a small sample) are underwhelming. Based on this study alone, the implication is that we should reduce our expectations for returns over the next three years. However, we should never base future return expectations on a single study, so this is merely one component that we can add to our outlook, amidst an array of market data & signals.
In the remainder of this premium report, I’ll be covering:
S&P 500 under-the-hood metrics for trend identification
S&P 500 DCA buying strategy based on technical analysis
My latest purchases and my long-term portfolio construction
Let’s begin.


