


Putting My Money Where My Mouth Is

Investors,
Over the past 6 months, I’ve focused on two philosophical themes as an investor:
Less is more — don’t overtrade or make emotional decisions
Late and right is better than early and potentially wrong
In the heart of the market’s chaos in mid-April, I shared an exclusive study for premium members of Cubic Analytics that aligned with these two themes. At the time, the market was in a downtrend and I believed that the lows weren’t in.
However, I was open to the idea that the lows could be in… I just wanted to see proof.
The intention of the study was to have an invalidation criteria for the downtrend & an objective methodology to flip bullish, based on key statistical indicators.
This is the study that I created and shared with premium members, with two criteria:
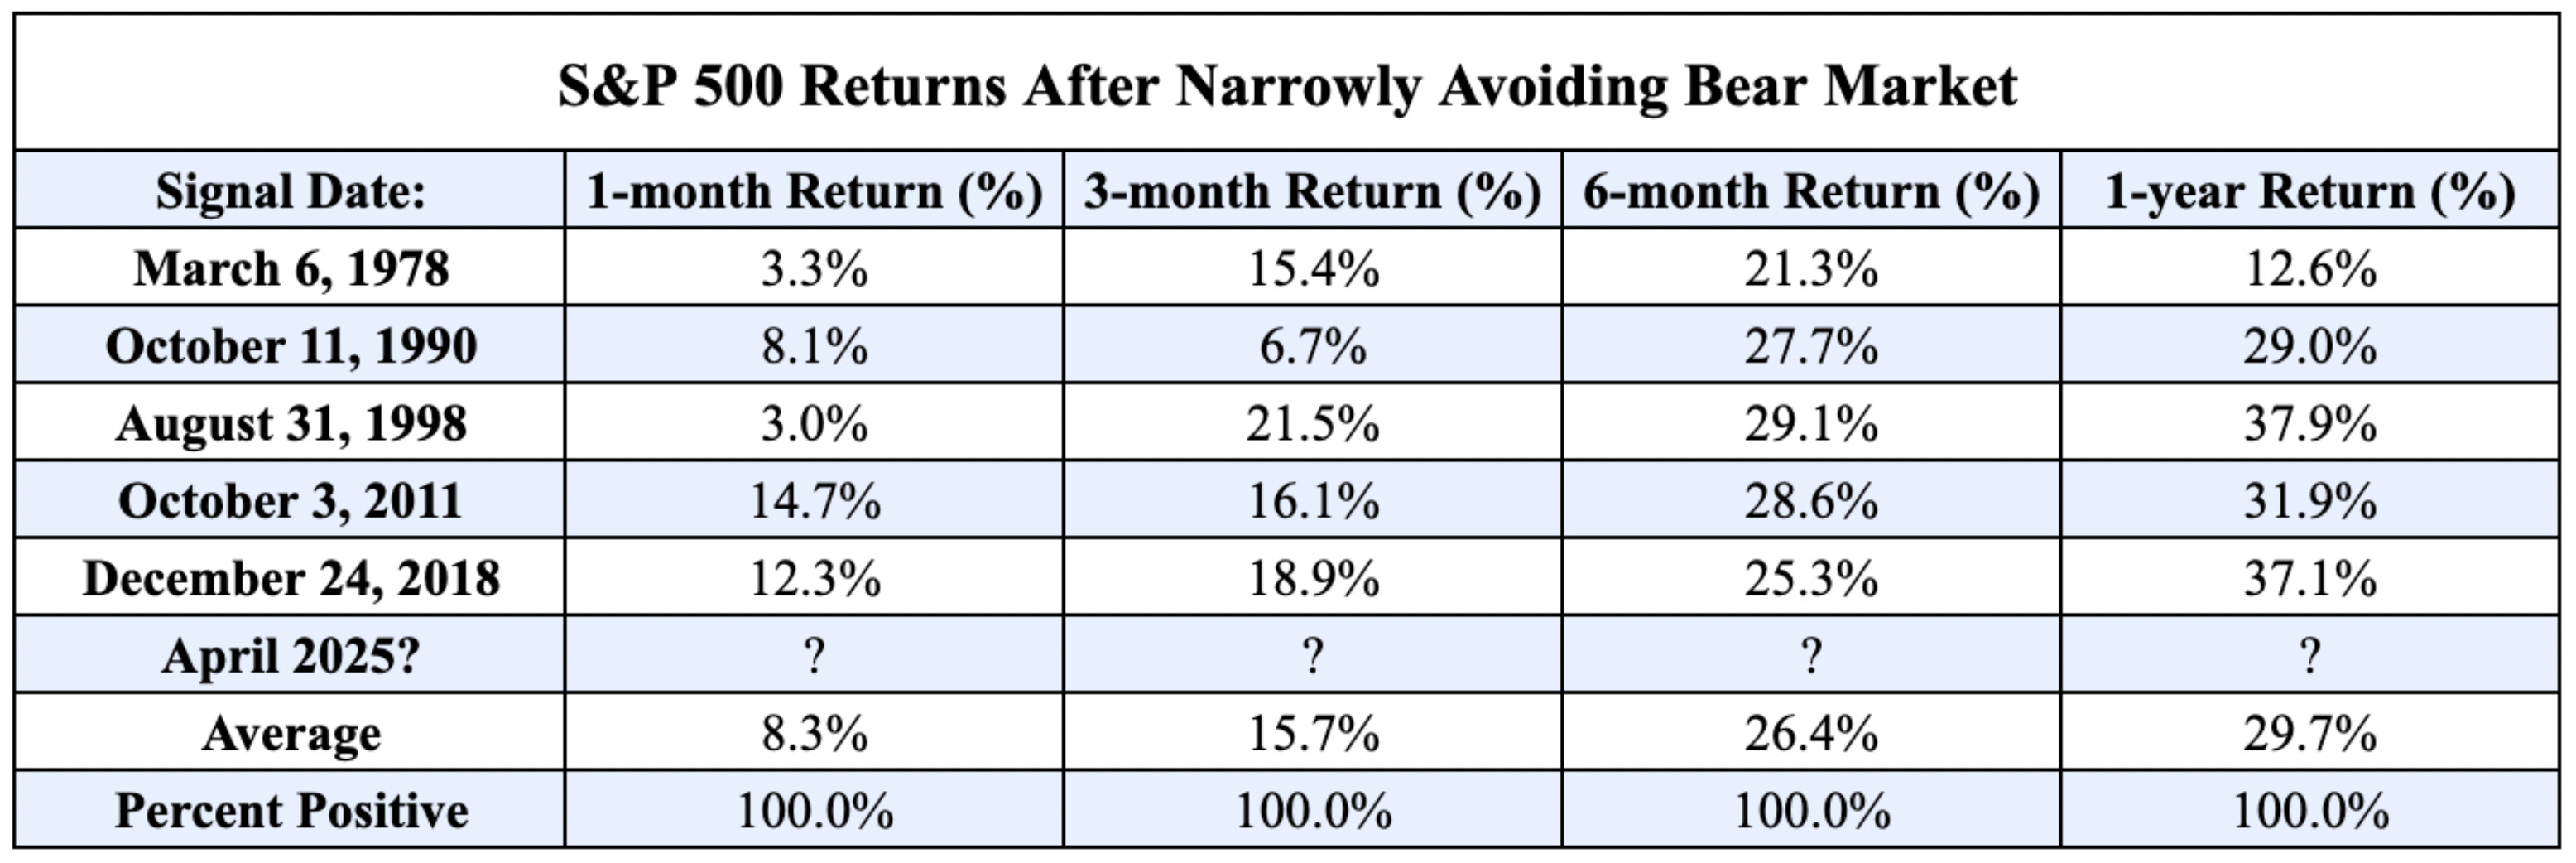
Leveraging data from Ryan Detrick of Carson Investment Research, I wanted to focus on all market environments that were “near bear markets”, in which the S&P 500 fell roughly -19% on a peak to trough basis. At the time, the S&P 500’s drawdown from the highs to the April 7th lows was exactly -19%. Therefore, if I was going to question “are the lows in?”, then it would be a good idea to know how similar market environments performed after narrowly avoiding a bear market (which requires a decline of -20% or more on a closing basis). Going back to the 1940’s, there were only five prior market environments that met this criteria: March 1978, October 1990, August 1998, October 2011, December 2018. Considering how rare these “near bear markets” were, it seemed valuable to analyze how the market performed in the past as a way to set a potential blueprint for the current market environment! Here was the data table of forward returns:
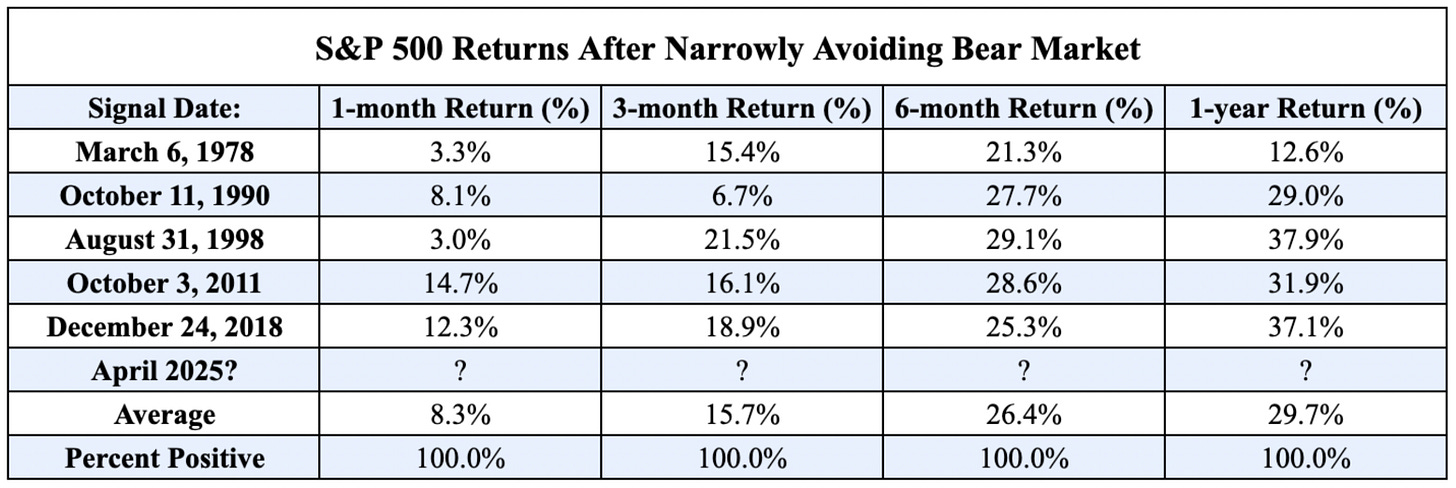
The results were overwhelmingly bullish! However, there was one problem…
This first criteria is inherently biased in a bullish way because we’re essentially asking, “once stocks stopped falling, how much did they go up?”. But the problem was that no one knew for a fact that stocks had stopped falling… so how useful could that one criteria really be? Therefore, in an attempt to reduce the bullish bias of the study, I added one additional criteria. Using the 21, 55, 100, and 200-day EMAs, I classified a bullish signal as a “near bear market” followed by the S&P 500 getting back above all four of its key moving averages! At the time, this was the S&P 500 with those key EMAs:

Because all uptrends ever, regardless of the asset, can be characterized as the price of that asset trading above its key moving averages, this second criteria provided a quantitative method for regaining bullish momentum and bullish price structure.
As an objective analyst and trend-follower, this criteria completed the strategy.
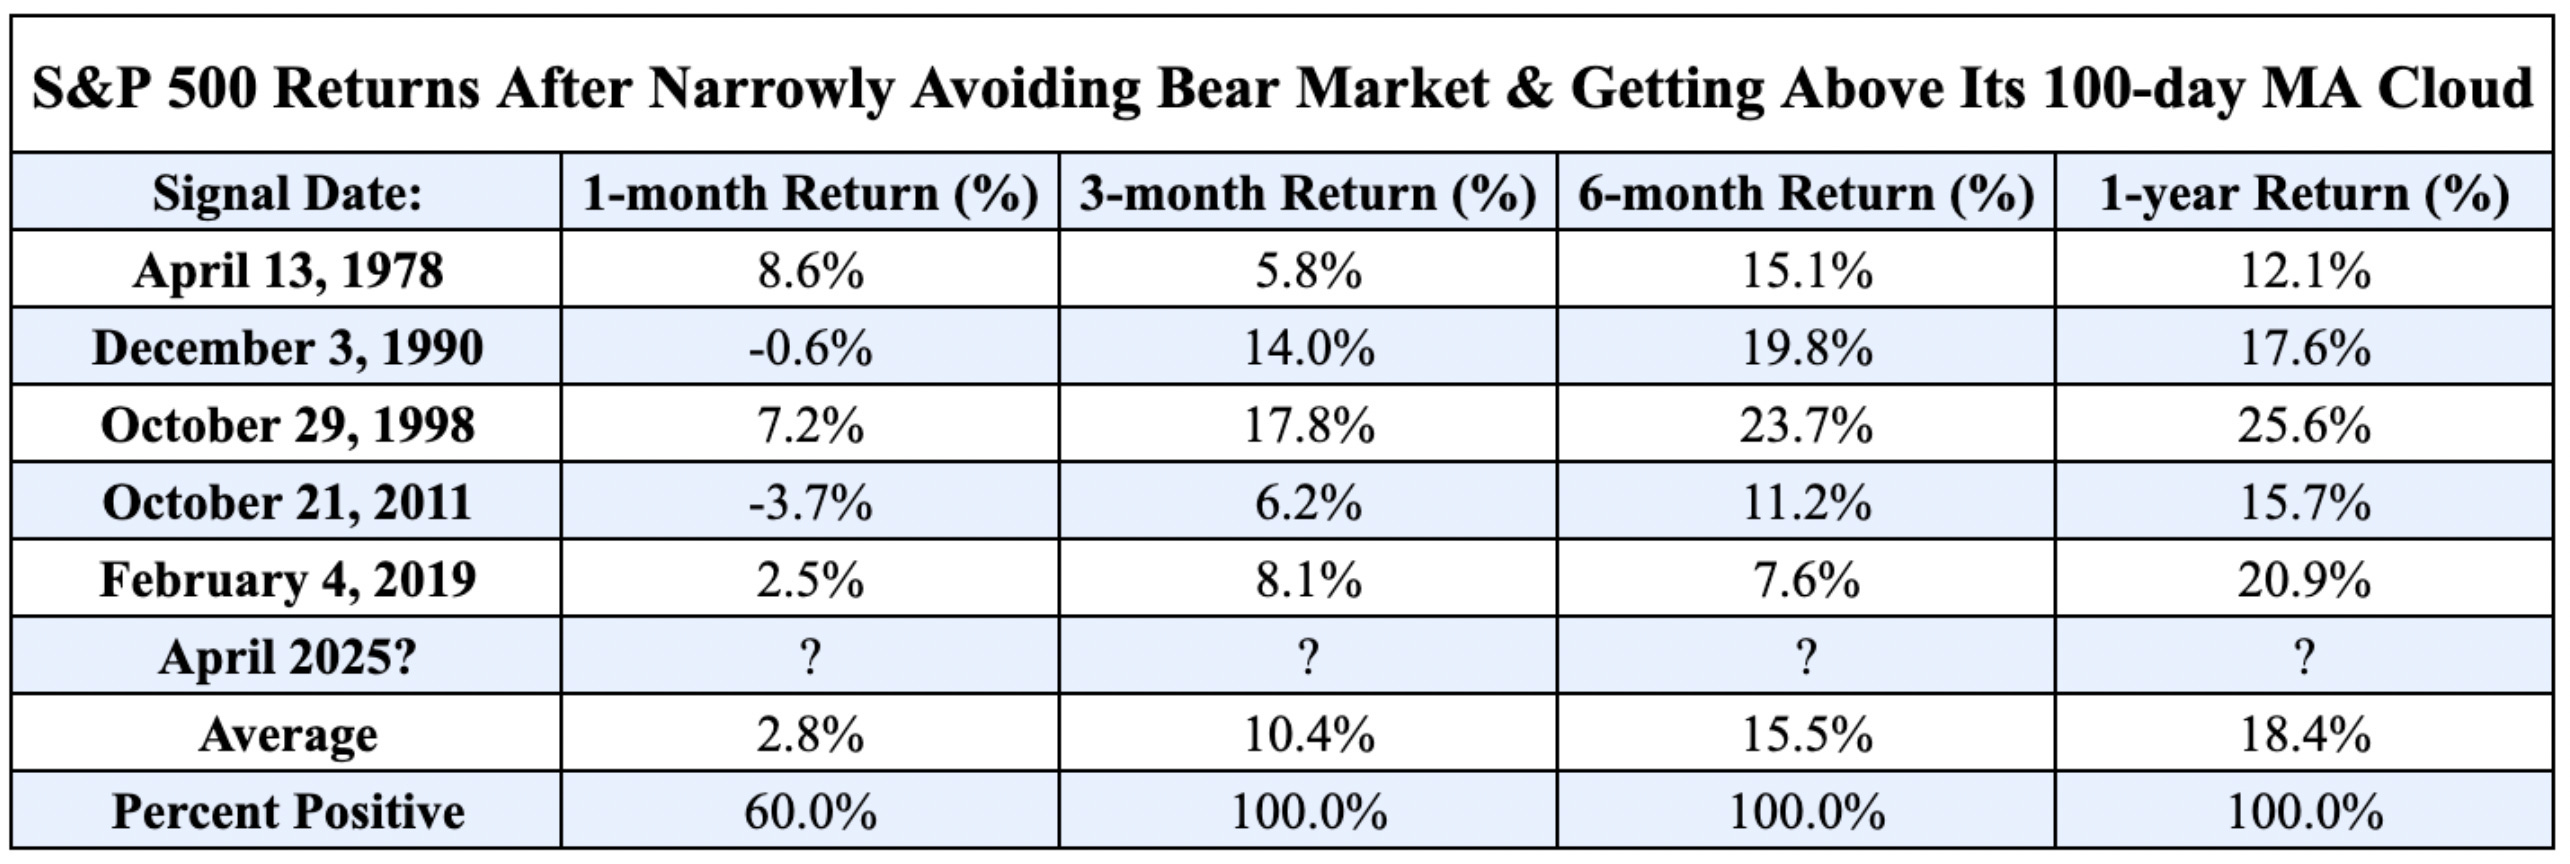
So how did the forward returns look in the prior five cases? Remarkable!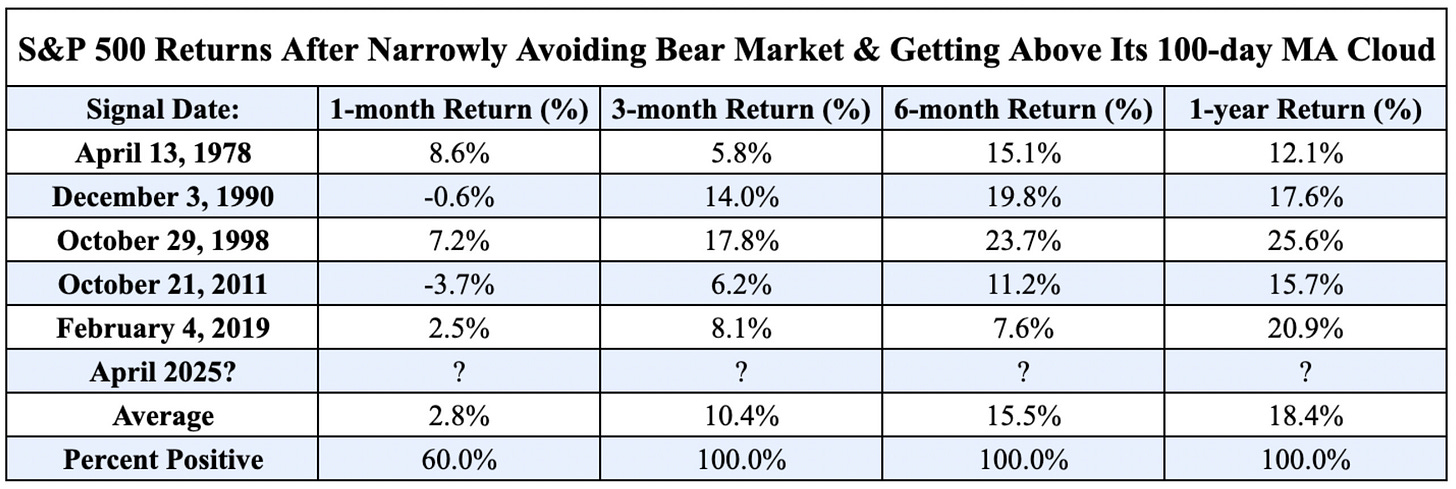
While forward returns weren’t as strong as the first criteria alone, this removed the inherent bullish bias and provided a degree of objectivity. At the end of the day, is anyone really going to be upset or disappointed with an average 6M return of +15.5%?

Together, the criteria of this study aligned with the philosophical themes that I highlighted at the start of this report… they relied on simplicity, preventing emotional decision-making to heightened uncertainty, and they produced a quantitative method to eventually flip bullish with clear bullish results, even if that method took time to trigger the bullish signal.
It all came down to “less is more” and “late and right is better than early and wrong”.
So how has this strategy worked so far? Has it been effective? Has it been accurate?
Here’s the current view of the S&P 500 with those key EMAs:
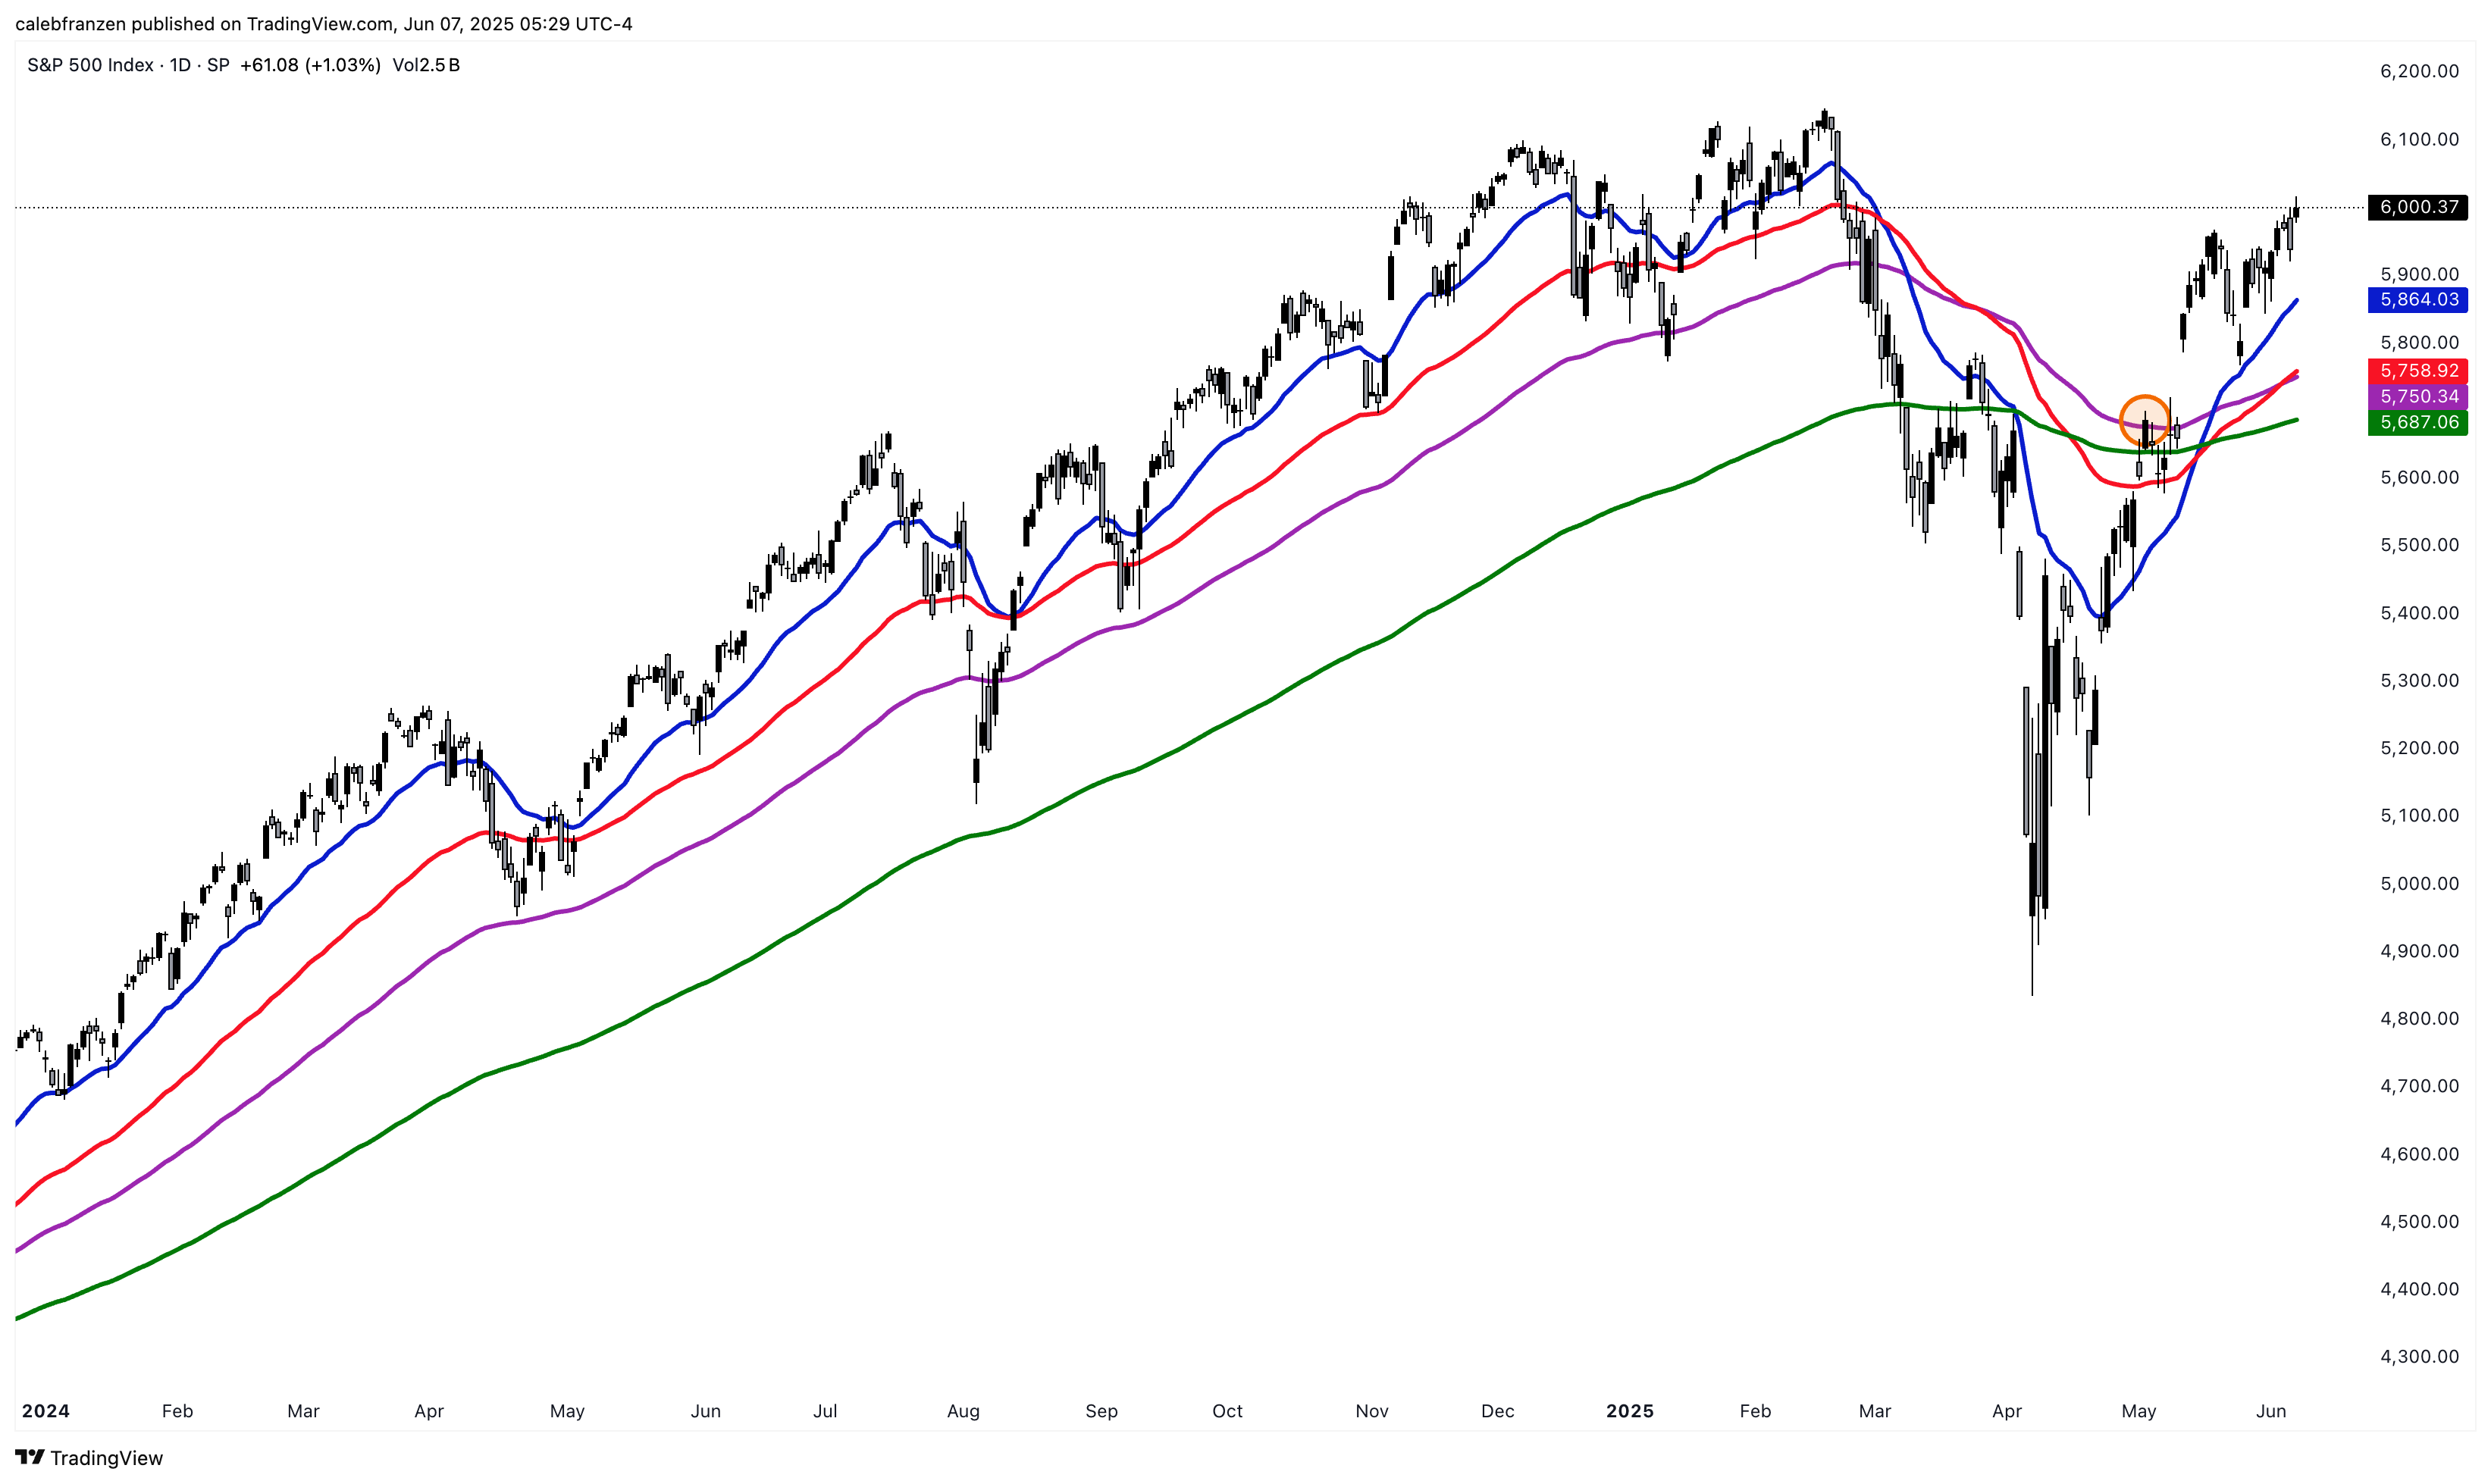
Since closing above all of its EMAs on May 2nd, the S&P 500 has gained +5.55%.
This isn’t an amazing return at face value, but let’s actually contextualize just how strong of a move this has been in such a short period of time.
With 250 trading days in the year, the S&P 500’s return of +5.55% in 28 trading days produces an annualized return of +55.8%!

Considering that the index averages about +9% in a calendar year going back to the 1950’s (post-WW2 era), these returns are unequivocally strong. Of course, we’re only 28 trading days into this study’s return window, so it’s far too early to take victory laps or proclaim success, but I simply want to highlight the power of the objective and data-backed research that I’m focused on producing at Cubic Analytics.
The beauty of this study is that we also have downside invalidation criteria!
If the S&P 500 falls below all four of these moving averages, then the implications of forward returns immediately get withdrawn and we can adapt to new market data.
So that’s the point…
If the S&P 500 continues to stay above these moving averages, then the conclusion is that good things should continue to happen for stock market investors.
With an average 1Y return of +18.4% and a hit rate of 100%, I’m not fading this strategy until we have decisive evidence of a breakdown.
There’s a reason why my research works and why it’s produced such strong results for my own investment portfolio… because it’s based in reality and focuses on aligning with trends, rather than speculating on what trends may or may not be at some point in the future.
I’m singularly focused on doing one thing: creating effective & actionable research that will produce great investment results, regardless of the market environment.
In hindsight, I can now say that my bearishness in April was wrong.
But it wasn’t wrong in February or March.
And it’s been spot on since late April and early May.
I stayed the course, remained patient, stuck to my plan, and executed based on data & statistics rather than emotion.
The results speak for themselves.
Year to date, my equity portfolio is up +8.5% vs. the S&P 500’s return of +2.2%.
On a trailing 12-month basis, my portfolio is up +24% vs. the S&P 500’s +12%.

This is the actual outperformance that my research is generating, with minimal effort.
No options. No leverage. No day/swing trading. No complex financial instruments.
Just actionable insights that produce effective results.
I continue to put my money where my mouth is and fully stand beside my research.
Thankfully, there are ~1,100 investors around the world who are standing next to me on the premium membership for Cubic Analytics and benefiting from these insights.

If you’re ready to access the same insights and alpha that they are, come join them.
You’ll regret it if you don’t.
Best,
Caleb Franzen,
Founder of Cubic Analytics
This was a free edition of Cubic Analytics, a publication that I write independently and send out to 14,000 investors every Saturday. Feel free to share this post!
To support my work as an independent analyst and access even more exclusive & in-depth research on the markets, consider upgrading to a premium membership with either a monthly or annual plan using the link below:
There are currently 1,070+ investors who are on a premium plan, accessing the exclusive alpha and benefits that I share with them regarding the stock market, Bitcoin, and my own personal portfolio.
DISCLAIMER:
This report expresses the views of the author as of the date it was published, and are subject to change without notice. The author believes that the information, data, and charts contained within this report are accurate, but cannot guarantee the accuracy of such information.
The investment thesis, security analysis, risk appetite, and time frames expressed above are strictly those of the author and are not intended to be interpreted as financial advice. As such, market views covered in this publication are not to be considered investment advice and should be regarded as information only. The mention, discussion, and/or analysis of individual securities is not a solicitation or recommendation to buy, sell, or hold said security.
Each investor is responsible to conduct their own due diligence and to understand the risks associated with any information that is reviewed. The information contained herein does not constitute and shouldn’t be construed as a solicitation of advisory services. Consult a registered financial advisor and/or certified financial planner before making any investment decisions.
Each investor is responsible to understand the investment risks of the market & individual securities, which is subjective and will also vary in terms of magnitude and duration.
I love the transparency, Caleb!
Investors, this is the report that I referenced where I first shared this original study in real-time.
Check it out!
https://cubicanalytics.substack.com/p/late-and-right-vs-early-and-wrong