Prepare Now For This Bullish Signal
Investors,
The Nasdaq-100 is on the precipice of an extremely rare and bullish long-term signal, which could flash in the month of June 2023. Since the tech-focused index was created in 1985, the indicator has only occurred four times and I’m officially alerting investors that the fifth signal could occur soon.
All investors should be prepared for the implications we’re about to discuss.
The signal uses the 18-month Williams%R Oscillator, calculating where the price of any asset is trading relative to its 18-month high/low range. Specifically, the signal flashes when the W%R reading oscillates from the “oversold” lower-bound to the “overbought” upper-bound. As we can see from the chart below, which outlines each of these signal, the last time the signal flashed was in December 2009:
From my view, this indicates a massive momentum thrust occurring over a medium-term timeframe, regardless of how long it took for the indicator to make this rotation from oversold to overbought.
There are several key takeaways from this study:
The Nasdaq has never fallen below the bear market lows after this signal flashes.
The Nasdaq has experienced some choppiness after this signal flashes.
Forward looking returns are quite bullish on a medium and long-term basis.
Below are the forward-looking returns for the Nasdaq-100 after each signal:
While I fully recognize that this is a limited sample size, with two signals occurring a few years before the onset of the Dot Com Bubble, I think it’s very important to recognize the clear bullish behavior after this signal flashes. In the event that this sample size is too small, I decided to also apply the same indicator to the S&P 500, which has a much longer history.
As it turns out, this signal is also getting very close to flashing for the $SPX:
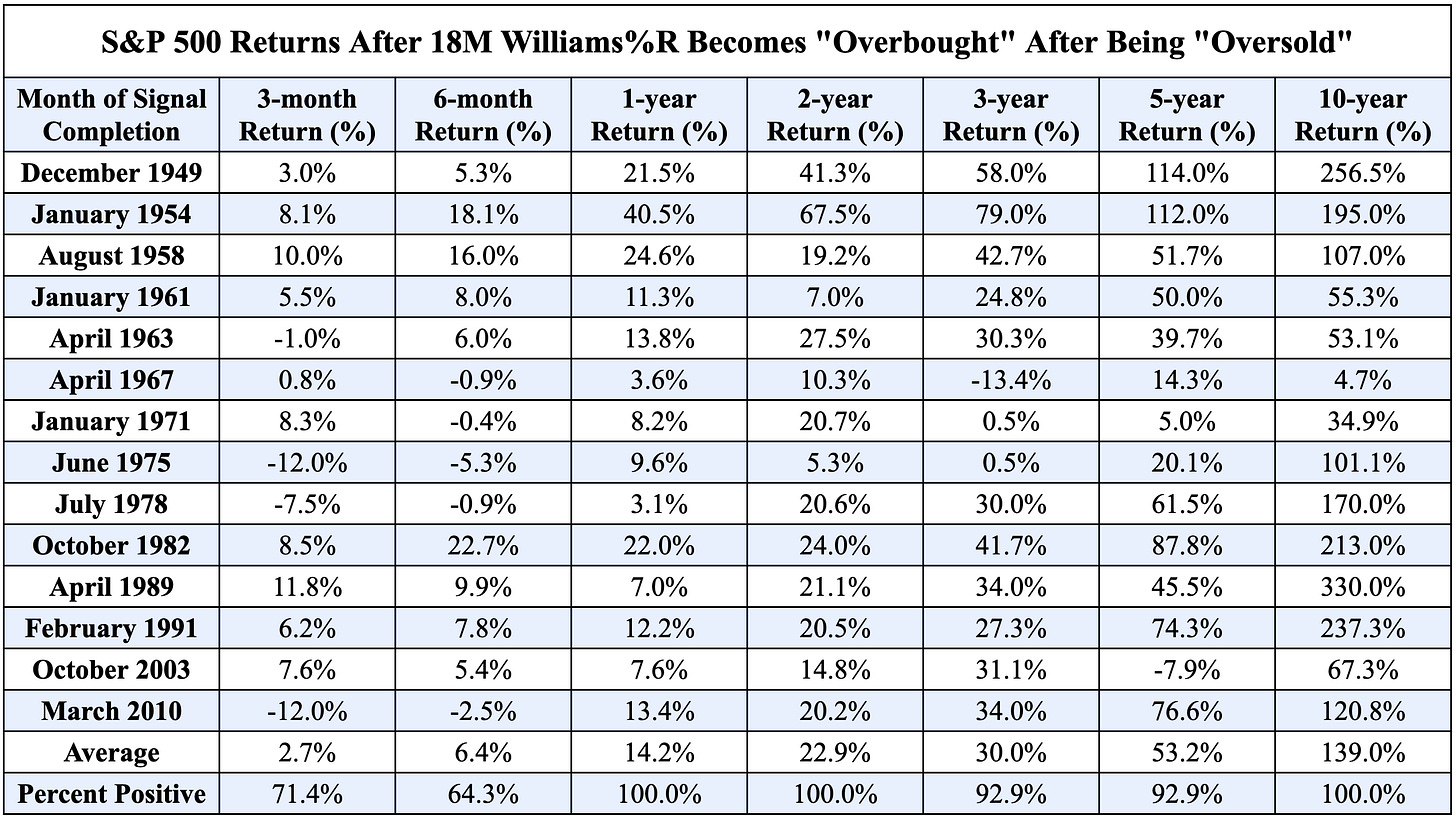
This S&P 500 indicator has achieved this momentum thrust 14 times since 1949, with the last signal occurring in March 2010! Analyzing the forward-looking returns for this study provides a larger sample size with very similar bullish implications.
While the returns are muted compared to the Nasdaq-100 study, this is what we would expect given the larger sample size and the fact that the Nasdaq typically outperforms the S&P 500 during a bull market environment. Returns in this S&P 500 study are far more accurate than the Nasdaq-100 study because the data includes poor market conditions from the 1970’s and great market conditions during the 1990’s; therefore including an array of market conditions to remove biases and a limited sample size.
Despite the poor performance in the 1970’s, the average forward-looking returns still reflect overall bullish dynamics! The October 1982 case also happens to align perfectly with Black Monday in October 1987, when the S&P 500 fell -22% for the month of October. Similarly, the March 2010 signal aligns perfectly with the lows from the COVID crash, when the index fell -13% in the month. The point is, there is randomness to the markets where crashes or recessions can occur within the data we are studying above. However, this merely helps to broaden the possibilities and various events that can occur, which in turn make our study even more accurate!
With this context & these caveats in mind, these are the core takeaways that I’m finding in the data:
On an average return basis, returns rise over each chronological time period, therefore indicating strong bull market dynamics and a positive return profile.
6-month returns are the most volatile, with the lowest probability of generating a positive return. Still the average return of +6.4% in 6 months is very strong.
The S&P 500 is never lower after 1 year, 2 years, or 10 years after the signal occurs.
Average 1-year returns are +14.2%, significantly outperforming the S&P 500’s average calendar year return of roughly +9% in the post-WW2 era. This means that the market is more bullish than usual after the signal occurs.
The CAGR of the 3Y and 5Y return profile is generally in-line with the S&P 500’s average calendar year return in the post-WW2 era, indicating that there is less meaningful signal on a 3-5Y basis. Nonetheless, it’s still bullish given the 93% probability of being higher 3 years and 5 years later.
Given the strength of the long-term returns and the relatively weaker returns on a short-term basis, this signal indicates that short-term dips should be bought rather aggressively over a 3-6 month basis after the signal occurs.
The signal seems most effective on a 1Y and 2Y basis, potentially indicating above-average market returns through Q3 2025, based on the assumption that this signal flashes within the coming months.
As always, I’m trying to point out the caveats of this study within the historical context of market conditions, while fully acknowledging that statistics do not operate in a vacuum absent of economic conditions, monetary policy, geopolitical risks, or financial crises. Nonetheless, despite an uncertain world around us at all times, this signal has appeared to provide meaningful conclusions about forward-looking market returns, which gives me confidence that the market will experience better-than-average market returns on a medium-term basis, if/when this signal flashes.
It hasn’t flashed yet, but I will keep this on my radar and alert all subscribers & Twitter followers when it does.
While this has already been a jam-packed report, I will be diving into more analysis, exclusive for premium members below. To benefit from this type of research, please consider becoming a premium member today, which also supports my work and my efforts to provide institutional-quality research every single week.


