


Patience Is Key

Investors,
Bitcoin is quietly trying to produce its 2nd straight positive weekly candle.

Additionally, the bullish RSI divergence on daily candles is intact.

This marks the first bullish RSI divergence after the indicator became oversold since June & July 2024, when the price of Bitcoin was trading around $57,000.
Of course, the price of Bitcoin went on to make new lows after the last bullish RSI in August & September; however, this marked an important signal for investors who were willing to stomach more short-term volatility and market turmoil.
Is this signal guaranteed to work & produce the same results as it did last time?
No.
But this is a positive development that both bulls & bears should be aware of.
Currently sitting at $84.2k, I think it’s important for investors to understand where we are based on the context of where Bitcoin has come from.
BTC was trading at $95.1k three months ago, netting a return of -11.4%.
BTC was trading at $63.5k six months ago, netting a return of +32.4%.
BTC was trading at $63.8k one year ago, netting a return of +32.2%.
BTC was trading at $27.3k two years ago, netting a return of +209%.
BTC was trading at $42.4k three years ago, netting a return of +98.9%.
As a long-term Bitcoin investor myself, I understand the desire to protect these phenomenal returns, but I also want to avoid overcomplicating my job as an investor.
The fact of the matter is that patience has been a Bitcoiner’s best friend.
I don’t think that’s going to change any time soon.
Macroeconomics:
From a macro standpoint, you’ve likely noticed that I haven’t joined the recession or stagflation camps in recent weeks. All of the bearishness that I’ve expressed has been the result of intermarket relationships, volatility, and credit spreads, rather than crying about the labor market, re-inflation, tariffs, or Trump.
Thankfully, the VIX (volatility) and credit spreads both moved lower this week, reflecting lower levels of broader market risk.
However, one interesting component that no one is really focused on is copper.
Yes, copper.
Copper is an interesting commodity because the price of copper is cyclical:
When the economy is growing, copper demand rises.
When the economy is contracting, copper demand falls.
Because prices are just a function of supply and demand, economic activity has a strong influence on copper prices, reflecting the change in demand as a result of global growth (or the lack of it).
So copper prices can provide an insight on the health & growth of the economy!
With this information at our fingertips, let’s actually look at copper prices in order to gauge how the economy is shaping up…

Copper just had its highest weekly close of all-time & has been rising throughout 2025!
That sure doesn’t sound recessionary to me…
Maybe — just maybe — the economy continues to be resilient & dynamic.
Stock Market:
Fundamentally, stock prices are also just a function of supply and demand.
The challenge with this simplicity is the fact that demand is influenced by a variety of different factors, including (but not limited to):
Risk appetite
Interest rates
Future cash flows
Available alternatives
Focusing on only one of these metrics is going to provide an incomplete picture.
Even if we focus on all of the factors that influence demand, then we’re still only paying attention to half of the supply/demand curve, which therefore highlights the complexity of investing based on fundamentals.
This is why I often choose to focus purely on technicals and price structure, because all of the “fundamental” factors and the known (and unknown) risks are being constantly reflected in price at any given moment in time.
Still, that doesn’t stop me from analyzing fundamentals, which is why this chart from Kevin Gordon of Schwab stood out to me. The chart below tracks the S&P 500’s forward 12-month earnings per share (EPS) since 2022:
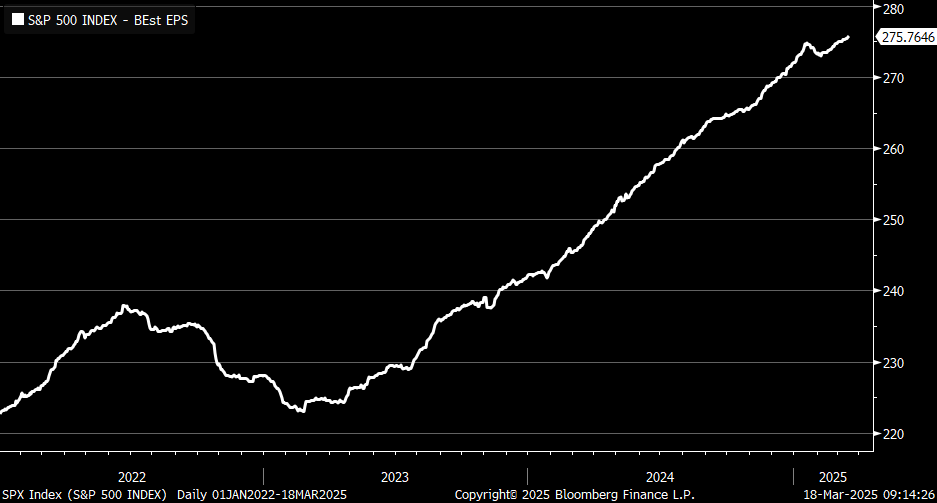
If EPS is an imperfect (but sufficient) gauge for cash flows, then forward 12M EPS is an excellent way to measure the market’s expectations for future cash flows used in DCF models.
All else being equal:
Rising future cash flows causes asset prices to rise.
Falling future cash flows causes asset prices to fall.
As we know, “all else” isn’t necessarily equal, as demand is multivariate; however, stock market investors should be encouraged by the fact that forward 12M EPS is making new all-time highs for the S&P 500.
This reflects strong underlying fundamentals, at least for now.
Bitcoin:
The big line in the sand for me continues to be the 200-day moving average cloud.
While we can be encouraged by the ongoing bullish RSI divergence that I highlighted in the intro of this report, Bitcoin bulls need to see the price of BTC break (and hold) above its 200-day moving average cloud.

While price action can be “noisy” around the cloud, as we saw in Q3’24, we can objectively see that these breakouts eventually produce bullish results.
Because uptrends are inherently characterized by the price of an asset trading above its moving average, we can simply reverse engineer the bull market criteria by recognizing that a bullish signal will be produced if/when price is able to break (and stay) above its 200-day moving average.
This “keep it simple” methodology will ensure that investors are able to capitalize on the uptrend and/or avoid punishment in a downtrend.
Best,
Caleb Franzen,
Founder of Cubic Analytics
This was a free edition of Cubic Analytics, a publication that I write independently and send out to 13,250+ investors every Saturday. Feel free to share this post!
To support my work as an independent analyst and access even more exclusive & in-depth research on the markets, consider upgrading to a premium membership with either a monthly or annual plan using the link below:
There are currently 1,030+ investors who are on a premium plan, accessing the exclusive alpha and benefits that I share with them regarding the stock market, Bitcoin, and my own personal portfolio.
DISCLAIMER:
This report expresses the views of the author as of the date it was published, and are subject to change without notice. The author believes that the information, data, and charts contained within this report are accurate, but cannot guarantee the accuracy of such information.
The investment thesis, security analysis, risk appetite, and time frames expressed above are strictly those of the author and are not intended to be interpreted as financial advice. As such, market views covered in this publication are not to be considered investment advice and should be regarded as information only. The mention, discussion, and/or analysis of individual securities is not a solicitation or recommendation to buy, sell, or hold said security.
Each investor is responsible to conduct their own due diligence and to understand the risks associated with any information that is reviewed. The information contained herein does not constitute and shouldn’t be construed as a solicitation of advisory services. Consult a registered financial advisor and/or certified financial planner before making any investment decisions.
Each investor is responsible to understand the investment risks of the market & individual securities, which is subjective and will also vary in terms of magnitude and duration.