


Overbought + New ATH's = Bullish

Investors,
The S&P 500’s 1-year Williams%R Oscillator remains overbought, a bullish signal that flashed in April 2023 and mid-November 2023.

The only difference between the recent signals vs. the April 2024 signal is that the current signal carried the S&P 500 to new all-time highs — arguably the most bullish thing that the stock market can do.
There are two things that I want to address regarding this topic:
1. If you don’t believe that overbought signals are bullish, you’re unfortunately mistaken and I’d encourage you to read the piece that I published below (keep in mind that the Nasdaq-100 has gained +5.2% over the 27 trading days since I published the report):

2. If you don’t believe that making new ATH’s is bullish, you’re also mistaken.
But hey, don’t take my word for it… this research from The Carson Group provides a beautiful glimpse into forward stock market returns after a 1-year consolidation and the formation of new all-time highs:

The takeaway is that the S&P 500 is higher one year later 92.9% of the time, with an average return of +14.9%. Keep in mind, if you take any random date, there’s a 70% chance that the stock market is higher one year later and the average 1-year return for the S&P 500 is +9%. Either way, the development of new all-time highs is bullish in terms of accuracy & magnitude.
But it gets better…
The team at 3Fourteen Research aggregated the average return for the S&P 500 in the past 14 cases where the index made new all-time highs after a period of not making new ATH’s for 252 trading days (the equivalent of one year). The composite result is the following trajectory:
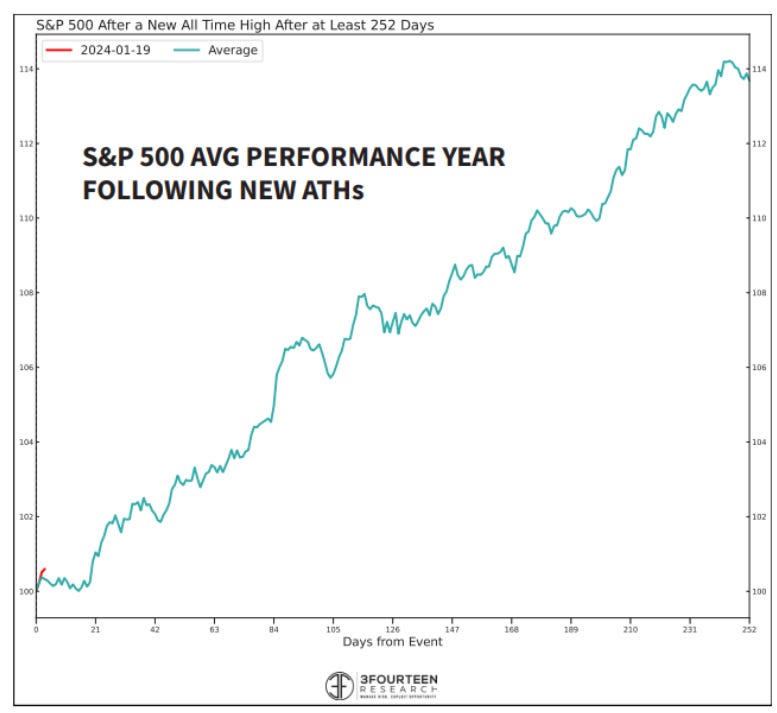
While we shouldn’t expect for the next 12 months to follow this path to perfection, this is a fantastic way of visualizing how investor psychology manifests into forward returns after the S&P 500 makes a new all-time high.
But it gets even better…
The S&P 500 just gained +19% over the past three months, which has only occurred 17 times in the past 100 years. In 16 of those 17 past signals, the S&P 500 was higher one year later by an average return of +30% and the U.S. didn’t have a recession.
I reiterate, the development of new all-time highs is one of the most bullish things that can happen to the stock market.
It’s just a fact.
In the remainder of this report, I’ll cover new S&P 500 data, highlight a few of my major short-term concerns, analyze Q4 2023 earnings data (so far), and share the adjustments that I made in the long-term portfolio this week (with screenshots).
To support my work as an independent analyst and to benefit from this value of this report, consider upgrading to a premium subscription using the link below!