
One Chart At A Time
Chart Request - July 2026

Investors,
I don’t want to waste any time, because this report is packed with alpha.
You submitted 120+ tickers in the past 24 hours, and I’ve taken an in-depth review of every single one of them in order to prepare this deck for you with my full analysis.
This is the 3rd chart request that I’ve done as part of the benefits that you receive as a premium member of Cubic Analytics, and I’m delighted to make these a permanent monthly feature to ensure that you’re getting as much value as possible.
I’m sharing unfiltered analysis on 71 different assets in this report, including assets like Google, Nvidia, AAOI, GLW, Gold, HIMS, ORCL, PLTR, Solana, and many others.
Quick Housekeeping…
A few things before we begin:
This report is long and contains a lot of charts, which means that you won’t be able to view the entire analysis natively within your email. Please go directly to the Substack app if you’re on mobile/tablet, or directly to the Cubic Analytics website and find this report.
The assets that I analyzed are presented in alphabetical order, by the name of the company, commodity, ETF, or cryptocurrency. For example, Alphabet ($GOOGL) will be listed as one of the first in the report, under the A’s.
All charts are in daily candles, unless explicitly stated otherwise.
The Chart Request Analysis:
10x Genomics ($TXG):
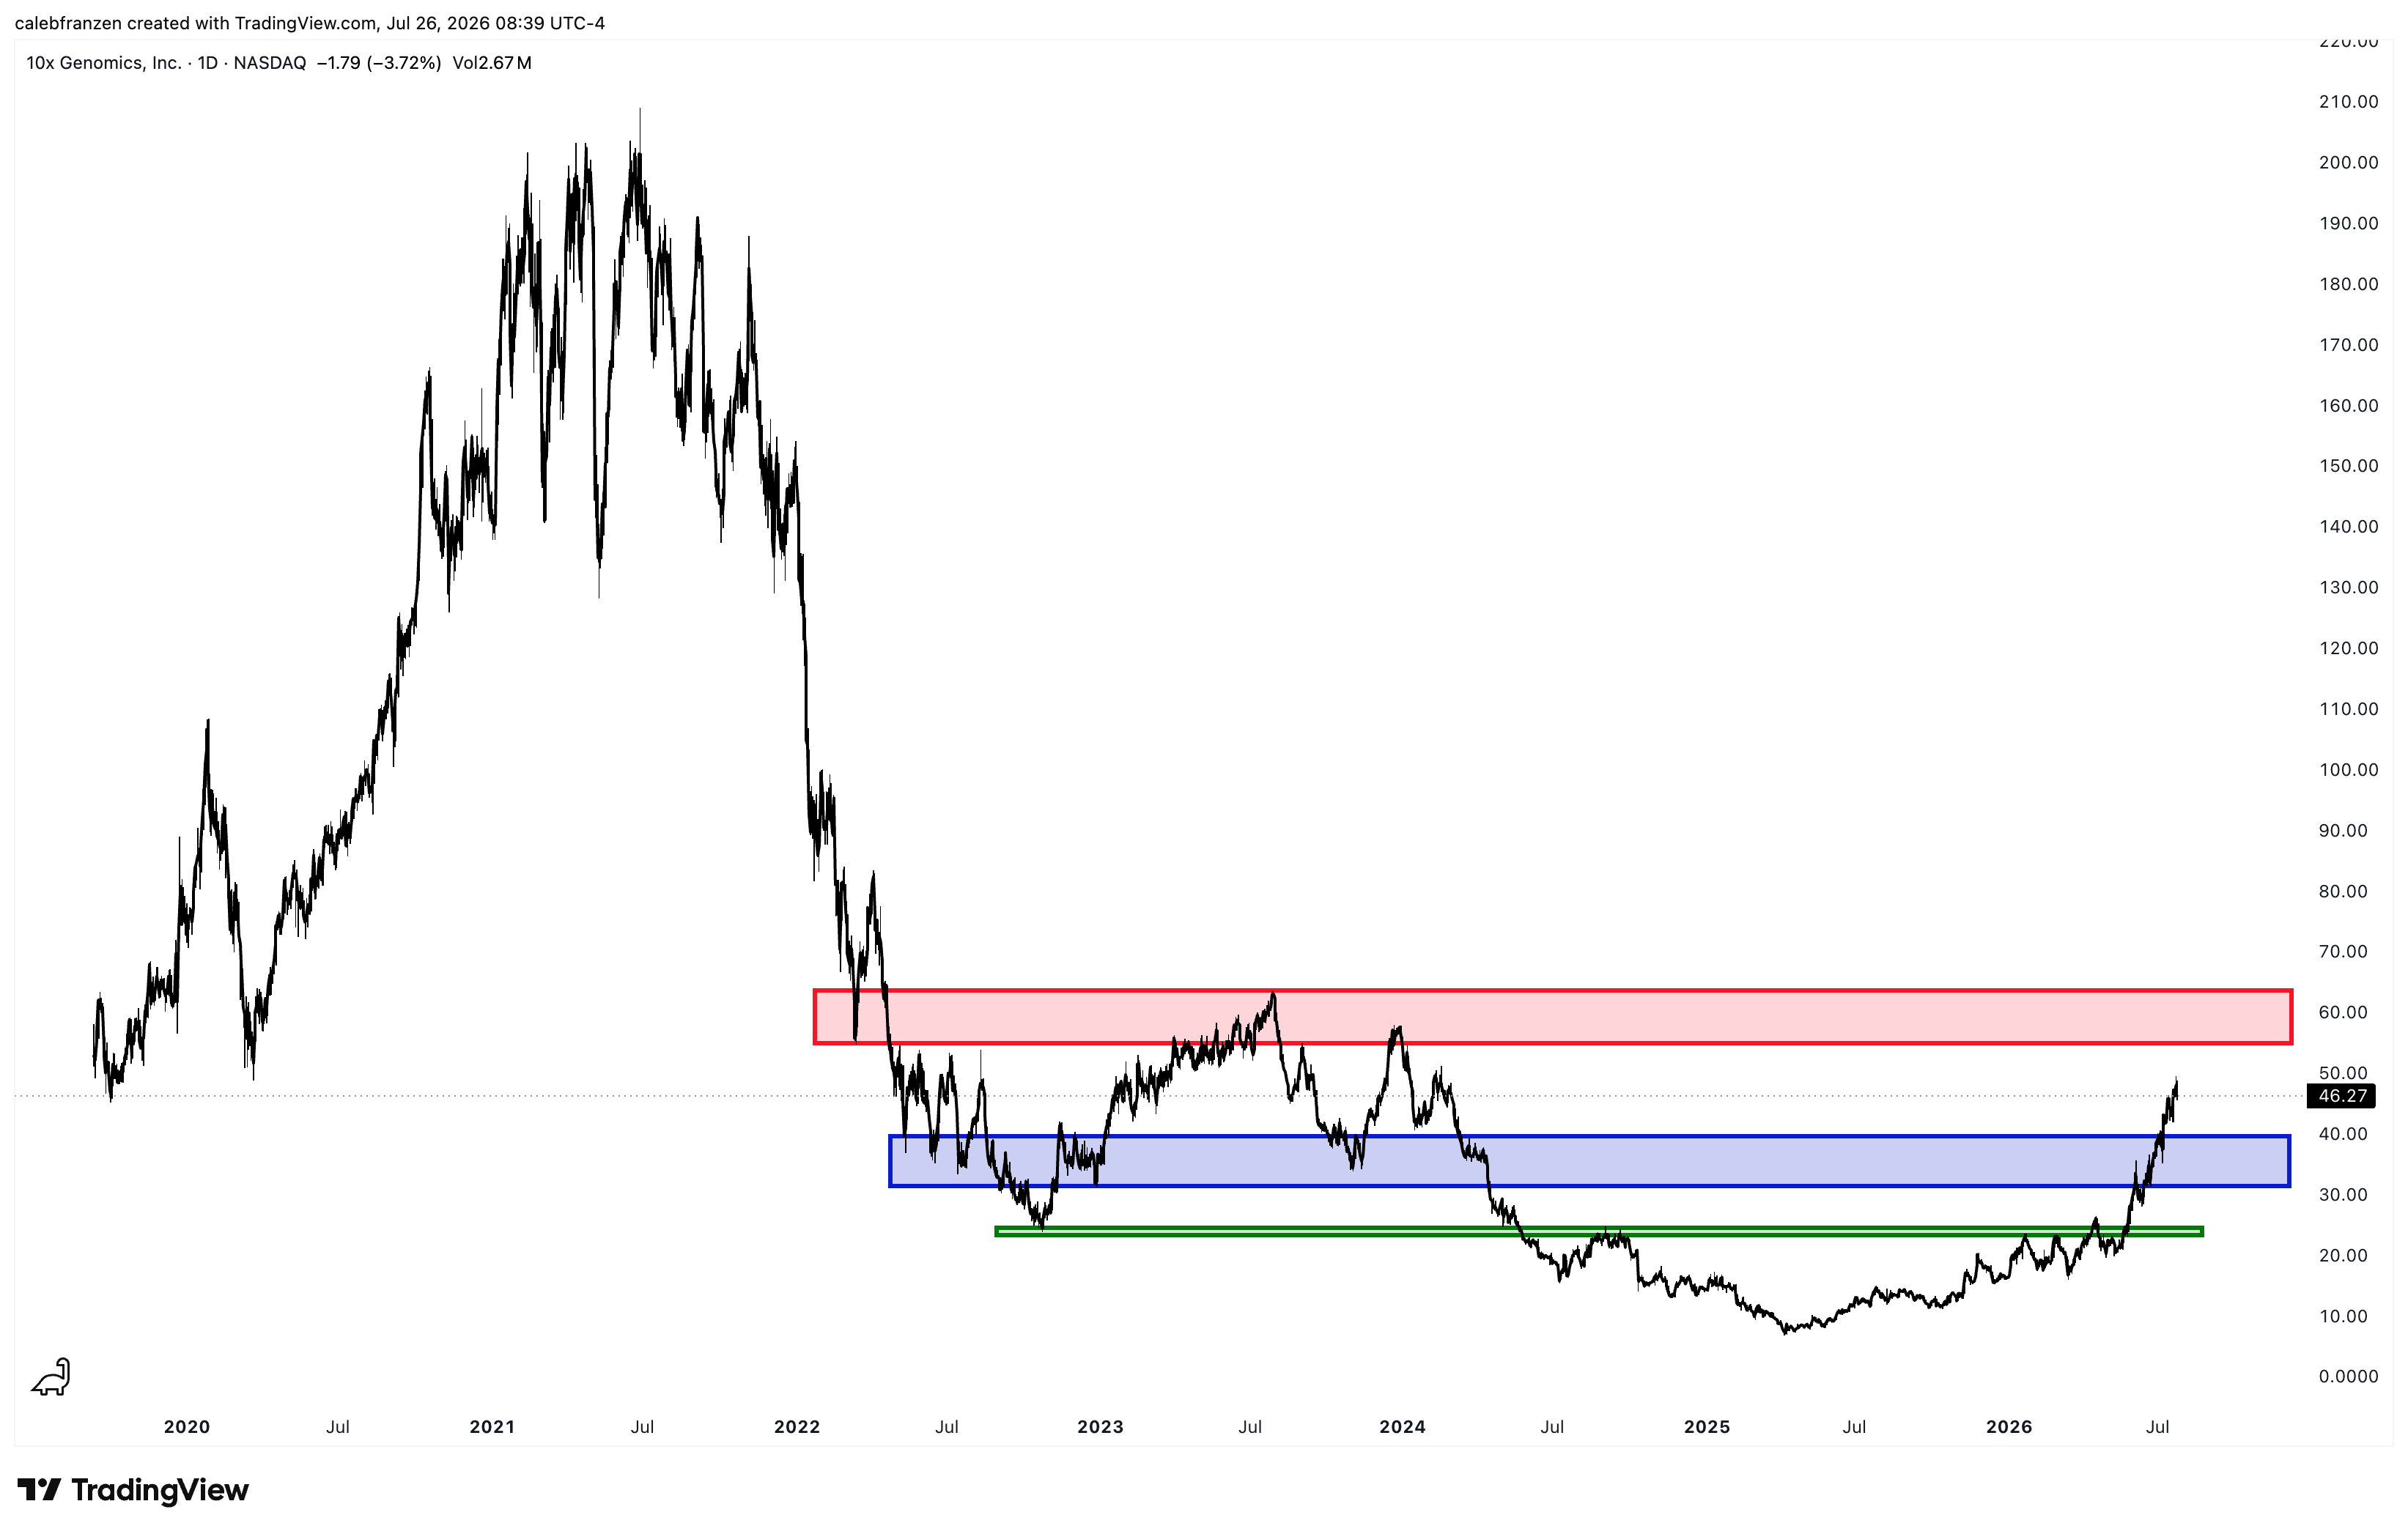
The last time that we talked about this one, it was trading in the blue zone, which I thought would act as resistance… I was right (at first) because the stock fell -21% after entering that blue zone, but it’s been able to achieve a massive breakout. I don’t know what happens immediately next, but I think that price will trend into the red zone. A potential retest into the blue zone would provide the best risk/reward with an opportunity to hold that range as support.
Almonty Industries ($ALM):
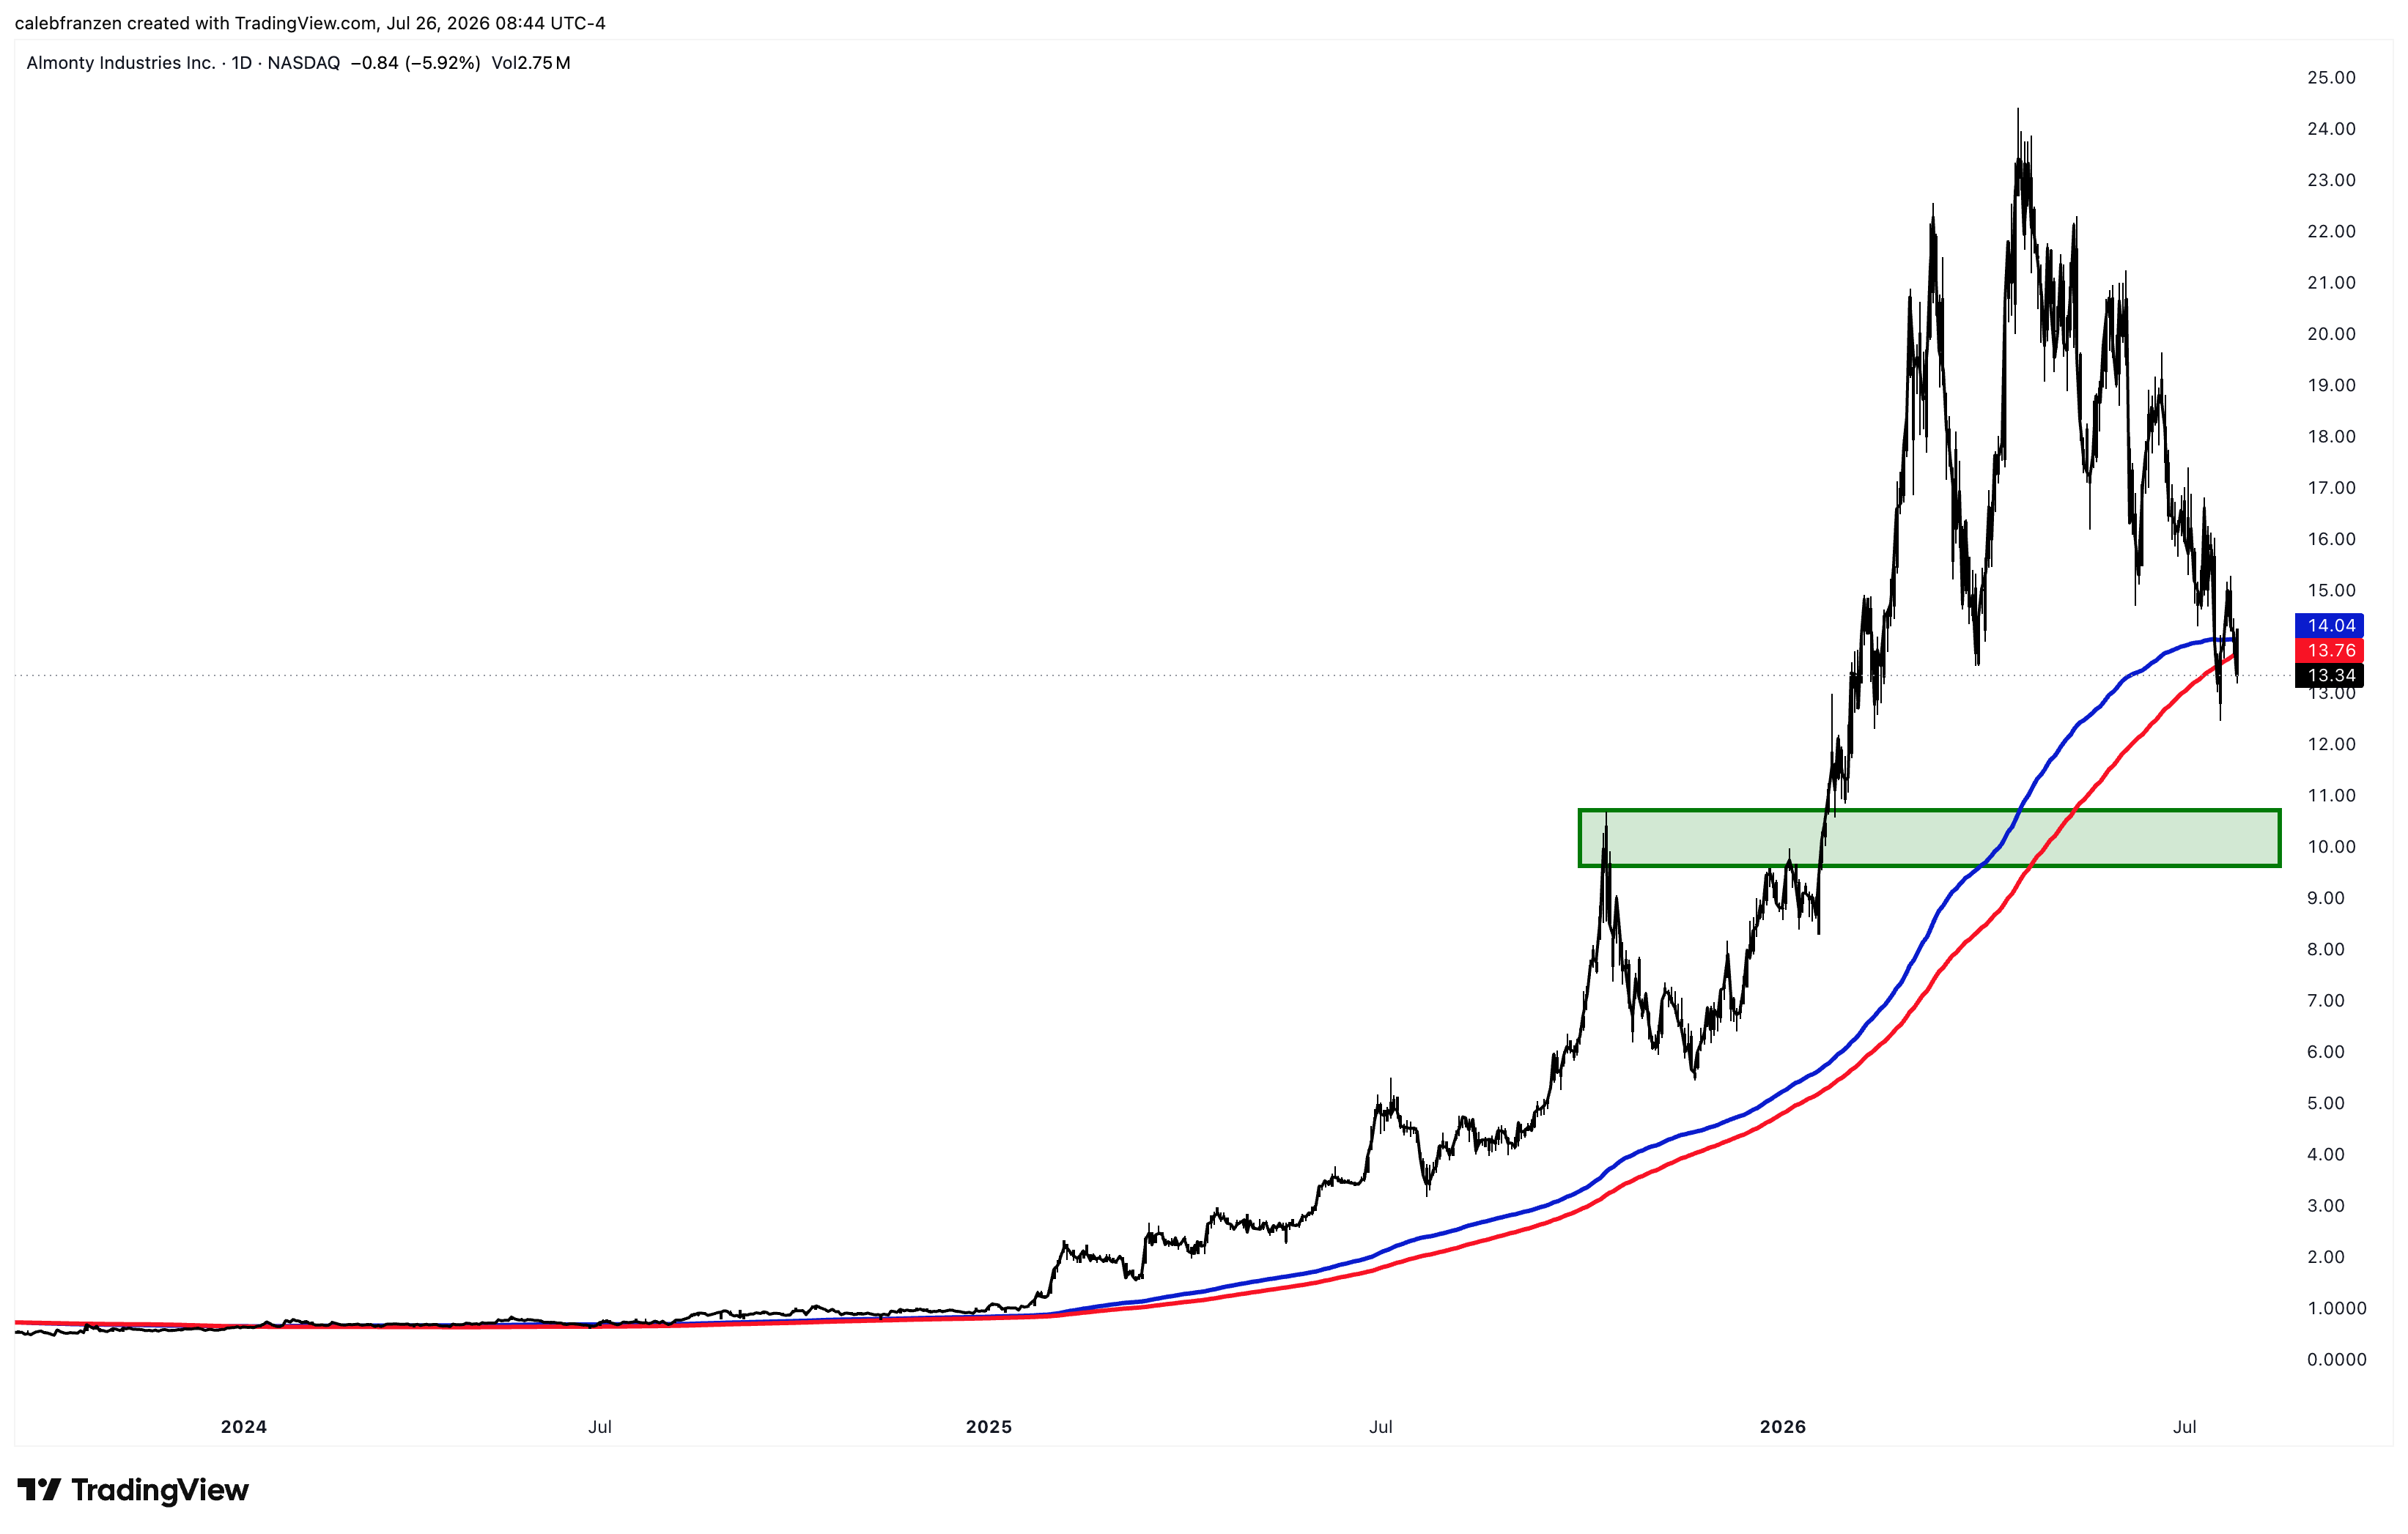
Invalidating its 200-day MA cloud with an official close below the range… which means that it’s officially off limits until price can manage to secure a daily close back above the 200-day MA cloud. It could get interesting again around $10/share for a “breakout, retest, rebound” setup on the late-2025 highs.