

Investors,
I don’t know what’s going to happen next.
Up, down, sideways… your guess is as good as mine.
What I do know is that we’re in an uptrend.
And sustained uptrends produce bull markets.
And bull markets are just a series of higher highs and higher lows.
By definition, this means that half of a bull market requires a consolidation.
It’s our job as investors to recognize this basic truth and then figure out the best plan of action to manage both our emotions and our capital during the hardest part of a bull market — the production of a higher low.
So make no mistake about it…
We are in a bull market.
Just look at the S&P 500:
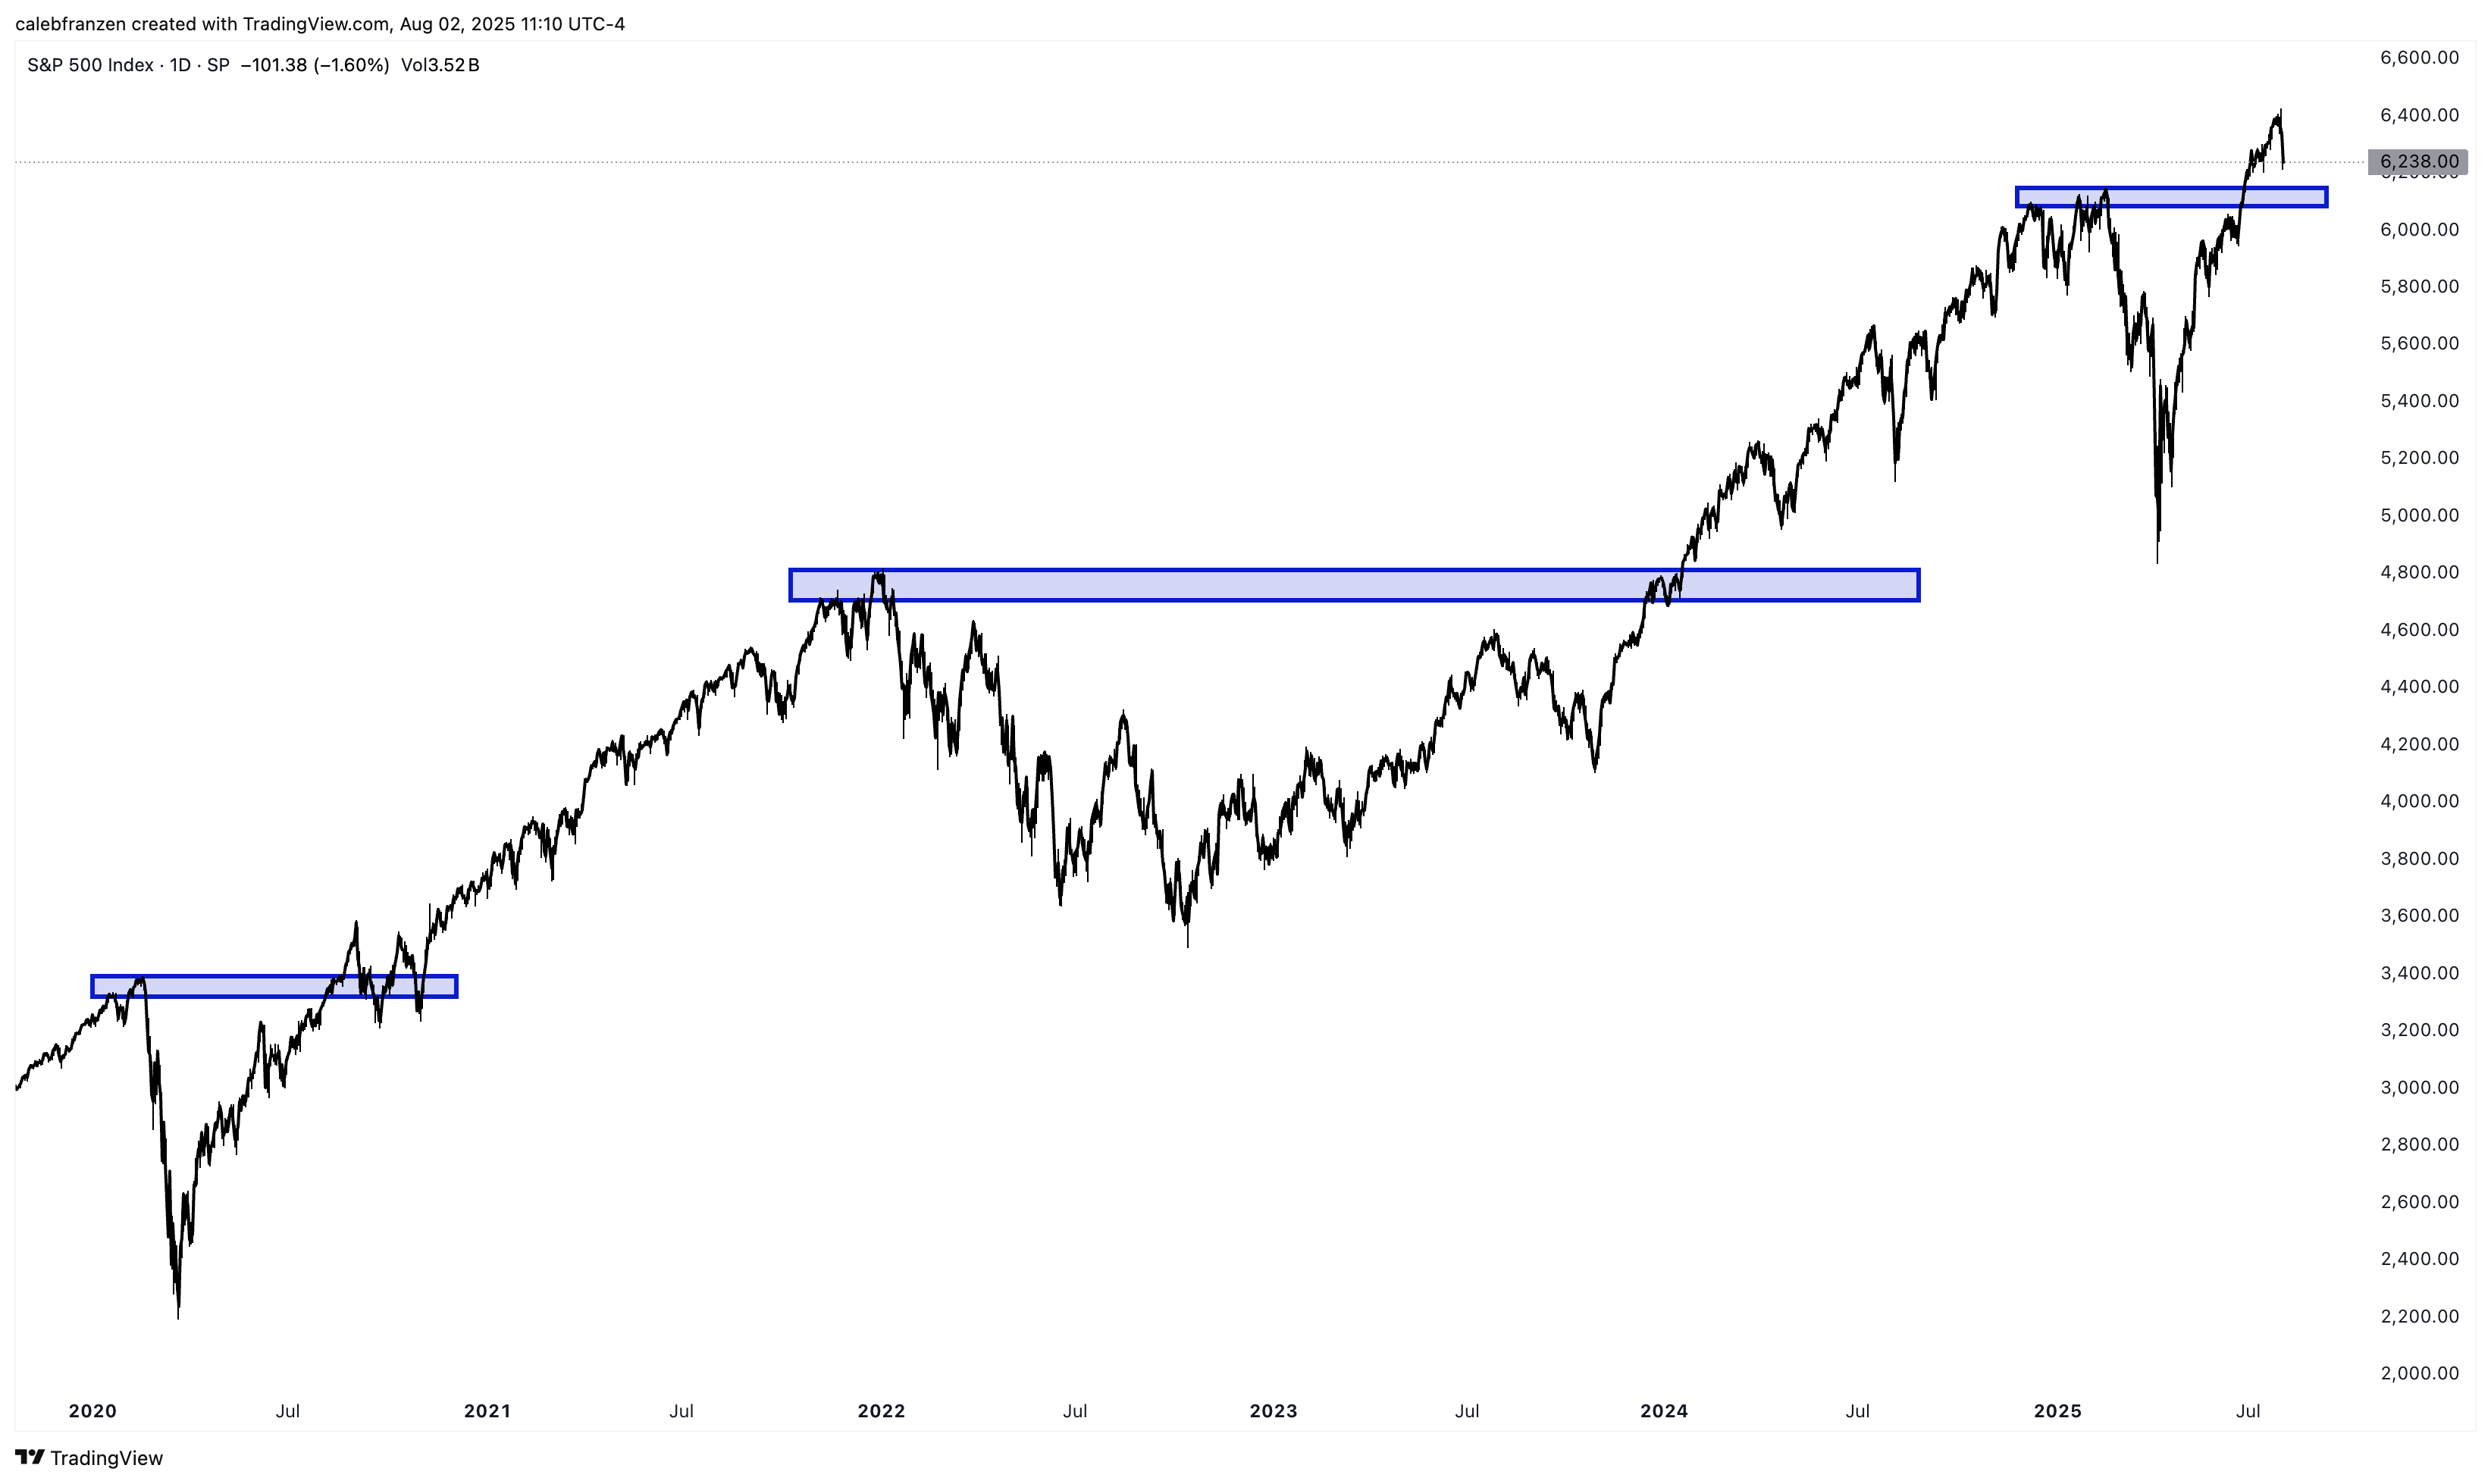
All I see is higher highs and higher lows.
One aspect of this chart that immediately stood out to me is the similarity between the current environment and the price action in 2020: a rapid collapse in asset prices caused by an exogenous variable (uncertainty around COVID and tariffs), followed by a massive V-shaped recovery and breakout to new all-time highs.
Notice the choppiness after that breakout in September - November 2020?
The “breakout, retest, rebound” setup worked in hindsight, but failed in real-time.
Then the market ripped for 13 straight months.
I don’t want to miss out on that opportunity, even if it requires a bit of pain first.
Let’s take a look at one of my favorite intramarket relationships right now…
Specifically, the relative performance of Software vs. the equal-weight S&P 500:
Before I share the chart, I want to explain why this ratio is so significant.
Software stocks are just high-octane technology stocks.
Technology stocks are just high-octane stocks.
And equal-weight S&P 500 represents “stocks” in general.
If a high-octane asset is outperforming a lower-octane asset, then the market has strong (and rising) levels of risk appetite, which is exactly what we see during bull markets.
Essentially, high-octane outperformance vs. low-octane CONFIRMS the bull market!
So, is this bull market being confirmed by one of my favorite intramarket indicators?
Yes!
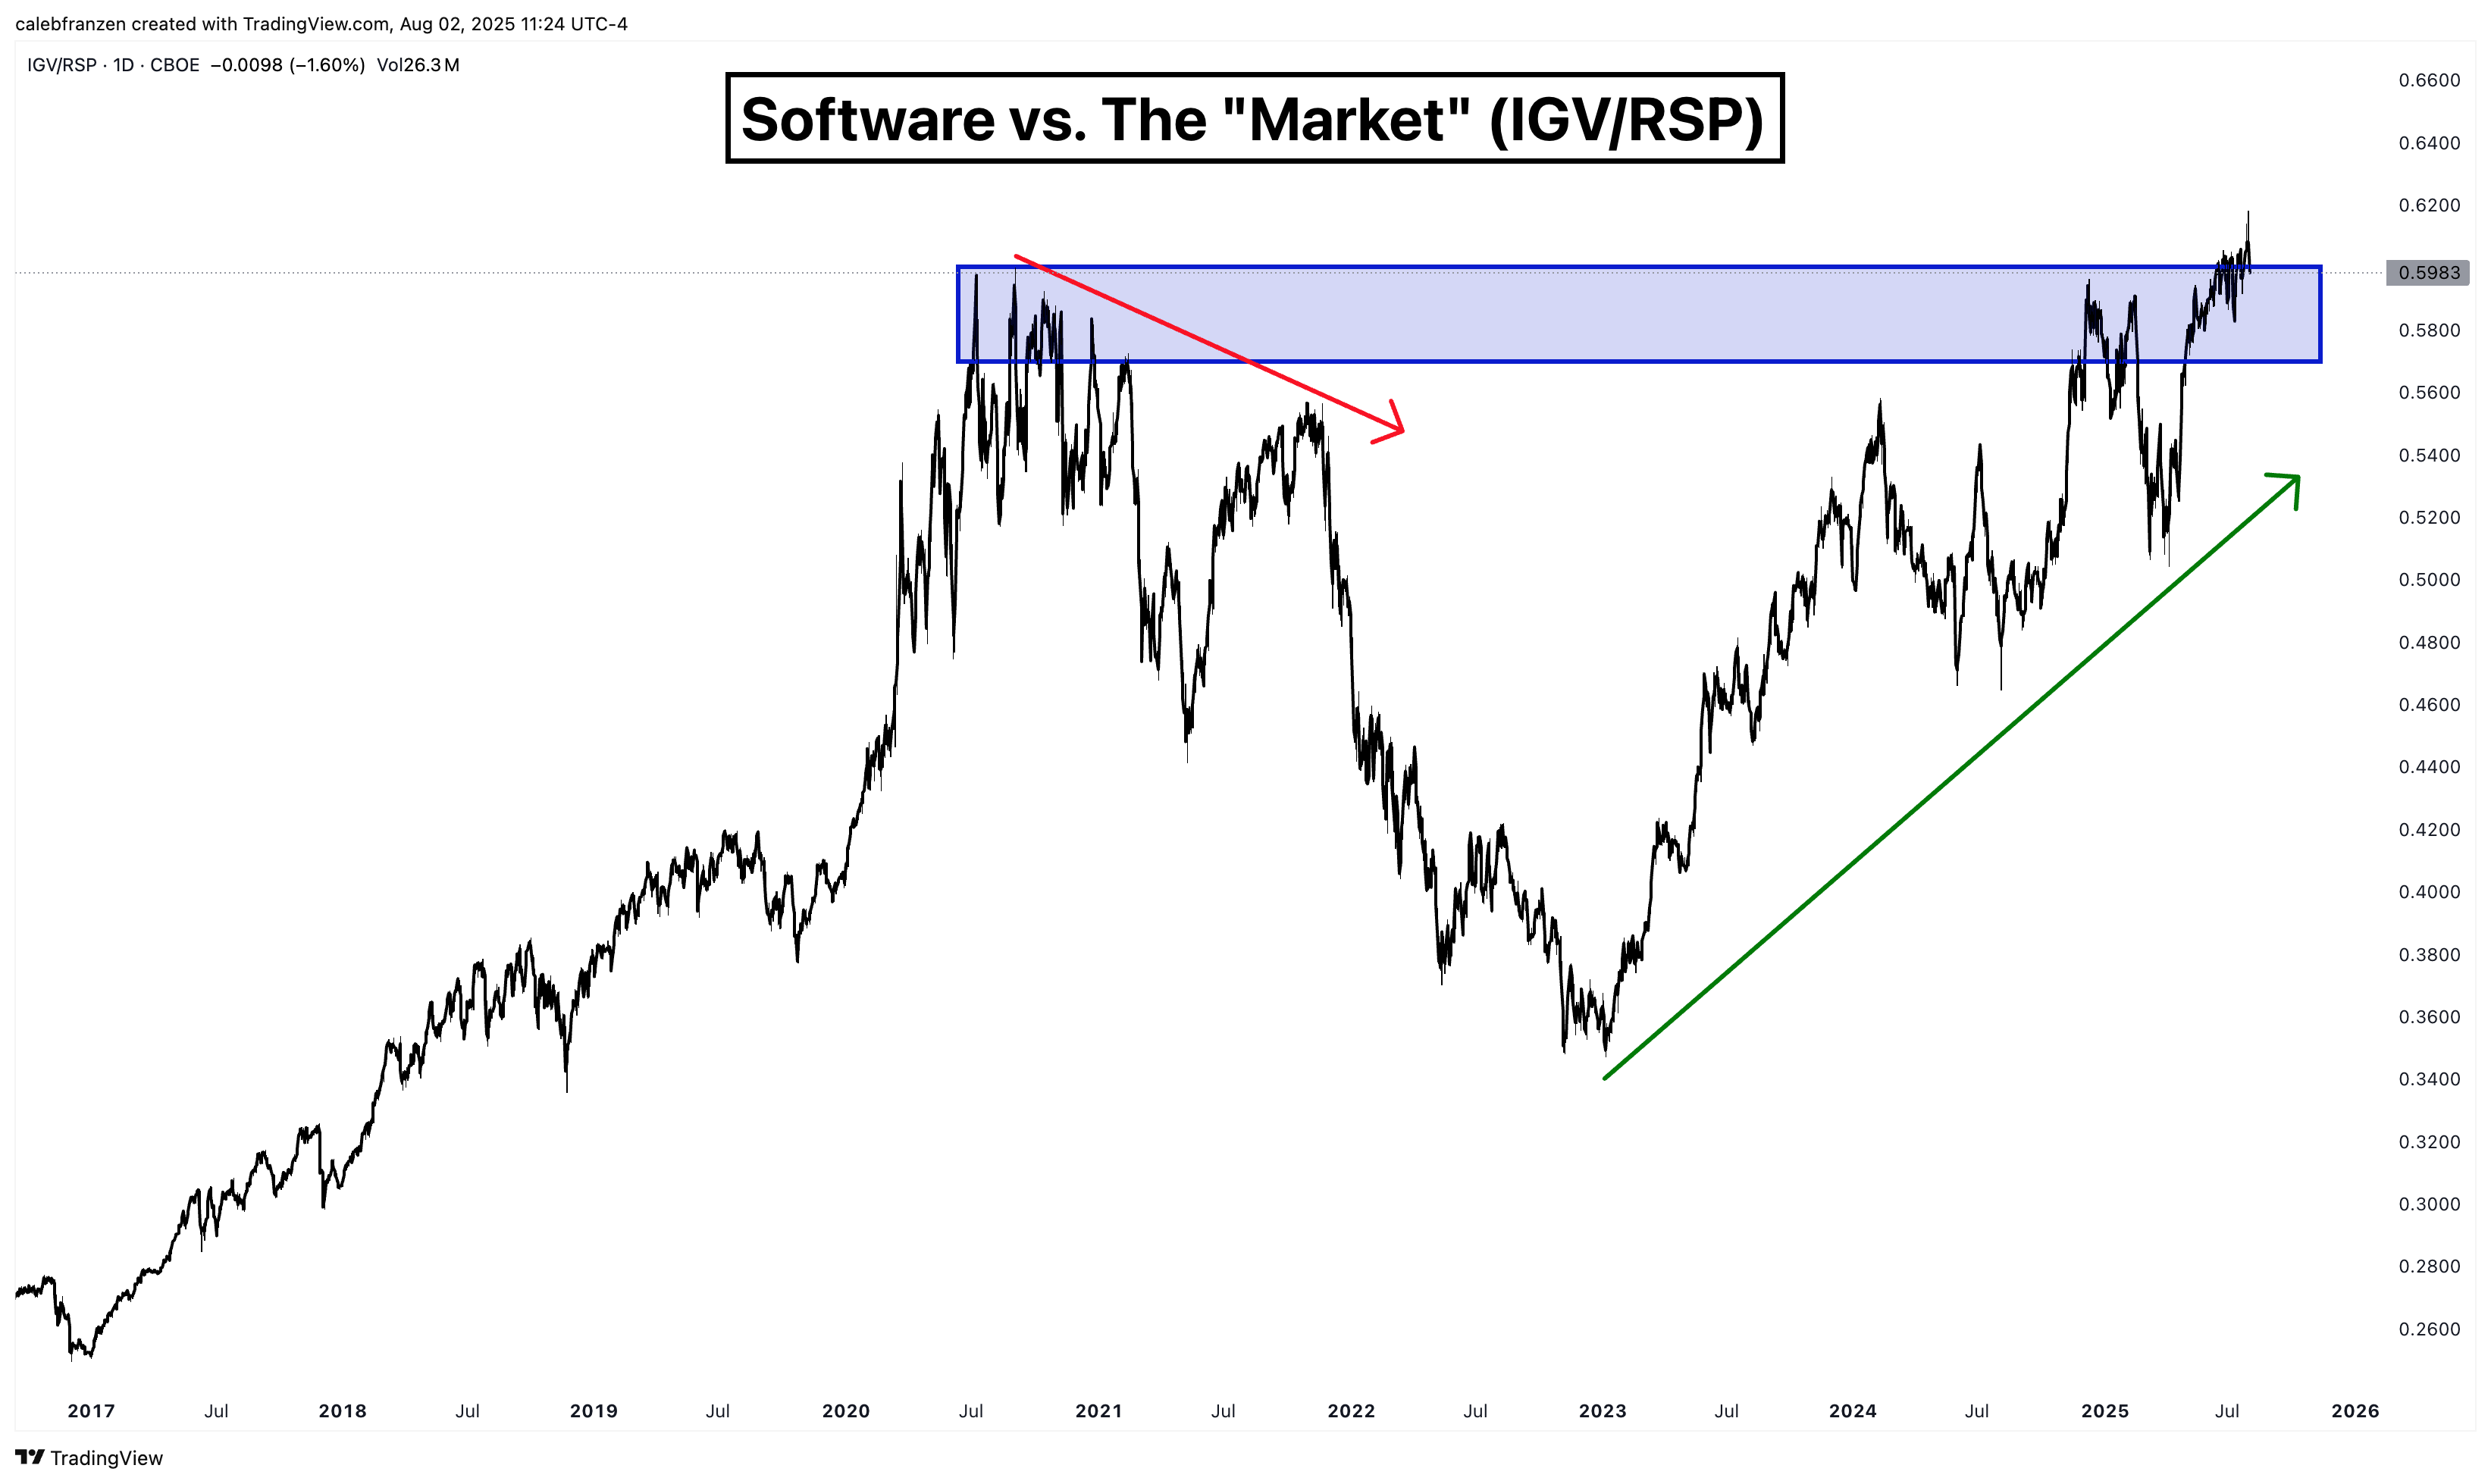
In fact, after a 5-year consolidation, IGV/RSP is now making new all-time highs!
That doesn’t happen during a low/waning risk appetite environment.
That doesn’t happen during broad-market downtrends.
On the contrary, it exclusively happens during bull markets and sustained uptrends.
But we don’t need to just look at this intramarket indicator…
We can look at growth relative to value (VUG/VTV).
We can look at high-beta relative to low volatility (SPHB/SPLV).
We can look at industrials relative to consumer staples (XLI/XLP).
We can look at Bitcoin relative to the Value Line Geometric Index (BTC/VALUG).
Every single one of these (and plenty of others) are telling us the same thing…
Risk appetite is rising.
We are in a sustained bull market.
We have an opportunity to produce a higher low.
So my plan is to let the market to do whatever it needs to do, sit through the uncertainty and the discomfort in the short-term, and let the uptrend stay intact.
This is the hard part of the bull market.
It inherently requires faith that the trend will stay intact.
But because I’m adaptable and flexible, my assumption is that the trend should stay intact and I’ll have a variety of criteria to signal if and when it does change.
Right now, none of those criteria are flashing.
Best,
Caleb Franzen,
Founder of Cubic Analytics
👍👍
Correct. Only people with strategy know a bit more so they can outperform people without strategy.