But it’s our job as investors to navigate that chaos with poise.
We’ve witnessed a massive V-shape recovery for the past two months for U.S. stocks and risk assets, in which the riskiest of assets have performed the best.
We endured the sharpest selloff since COVID, coupled with the highest levels of volatility since COVID, and have since experienced the fastest & strongest recovery since COVID.
Is this ongoing rally going to stay intact and maintain the pace of its ascent?
Based on data, I’d say “yes” to the former and “no” to the latter.
Regardless of risks that may or may not be important to the market (see yesterday’s free report on how I’m viewing geopolitical dynamics to analyze the market), we must objectively recognize that the breadth thrust in April, followed by a recovery above key EMAs on May 1st, and then the momentum thrust on May 14th, are key signs of a bull market.
I don’t know about you, but I was taught that the best way to make money as an investor is to be long risk assets during a bull market.
Isn’t that what we’re all here to do?
I can’t speak for the rest of you, but I know what my answer is.
Thankfully, the breadth thrust, EMA recovery, and momentum thrust were all characteristics that I shared with investors BEFORE they occurred as key criteria to shift me back into a bullish stance.
As those boxes got checked, one by one, I became incrementally more optimistic.
Here’s the proof:
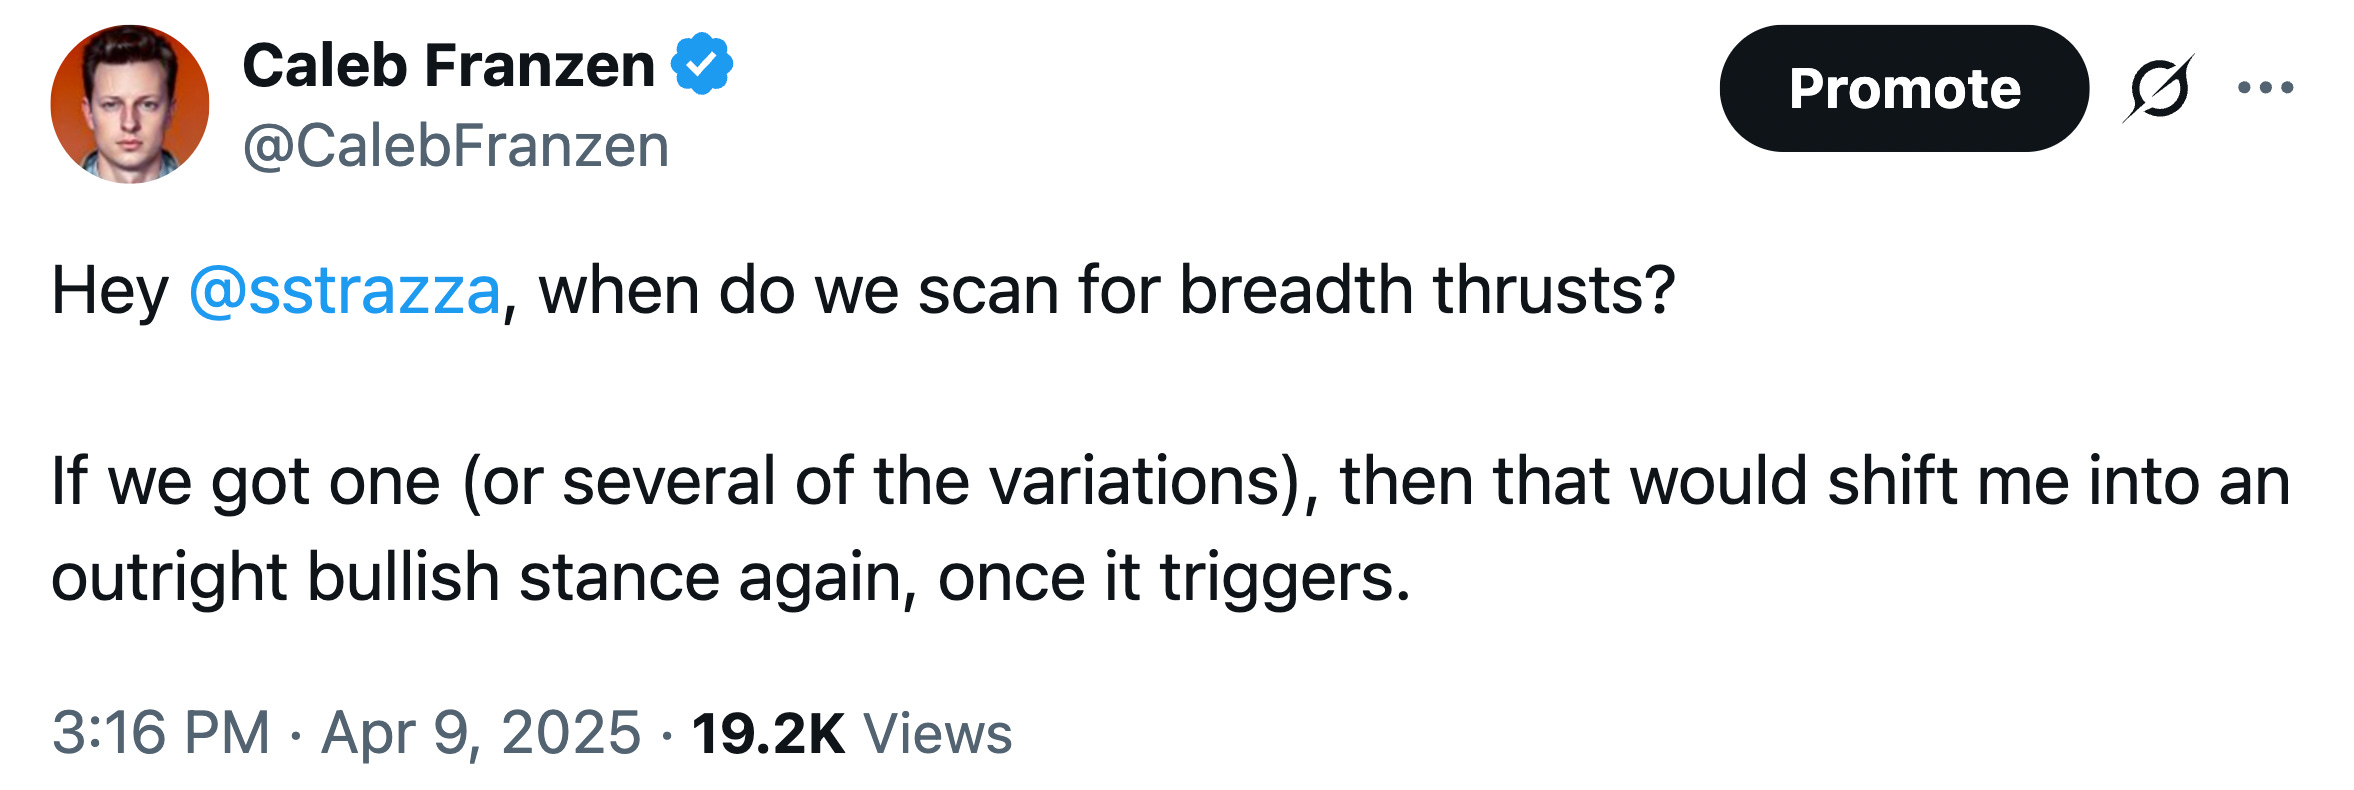
Regarding the breadth thrusts, I called this out in the depths of the selloff, but just two days after what we now recognize as the lows in early April (also, I want to give a huge shoutout to Steve Strazza).
Regarding the EMAs, I’ve already established this point several times.
In particular, I highlighted two sets of EMA bands:
The 21, 55, 100, and 200-day EMAs
The 26-week and 52-week EMAs (half year + full year moving average)
Once these recoveries and breakouts occurred at the start of May, that gave an “all clear” message to ensure that I’d be late and right vs. early and potentially wrong.
Finally, the momentum thrust (different than a breadth thrust) occurred on May 14th.
I’m specifically referring to the 60-day Williams%R, which I shared with investors BEFORE it even flashed as a potential bullish signal and then reiterated on May 18th in my report titled “The V-Shape Recovery”.
This was in a premium report, exclusive for paid members, but I’ll gladly share the exact analysis from the section of that report:
“A Bullish Signal Just Flashed:
One of the other key indicators that I’ve referenced, specifically for the S&P 500, is the 60-day Williams%R Oscillator and the importance of having it reach “overbought”.
I highlighted the significance of this indicator and now it’s finally here…
The S&P 500 completed a full oscillation from oversold to overbought on Wednesday [May 14th].
The S&P 500 has been higher 1 year later each time this signal has flashed since 2020.
So as we think about how this signal fits within the context of a broader bullish environment (price > EMAs), how should we think about the significance of this data?
We should automatically become even more bullish!”
Absolutely nailed it.
This is the power of objective & data-backed research.
We use pure analysis and price action to make a determination about having a proper bias and then focus on how to manage risk in the event that our bias is incorrect.
I know that I keep pounding the table on this, but I just can’t say it enough because this is literally the name of the game for investors who are solely focused on making money in the market (and keeping as much of it as possible).
And again, that’s exactly why I’m here… to make and keep as much as possible from the market, and to show you the exact tools, strategies, and methods that I’m using to analyze the market and make actual investment decisions.