My Recession Signal Just Flashed...
Investors,
Commercial banks in the United States are decreasing the pace with which they are lending, which shouldn’t be much of a surprise given the bank-specific concerns and the macro uncertainties that remain ahead. Looking at the YoY rate of change for loans and leases as of 5/31/23, it’s clear that credit creation is decelerating rapidly:
While still growing at a pace of +7.4% YoY, the plummeting rate of change is emblematic of banks becoming defensive relative to last year and of businesses & consumers having less of a demand for credit.
Given the sharp (and ongoing) contraction in deposits on a YoY basis — the steepest contraction in the history of the data series — I fully expect to see loans & leases decelerate at a faster pace going forward.
In addition to a variety of economic data, these two datapoints reaffirm my outlook for further disinflation in headline CPI, PPI, and PCE in the months ahead.
Before diving into the full analysis in this report, I’d like to thank the team at MicroSectors and REX Shares for their continued sponsorship!
For full transparency, I am still long $GDXD, their 3x inverse gold miners ETN; however, I did take profits this week by securing +25% gains on some shares.
Macroeconomics:
This week was full of strong labor market data, though there was certainly some weakness when diving deeper into the data. Nonetheless, the most appropriate way to describe the labor market is that it’s resilient and dynamic — the two adjectives I’ve been using since 2022.
The labor market is on the precipice of “normalization”, with the unemployment rate ticking higher, average hourly earnings decelerating, the quits rate declining and labor force participation remaining unchanged near pre-COVID levels.
Is the labor market perfect? No. However, it’s historically tight by a variety of metrics and I don’t want to let “perfect” be the enemy of “good”.
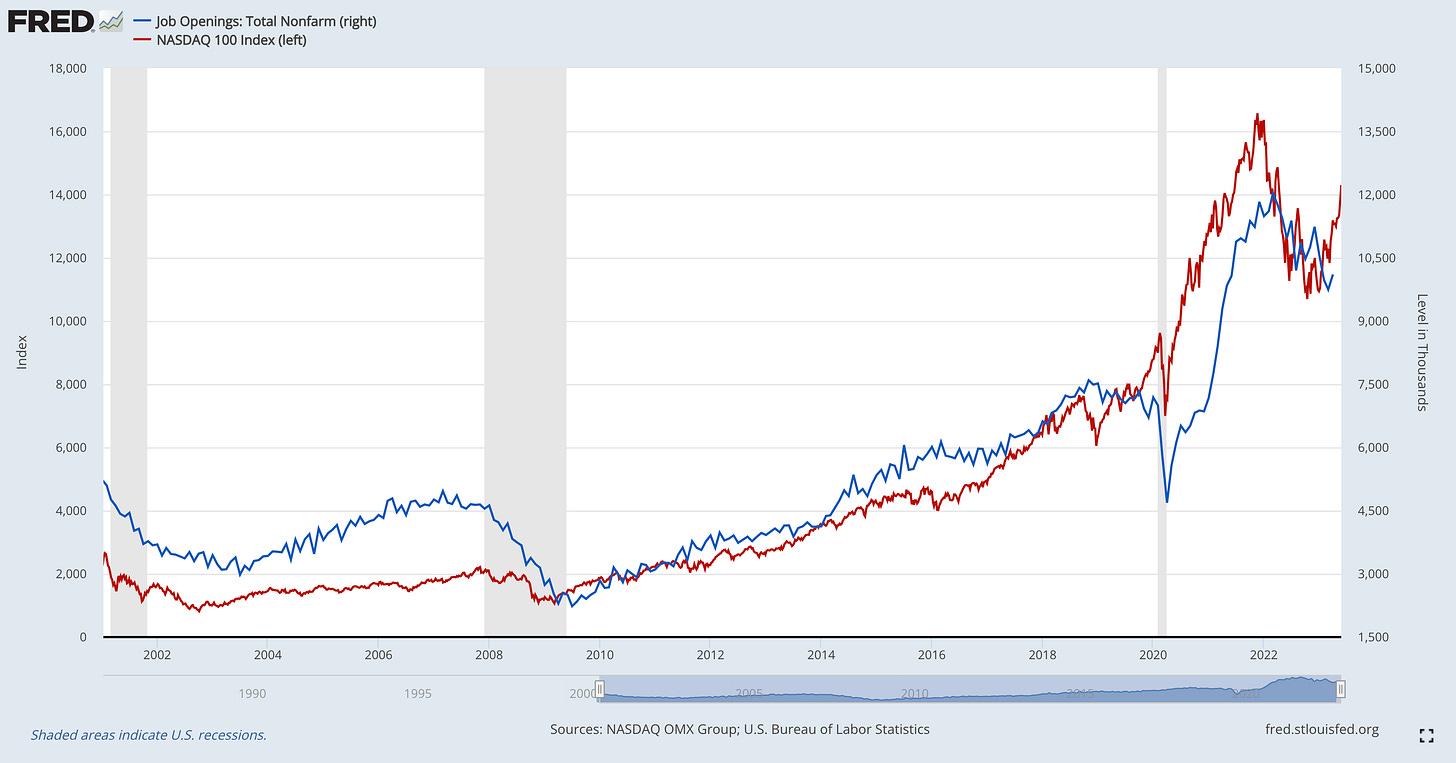
Job openings, which traditionally decline during an economic slowdown, contraction, and/or recession, jumped to 10.1M as of 4/30/23 from 9.74M in the prior month. While I expect to see JOLTS decline, we should expect to see this types of upside surprises within a broader downtrend. Given the ongoing strength in the stock market, the increase in job openings is actually unsurprising:
With the Nasdaq-100 reaching new 52-week highs on Friday, I think we might even see JOLTS for the month of May come in higher than April’s 10.1M and I also wouldn’t be surprised if the April data gets revised higher. Just something to think about…
Staying with the JOLTS data, we can update our view of disinflation based on the quits rate, which inched lower from 2.5% to 2.4% in April. With a clear correlation between quits and the YoY headline CPI inflation rate, this bodes well for further disinflation in the months ahead, particularly since the quits rate peaked a few months before the YoY percent change in headline CPI.
The nonfarm payroll data for May 2023 also reaffirms disinflationary trends, focusing specifically on average hourly earnings (nominal) and total hours worked. Both metrics declined relative to their respective levels in April, generally hinting towards less aggregate income growth.
While average hourly earnings growth is still elevated relative to historical trends, this normalization is likely to reduce inflationary pressures and therefore exacerbate disinflationary trends. However, the decline in average hours worked is fundamentally worrisome for the economy, indicating that companies are prioritizing part-time workers over full-time employees.
While this decline isn’t preferable, it’s worth noting that average weekly hours of all employees has been steadily declining since January 2021, so this isn’t anything new! In fact, this particular datapoint fluctuated around this level for nearly 10 years between 2010 and 2020. In other words, this is normal for the U.S. economy.
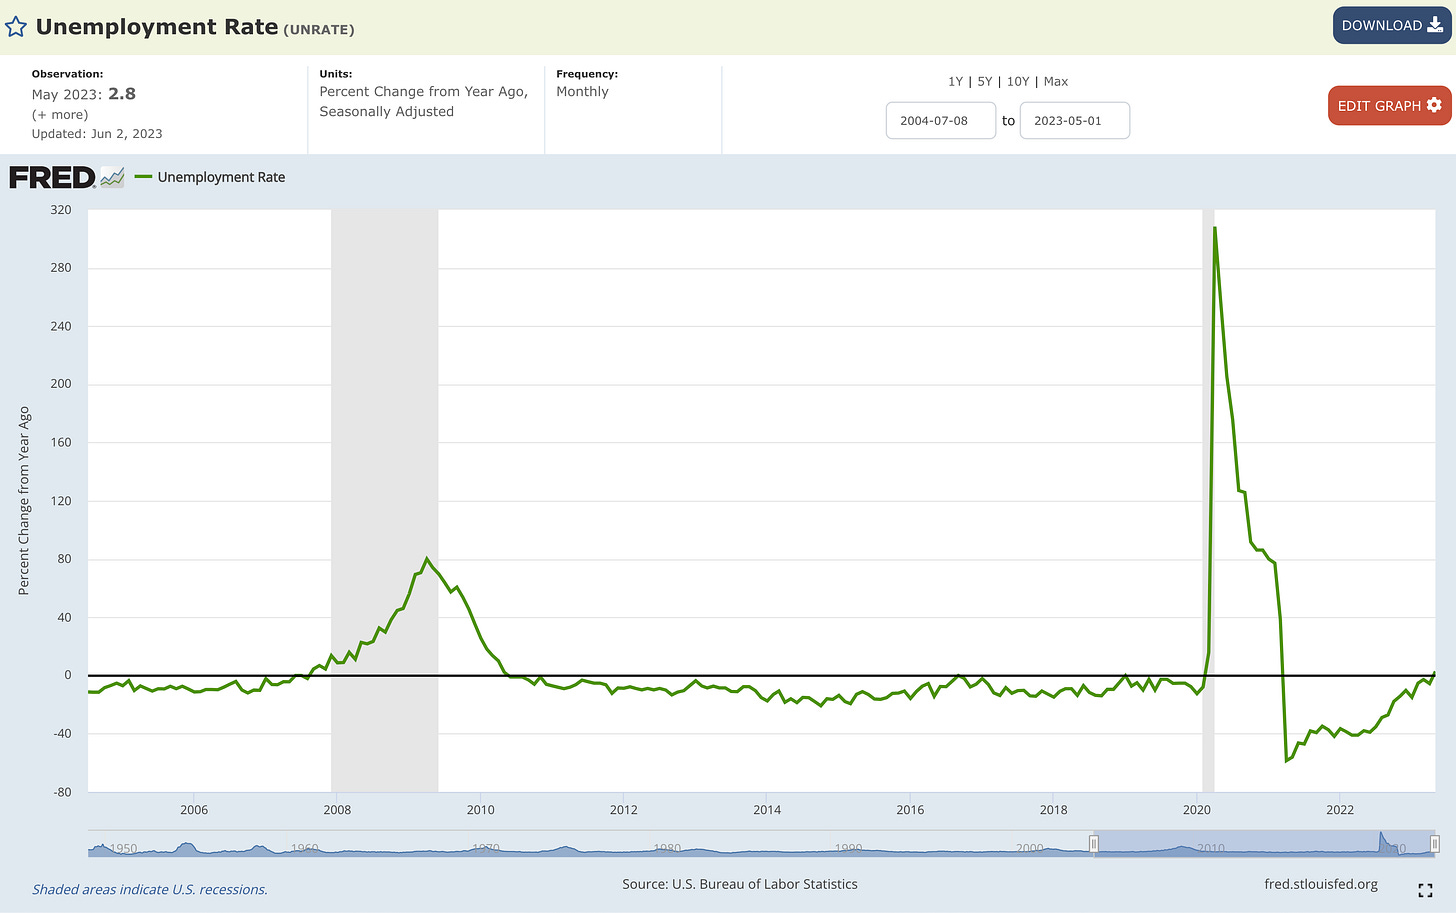
As a final note for labor market data, I saved the best for last: the YoY rate of change in the unemployment rate.
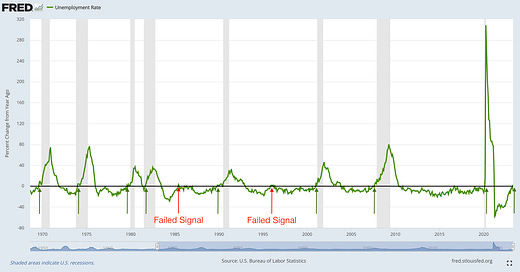
This is a specific metric which I’ve been sharing since June 2022, analyzing how quickly the unemployment rate is rising/falling relative to where it was one year ago.
With the unemployment rate reaching 3.7% in May 2023 (vs. 3.6% in May 2022), this marks the first YoY increase in the unemployment rate in a post-COVID era. While a +2.8% increase YoY isn’t a worrisome increase, it is an increase.
Why is this niche metric important?
Because it’s historically been a great recession indicator. Going back to 1970, this signal has an 80% accuracy of predicting a recession, with 8/10 accurate signals.
I’ve been waiting for this signal since June 2022, when I first discovered it in my analysis. Now that it’s here, I’m going to listen and acknowledge a heightened risk of a recession over the next 4-8 months. While we’ve seen resilient economic data so far in 2023, I think this forward-looking indicator is foreshadowing weakness ahead. As I mentioned in my 2023 outlook, published on January 1st, a recession was my base-case for the year. With an 80% accuracy, this signal reaffirms my prediction; however, I acknowledge the possibility that the recession could arrive in Q1 2024.
Stock Market:
Building on the analysis directly above, it’s key to recognize that this signal has bearish stock market implications. Clearly, recessions aren’t good for stocks in the short-term, though they have certainly provided long-term investors with extremely attractive opportunities to buy assets on discount. Thankfully, this indicator reaffirms exactly this point.
Short-term pain = long-term gains.
Looking at the chart below, we can see an inverse relationship between:
YoY % change in the unemployment rate 🟢
YoY % change in the Nasdaq-100 🔵
Once the derivative of unemployment turns positive, stocks typically suffer. History proves this to be true, unequivocally!
With both variables moving higher, the conclusion is that either the labor market is wrong or the stock market is completely detached from reality. Either way, I don’t expect for this positive correlation to last for more than a few months.
Stocks have soared since their Q4 2022 lows, making gains of:
Dow Jones $DJX: +17.8%
S&P 500 $SPX: +22.7%
Nasdaq-100 $NDX: +39.4%
Most of these gains have occurred since the start of the year, meaning that the indexes have produced historically strong 6-month returns. Is that market euphoric? I don’t think so. On Twitter and personal conversations that I’m having with investors, there’s still an intense amount of doubt about the ongoing rally. Investors are scratching their heads, and many of them are justified to be confused about this price action.
While I had a bearish outlook at the start of the year, I became markedly bullish in mid-March after the failures of Silicon Valley Bank and SBNY. Recognizing that the troubles were contained within the financial sector, I posted the following in Twitter:
Due to the containment of bank failures, the ongoing proof of disinflation, the belief that Fed tightening is almost over, and better-than-expected corporate earnings, this environment has fueled strong upside momentum for stocks.
Since the Tweet above, the indexes have generated the following returns:
Dow Jones $DJX: +6.1%
S&P 500 $SPX: +11.6%
Nasdaq-100 $NDX: +23.75%
Technology stocks (and mega-cap tech in particular) have put on a clinic of outperformance. While these gains are not sustainable, it’s unequivocal that the momentum thrust could produce more gains in the weeks/months ahead.
The CBOE Market Volatility Index $VIX has reached the lowest level since February 2020, just before the COVID-induced selloff.
Complacency isn’t necessarily a good thing, but I don’t think it’s outright bearish either. In fact, I think the market could become even more complacent over the short-term. The Fear & Greed Index is firmly in a position of “Greed” as of Friday’s close, but it’s been moving sideways since mid-April! In other words, I don’t think this is indicative of excess, speculation, or unwarranted enthusiasm.
Just remember, the market can stay irrational longer than you can stay solvent… and I don’t necessarily believe the market is being irrational right now, on the aggregate.
The market has looked (and continues to look) extremely bullish, so I have to respect that bullish momentum is likely to prevail. I have been trading to the upside in a few selective names with strong success, and I believe that there are easy levels in the market to manage risk against. I will be outlining these levels in tomorrow’s premium report for paid members, highlighting exactly where I would reduce long exposure and shift into a defensive/bearish stance.
To sign up for this report, please consider upgrading your subscription using the link below and take advantage of a 10% discount code:
Bitcoin:
The crypto market has been boring lately, with little action in either direction. After a brief period of excitement last week, the market was basically unchanged this week and there weren’t any major developments in terms of chart construction or fundamentals for Bitcoin.
However, I think this could change very quickly and I retain a bullish stance on BTC in the current environment. As such, I think crypto as a whole could perform very well and see a sudden & rapid move higher. In my research, I’ve found a variety of technical setups that look very attractive as short-term trades in the Altcoin market, and I might take positions as soon as this weekend.
Risk/reward is extremely strong right now, and I’m totally fine taking a loss of -3% to -5% in order to capture potential +20% to +40% gains.
If I’m wrong, I can live with it. If I’m right, the bills get paid.
I’ll be sharing each of these setups in tomorrow’s premium report, exclusive for paid members, which will dive into a variety of in-depth market dynamics and these individual trade ideas.
To sign up for this report, please consider upgrading your subscription using the link below and take advantage of a 10% discount code:
Best,
Caleb Franzen
DISCLAIMER:
This report expresses the views of the author as of the date it was published, and are subject to change without notice. The author believes that the information, data, and charts contained within this report are accurate, but cannot guarantee the accuracy of such information.
The investment thesis, security analysis, risk appetite, and time frames expressed above are strictly those of the author and are not intended to be interpreted as financial advice. As such, market views covered in this publication are not to be considered investment advice and should be regarded as information only. The mention, discussion, and/or analysis of individual securities is not a solicitation or recommendation to buy, sell, or hold said security.
Each investor is responsible to conduct their own due diligence and to understand the risks associated with any information that is reviewed. The information contained herein does not constitute and shouldn’t be construed as a solicitation of advisory services. Consult a registered financial advisor and/or certified financial planner before making any investment decisions.
This report may not be copied, reproduced, republished or posted without the consent of Cubic Analytics and/or Caleb Franzen, without proper citation.
Please be advised that this report contains a third party paid advertisement and links to third party websites. These advertisements do not constitute endorsements and are not necessarily representative of the views or opinions of the newsletter author. The advertisement contained herein did not influence the market views, analysis, or commentary expressed above and Cubic Analytics maintains its independence and full control over all ideas, thoughts, and expressions above. The mention, discussion, and/or analysis of individual securities is not a solicitation or recommendation to buy, sell, or hold said security. All investments carry risks and past performance is not necessarily indicative of future results/returns.


