Investors,
The first week of 2023 started with a bang, fueled by an avalanche of labor market data and big swings in the stock market. Before diving into specific economic data, the potential implications, and market dynamics, I’d like to welcome the 600+ new members of Cubic Analytics who joined the team in December 2022!
We’re growing at a rapid pace and I’m wide-eyed about the growth potential in 2023! If you’ve found any of my prior research to be insightful and are interested in helping contribute to our growth in 2023, please consider sharing this with colleagues, friends, and family members who want institutional-quality, free market research.
Macroeconomics:
There were four key labor market reports that were released this week, but I’ll focus on the JOLTS data (November 2022) and the Nonfarm Payrolls data (December 2022).
1. The Job Openings and Labor Turnover Survey continued to reflect dynamics that have been materializing for months, notably:
Job openings at the end of November were historically elevated at 10.458M, marginally lower than the prior month of 10.512M. Estimates were forecasting total openings of 10.0M, so this was a significant surprise to the upside.
The quits rate remained historically elevated at 2.7%, up slightly from 2.6% in the prior month. With an abundance of positions available and the opportunity to pursue larger salary increases, workers are capitalizing by switching companies to accept positions more aligned with their skills, interest, and career aspirations.
The layoffs rate remains historically low at 0.9%, consistent with the prior month. With employers still fighting to meet strong levels of demand, they’re fighting to retain their existing workforce and aren’t easily convinced to reduce the size of their teams.
On the aggregate, the JOLTS data continues to highlight the resilient nature of the labor market; however, we should expect to see headline job openings decrease in the months to come. Considering the long-term correlation between job openings and the Nasdaq-100, I’d posit that this deterioration could arrive sooner rather than later:
2. The Nonfarm Payrolls data also highlighted resilient labor market dynamics, though many are pointing out a clear deceleration in some key variables:
223,000 jobs were added to nonfarm payrolls, vs. estimates of 200,000 and prior month results of 256,000. While analysts were forecasting a weaker number, the deceleration vs. the prior month caught a lot of people’s attention.
The unemployment rate in December was 3.5%, vs. estimates of 3.7%. The initial result for the prior month was 3.7%, but this figure was revised lower to 3.6%. Either way, an unemployment rate of 3.5% is historically low! Since 1970, there are only 6 months where the unemployment rate reached 3.5% or less, and all of them had a rate of 3.5%:
September 2019
January 2020
February 2020
July 2022
September 2022
December 2022
The labor force participation rate, which typically has a positive correlation with the unemployment rate, actually increased in December, from 62.2% to 62.3%. Typically, we’d expect to see an increase in the LFPR push the unemployment rate higher; however, that wasn’t the case in December. Considering that it didn’t create headwinds for the unemployment rate, I think that this indicates “under-the-hood” strength within the labor market.
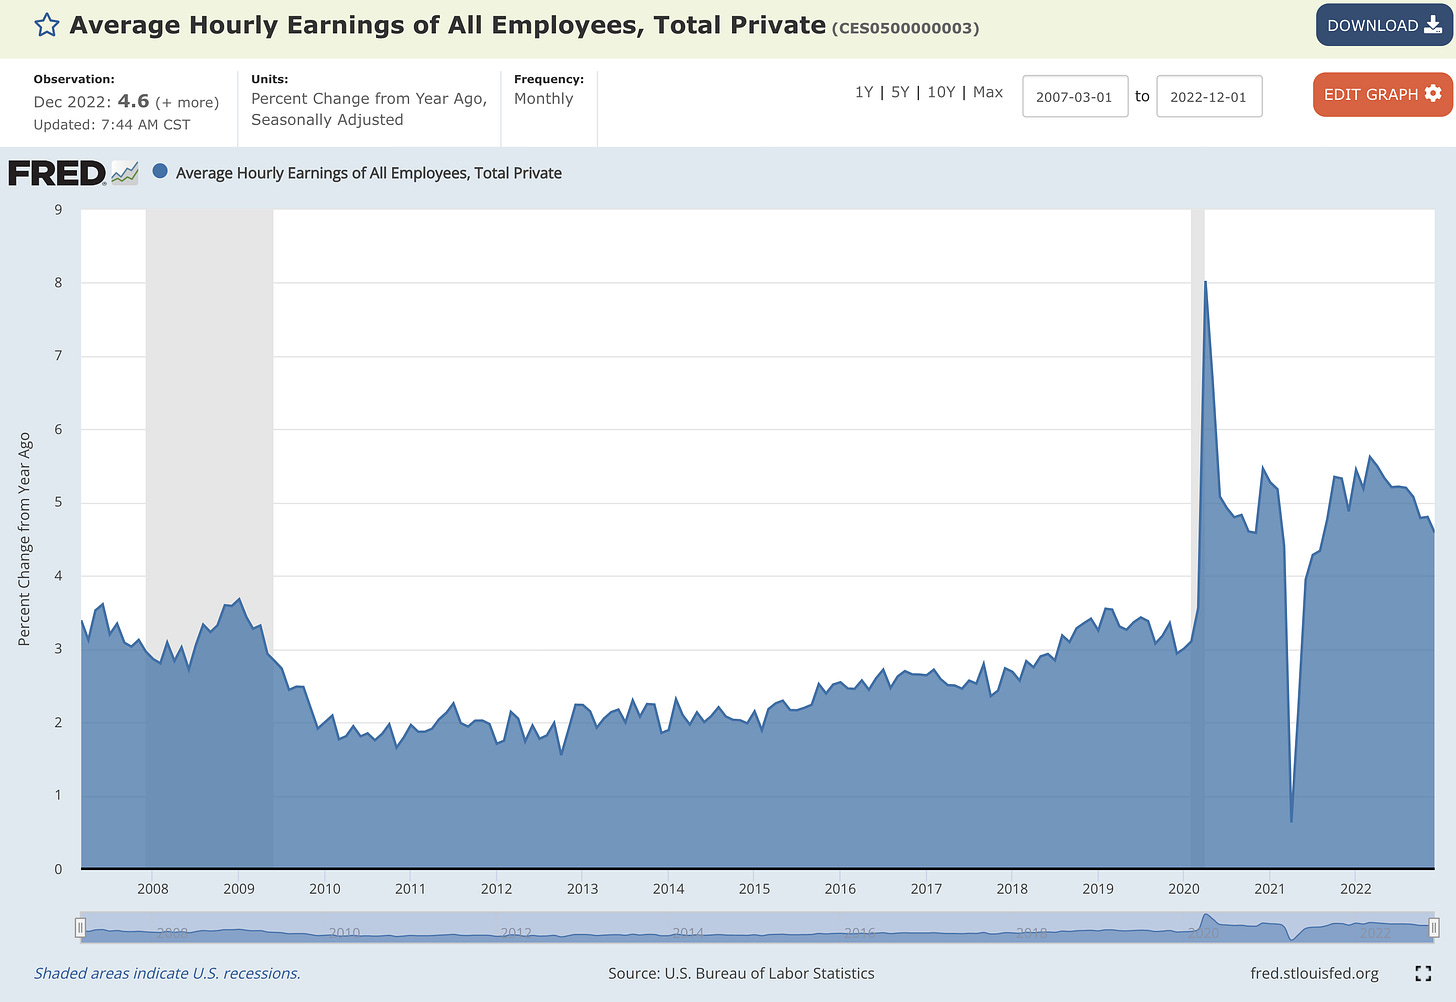
Average hourly earnings increased by +4.59% YoY, a moderate deceleration from the November result of +4.80%. The YoY rate of change peaked in March 2022 at a pace of +5.62% and has been steadily decelerating since then.
As a final note on the other labor market reports, ADP private payrolls increased by +235,000 vs. estimates of +150,000. Another significant beat was the initial unemployment claims for the past week, coming in at 204,000 vs. median estimates of 223,000 (the lowest level in 14 weeks).
Considering the weight of the evidence, the labor market is showing little weakness and continues to flex its muscles. With the Federal Reserve on an outright mission to soften the labor market, these latest developments indicate that there’s more work to be done. While some figures (job openings, nonfarm payrolls, average hourly earnings) are trending in the right direction, they are historically elevated. Other figures (unemployment and the quits & layoffs rates) are indicative of historic extremes that aren’t trending in the Fed’s preferred direction.
The Federal Reserve has tried to reduce inflationary pressures by reducing aggregate demand via three approaches:
Creating an inverse wealth effect by driving asset prices lower.
Increasing the cost of capital & making it harder to borrow.
Softening the labor market to reduce personal disposable income.
In 2022, they made progress on the first two aspects. In 2023, I expect that they’ll focus on the labor market in order to confirm a sustainable decline for inflation. In other words, there’s still plenty of work to be done regarding the labor market.
While backward-looking data for the labor market is resilient & dynamic, forward-looking economic indicators point towards more pain. The ISM Services PMI experienced a historic decline in December 2022, falling from 56.5 (expansionary) to 49.6 (contractionary). This was the first contractionary reading after 30 consecutive months of expansionary results. The consensus expectation was for a result of 55.0, so this was a complete disappointment. Aside from the COVID lockdown months in Q1 and early Q2 2020, this was the first reading below 50 (contractionary) since January 2008.
New orders, a subset of this data, declined from 56.0 to 45.2, the second-largest decline ever, aside from the COVID lockdowns. The ISM Employment Index was also in contractionary territory at 49.8, down from 51.5 in November. Consistent with recessionary dynamics, these relatively forward-looking indicators don’t instill a sense of optimism for where we might be headed.
Stock Market:
The holiday-shortened week was choppy for the broader market, in which the S&P 500 experienced three days of ±1% from the daily open to the daily close. While the S&P 500 was able to produce a positive weekly gain of +1.45%, all the gains were produced from Friday’s +2.28% return. The Nasdaq-100, which has struggled more than any other index, managed to close above the June 2022 lows, which I believe to be a positive development (so long as it can remain above it). Considering that this is the riskiest of the indexes with the most tech exposure, the Nasdaq’s underperformance shouldn’t come as a surprise.
From my perspective, I think that tailwinds are in place for value to outperform growth once again in 2023, highlighting the relative performance of the Dow Jones vs. the Nasdaq. For context, the Invesco Pure Value ETF RPV 0.00%↑ had a weekly return of +5.85% this week! Some of my favorite value funds to benefit from this theme are:
Invesco S&P 500 Pure Value ETF RPV 0.00%↑
Invesco Dynamic Large Cap Value ETF PWV 0.00%↑
WisdomTree Value ETF WTV 0.00%↑
iShares MSCI International Value ETF IVLU 0.00%↑
Each of these pay an attractive dividend, offer a degree of protection relative to other equities, and have been outperforming the broader market for more than 12 months.
Amazingly, value has been outperforming growth by a considerable margin since July 2020! By measuring the relative performance of RPV vs. the S&P 500, value ended the week at its highest level since January 2020!
It’s possible that value has gotten overextended relative to the S&P 500 since August 2022, but I certainly expect to see this multi-year uptrend continue in 2023.
Bitcoin:
Generally speaking, Bitcoin has experienced a complete lack of volatility over the past 6 weeks. The apex digital asset has been stuck in the mid-$16,000 range for the past three weeks. I’m focused on two major structural dynamics for Bitcoin:
The horizontal resistance range in red. This was support in Q2 and Q3’22, but flipped into resistance during the Q4 breakdown below the range. If/when we retest it again, I think there’s a high likelihood that price struggles to maintain upside momentum. If/when BTC is able to break above this range, I think it will increase bullish probabilities.
The diagonal support range in red. From the new cycle lows, I think we might be forming a potential support channel here. I don’t necessarily expect this range to remain effective going forward, but a failure to rebound on it could foreshadow more weakness ahead. Structurally, it seems very similar to the mini uptrend we experienced after the June 2022 lows, shown in the teal range.
Bitcoin was finally able to garner some momentum on Friday, briefly exceeding $17,000, but price has since fallen back into the $16.9k range. As crypto-specific fears loom regarding DCG, Silvergate, and more potential contagion events, it appears that investors are sitting on their hands after another historic drawdown. For the first time in Bitcoin’s history, price has experienced four consecutive down quarters. Price has currently spent 375 days below the 200-day moving average, the 2nd longest streak in its history (the longest was during the 2018 bear market at 384 days). Investors appear to have reached a degree of selling fatigue (for now), opting to ride things out.
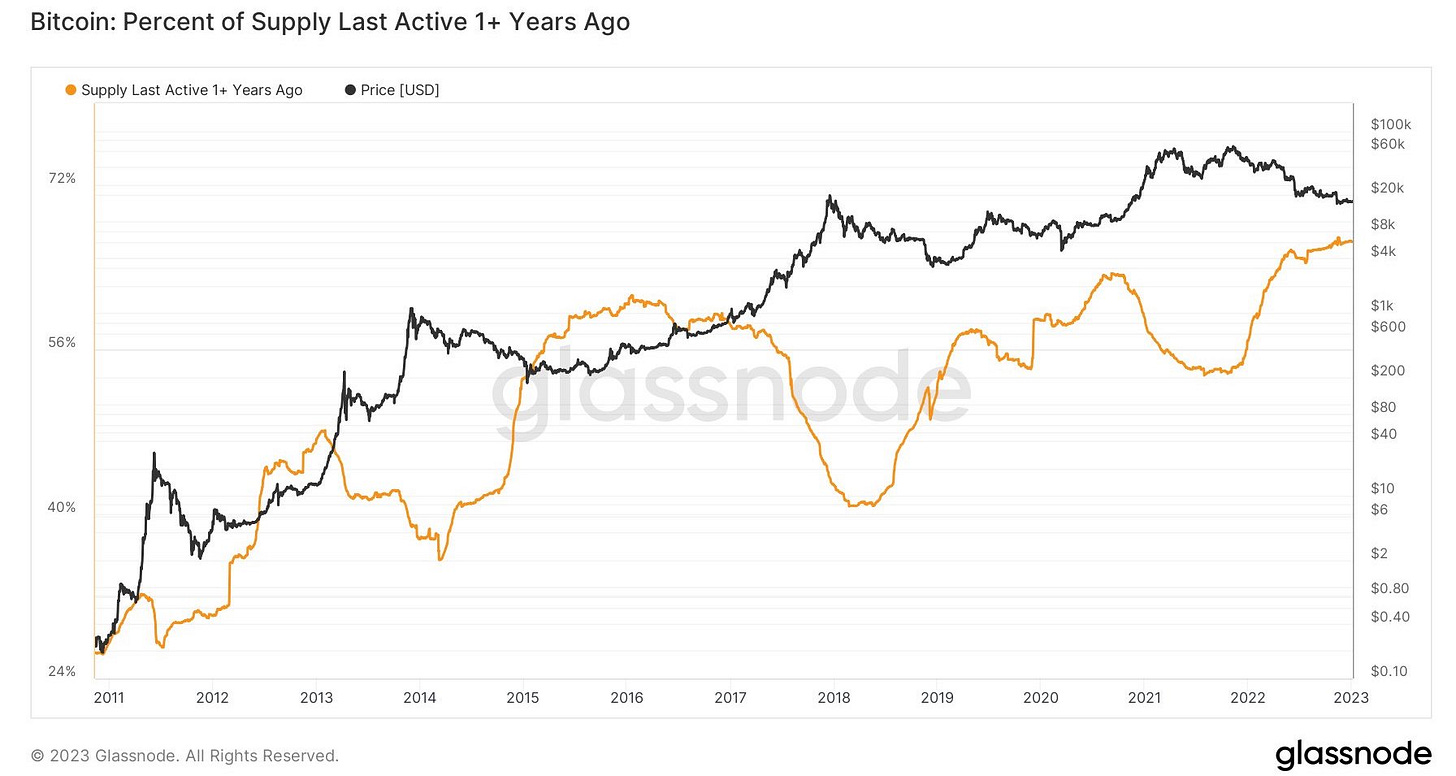
Using on-chain data, we can confirm some of this sentiment by analyzing the percent of Bitcoin’s supply that has been inactive for the past 1 year. According to this data, shared by Joe Burnett, 66.5% of Bitcoin’s total supply haven’t moved in the past 12+ months.
Bear market drawdowns appear to be characterized by an increase in this metric, while bull market peaks are characterized by a decline. With the percent of supply last active 12+ months ago stagnating at/near record highs, I think markets are getting primed for increased volatility in the coming 4-6 weeks.
Best,
Caleb Franzen
DISCLAIMER:
This report expresses the views of the author as of the date it was published, and are subjected to change without notice. The investment thesis, security analysis, risk appetite, and time frames expressed above are strictly those of the author and are not intended to be interpreted as financial advice. As such, market views covered in this publication are not to be considered investment advice and should be regarded as information only. Everyone is responsible to conduct their own due diligence, understand the risks associated with any information that is reviewed, and to recognize that the information contained herein does not constitute and should be construed as a solicitation of advisory services. Cubic Analytics believes that the information & sources from which information is being taken are accurate, but cannot guarantee the accuracy of such information.
This report may not be copied, reproduced, republished or posted without the consent of Cubic Analytics and/or Caleb Franzen, without proper citation & reference.
As always, consult a registered financial advisor and/or certified financial planner before making any investment decisions.


Don’t you think that the population ageing, which is inversely correlated with the political feasibility of relying on immigration to compensate for it, will lead to sustainably low levels of unemployment in OECD countries for the foreseeable future and hence structurally higher levels of inflation and/or FED tightening?
nice coverage as always, thank you, have a good weekend!