Investors,
I have a data-packed report for you today, which I’m super excited to share, but I’m also super excited about the performance of Palantir lately and I want to address the stock very quickly.
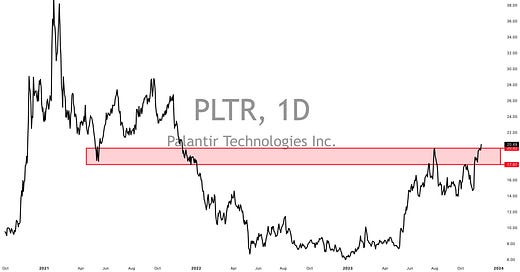
Palantir Technologies PLTR 0.00%↑ is up +219% YTD and just hit new 24-month highs during Friday’s session. In other words, the stock has now erased all of the losses suffered during 2022, a year where the stock fell -65%.
I bring this up for three reasons:
It’s not just 7 stocks that are going up, as the bears want you to believe. As I’ve been saying all year, this has been a tech-driven rally and the tech companies with the strongest fundamentals have been performing the best. Somehow, the bears think that’s a bad thing, but my only retort is: would you prefer if the worst & least innovative companies were going up the most? My guess is probably not.
Premium members of Cubic Analytics know that PLTR is one of the largest holdings in my long-term portfolio and that it’s a position that I’ve been adding to in 2023.
Premium members got to read my full analysis & review of the company’s fundamentals in July 2023 when I published “The Mysterious Company With A Clear Future”. In the report, I explained my investment thesis in the stock while analyzing both the qualitative and quantitative aspects of the company. My biggest complaint at the time was the valuation, which hasn’t necessarily been solved. As I say, things are usually expensive for a reason (buyers are willing to pay a premium for a myriad of factors). A Mercedes is more expensive than a Toyota. A Rolex is more expensive than a Casio. Channel Bleu is more expensive than Axe body spray. The same applies for certain stocks, especially when investors are willing to pay a premium for growth, innovation, successful management, clean balance sheets, etc.
If you want to read my PLTR analysis, you can access it below:
In the remainder of this premium report, here’s what you can expect to read about:
Analyzing S&P 500 internals, which continue to reflect bullish dynamics for the 3rd consecutive week. I discuss each of the key datapoints to highlight the most important trends taking place and broader market implications.
Reviewing the equal-weight version of the S&P 500 ($RSP), which is also flashing two extremely important signals right now. I don’t mean this lightly, one of the RSP charts is my favorite chart in the entire market right now because it has massive implications for the stock market.
A quick discussion of macro & financial conditions in order to understand how asset prices could be impacted.
Sharing the purchases that I made in my long-term portfolio this week, where I made substantial DCA’s across 14 stocks in 6 different sectors.
This report is packed with alpha, showcasing 9 different charts and a variety of different datapoints in order to create an objective review of ongoing market dynamics. To benefit from the full value of these reports and support my work as an independent analyst, consider upgrading to a premium membership today.
Let’s begin.


