


My Current Bitcoin Plan

Investors,
New orders are rising at their fastest levels on record, outside of the COVID era.
Specifically, the Philly Fed Diffusion Index for new orders increased from -3.6 to +42.9, resulting in a MoM change of +46.5 shown in the chart below.

This was the largest MoM increase in the history of the data series, outside of the COVID era bounce-back in June 2020 (which resulted in a MoM change of +52.1).
If we just look at the index itself, rather than the MoM change shown above, we see the following:
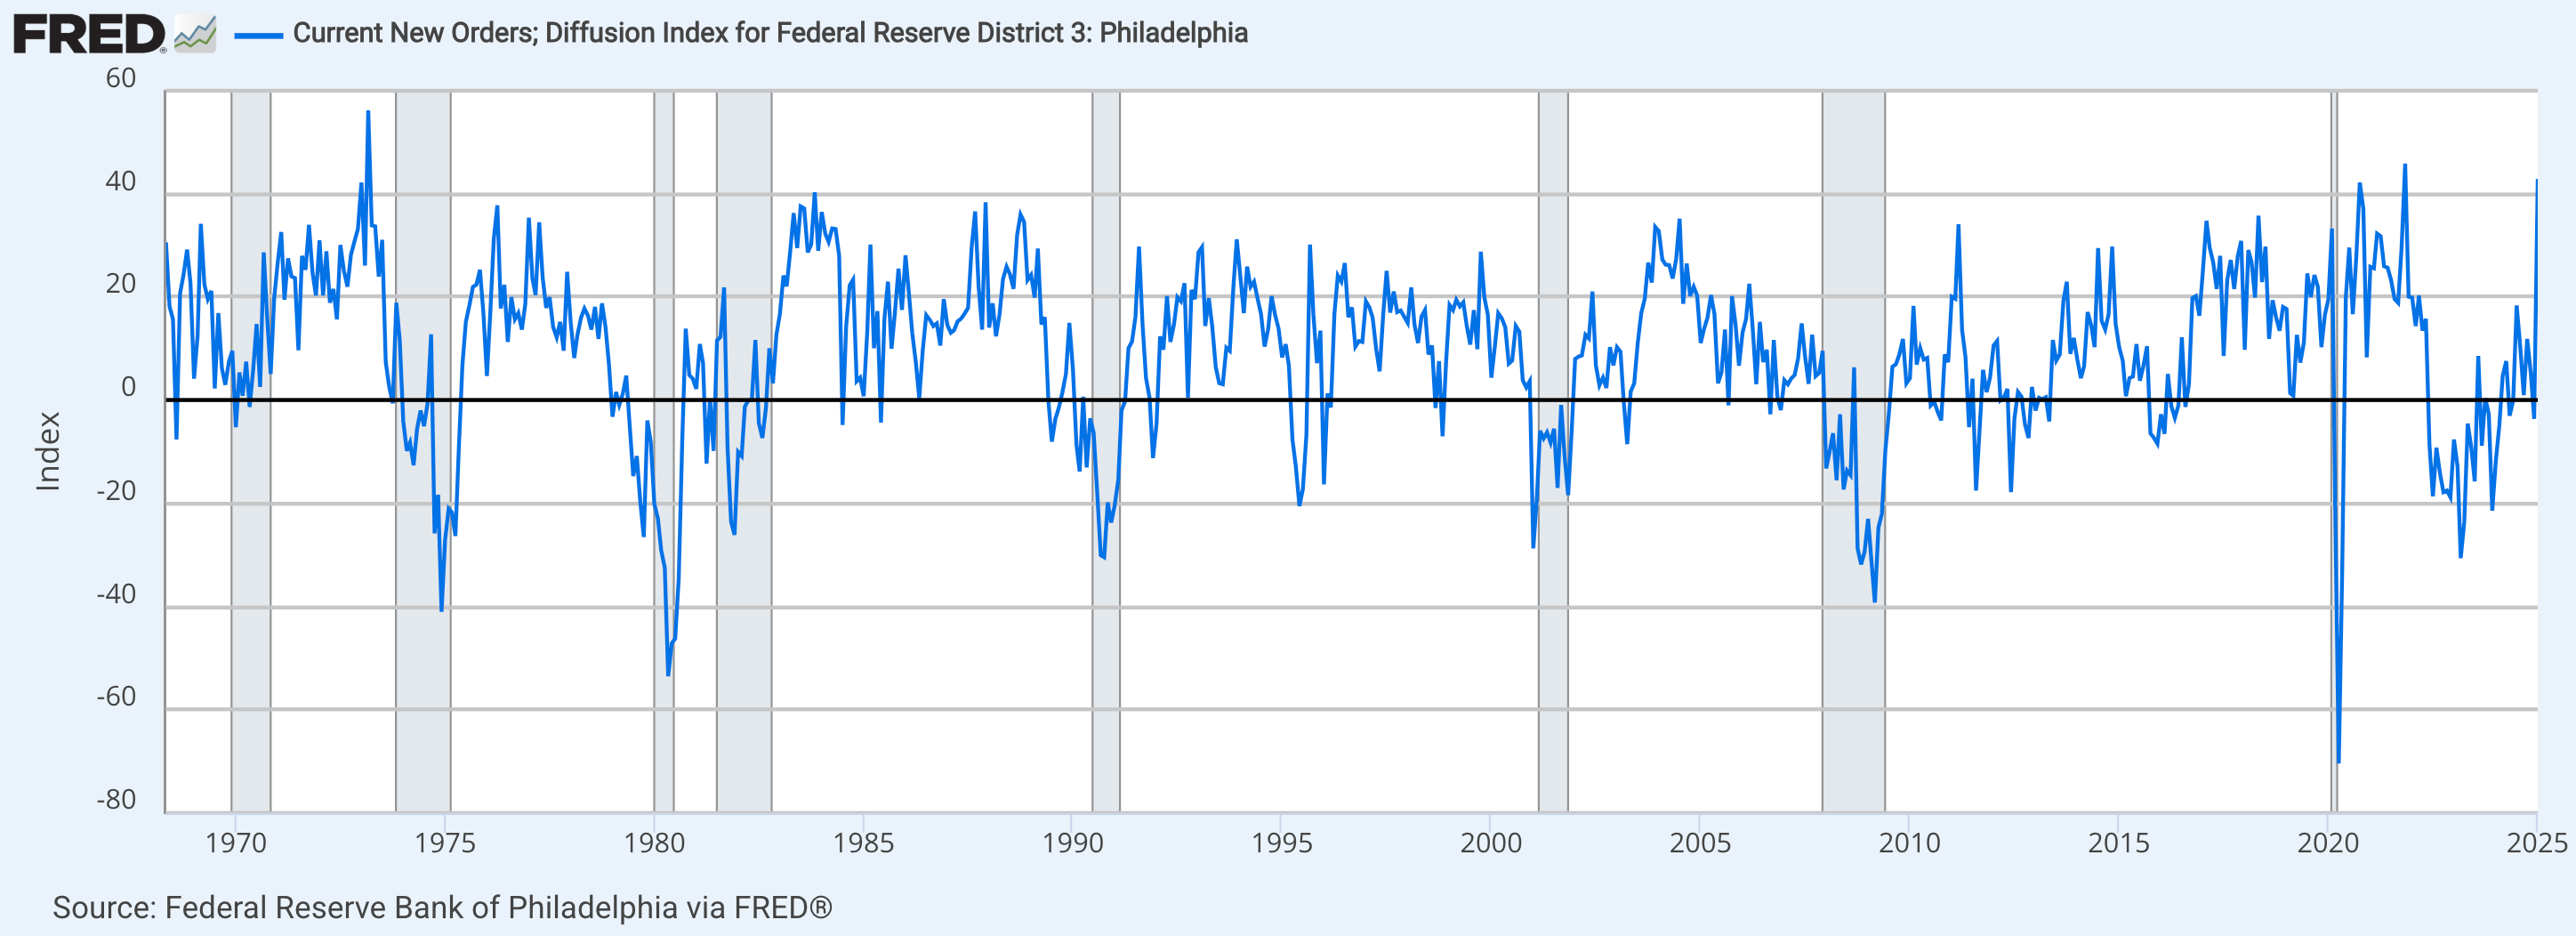
In the past, I’ve observed the steady (but choppy) increase in new orders as a sign of the continued resilient & dynamic nature of the U.S. economy, but this latest print makes that conclusion unquestionable.
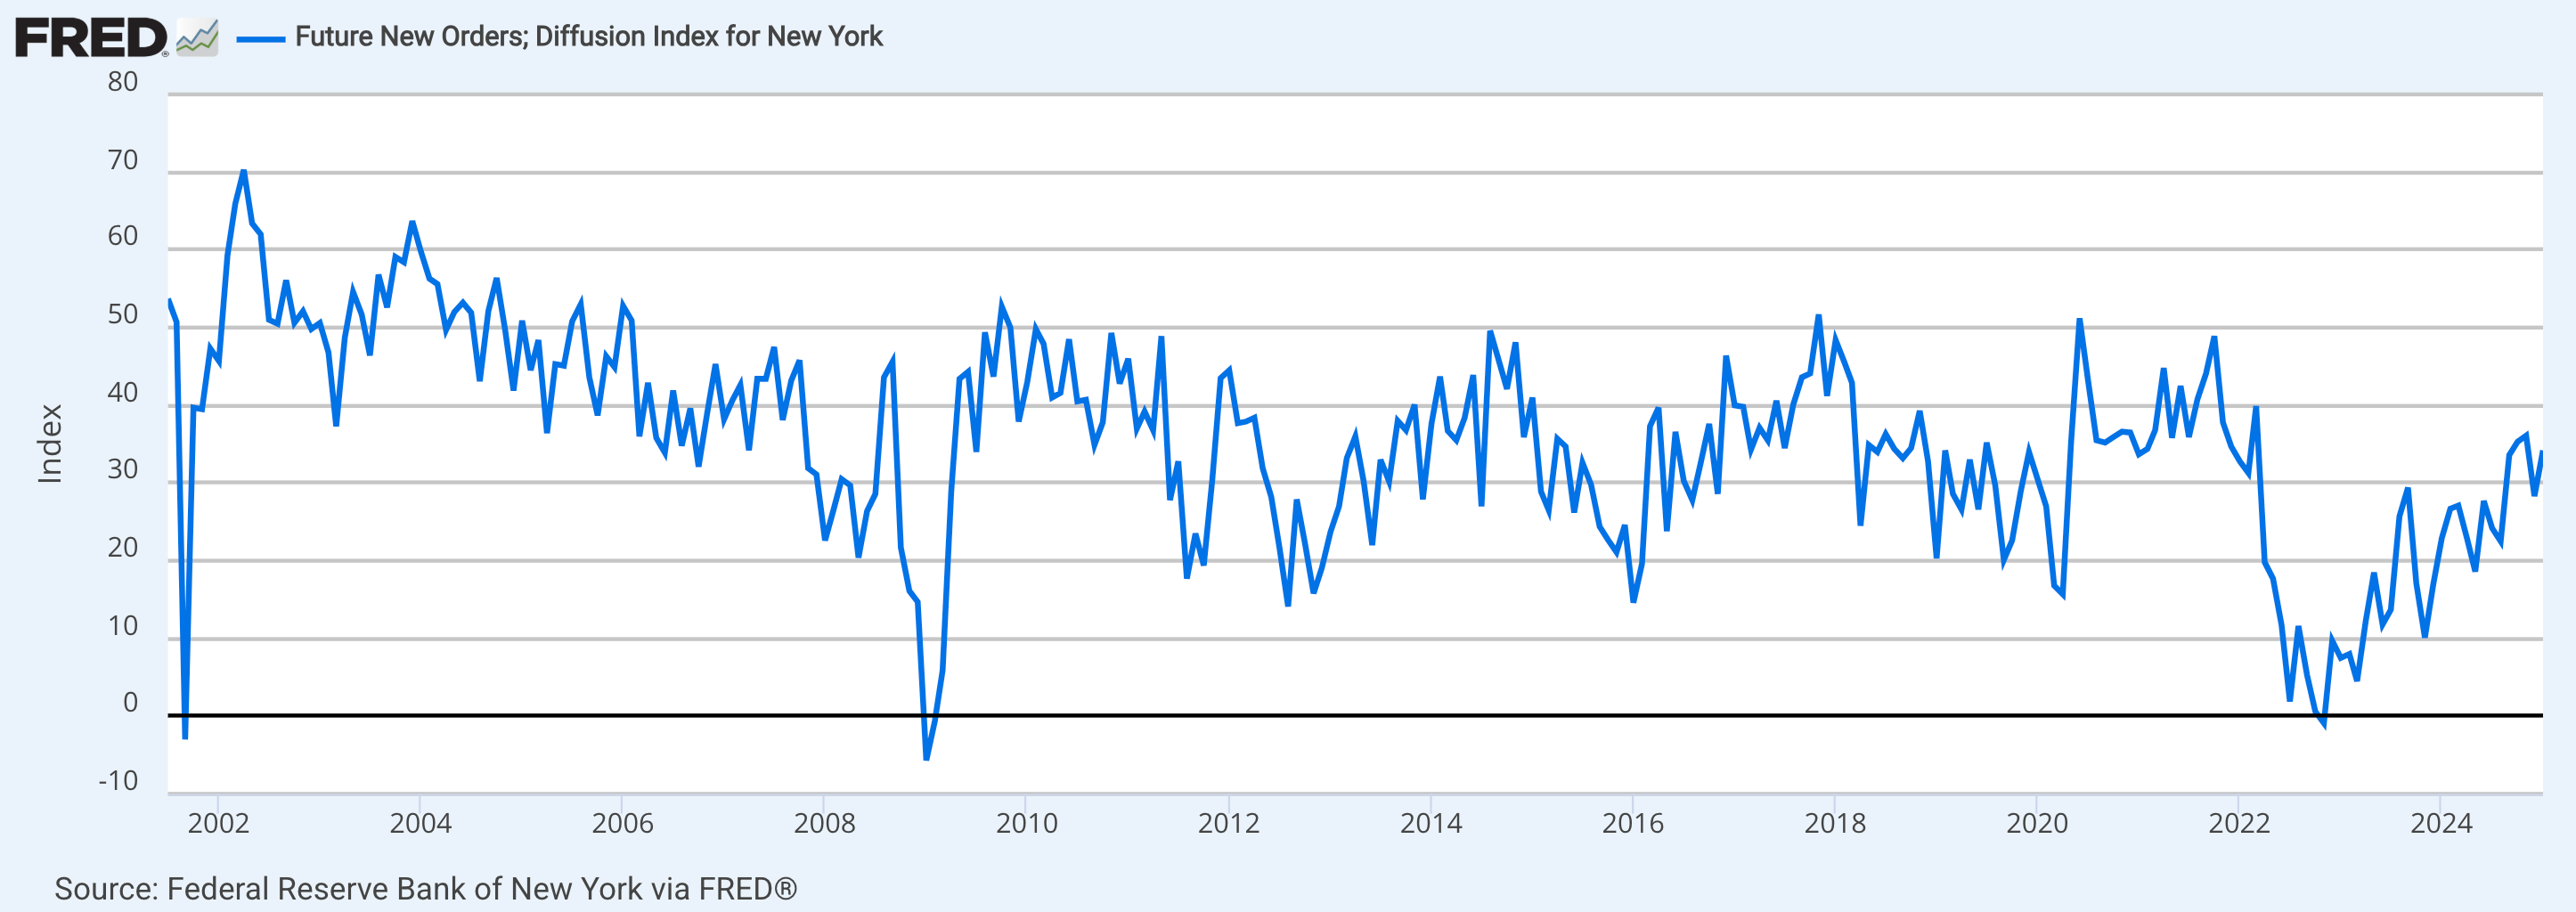
By the way, the New York index for future orders is also improving very nicely!
The fact of the matter is (and has been) that the U.S. economy is resilient & dynamic.
Is it perfect?
No.
Does it need to be perfect for asset prices to remain in a bull market?
Also no.
So if we are here to be investors, implementing macro as one input to our holistic process, then we must recognize and accept that the resilient & dynamic nature of the economy is sufficient to support the ongoing uptrend in asset prices.
End of story.
That’s been my message for nearly 2 years now, and the results speak for themself.
If we want to be academics or pursue a PhD in economics, then we can dive into the niche data and debate the intricacies of inequality, dispersion, and other dynamics.
But that’s not why I’m here and I’m guessing it’s probably not why you’re here either.
So when we hear pessimists, bears and Doomers cite one niche datapoint after another in order to cast doubt onto the strength of the market or the resilience of the economy, it’s vital that we remain focused on the weight of the evidence and base our conclusions on the weight of the evidence.
Otherwise, we’ll jump at shadows and allow “cracks in the labor market” or “weak new orders” keep us out of the market. How have those arguments worked in terms of producing actual results and returns?
Hint: terribly.
In the past 6 months alone, the S&P 500 is up +16% and Bitcoin is up +74%.
In the past year, the S&P 500 is up +22% and Bitcoin is up +116%.
Speculative growth themes like the Ark Next Generation Internet ETF ($ARKW) are up +70% over the past year, indicating how investors who took more risk generated more returns.
That doesn’t happen when times are bad or while the economy is collapsing.
Speculation occurs while things are improving and accelerating, or generally when investors are feeling more optimistic about the future than the present.
I’m starting with this important message as the intro because it’s so vital for both new and veteran investors to recognize these basic truths. The investors who have fought the trend in asset prices for the past 26 months have struggled mightily. Of course, the current uptrend can change, deteriorate, or shift at any point and for any reason, but it’s our responsibility as investors to do the following:
Recognize the trend
Align with the trend
Maximize opportunity
Reduce and manage risk
In doing so, we’ll ensure that we give ourselves the best chance at success in the markets, while recognizing that we are still exposing ourselves to risk and the threat of being wrong.
Being wrong is part of the game, the same way that it’s part of the game for Steph Curry to miss a three-point shot or for Patrick Mahomes to throw an interception.
As investors (not academics), we must be willing to take risk & pay the price if wrong.
This Saturday edition of Cubic Analytics is 100% free, so you’re welcome to share it with your colleagues or anyone who might be interested in my objective research to macro, the stock market, and Bitcoin.
Let’s begin.
Macroeconomics:
This week was full of new labor market data, but I want to keep my commentary on this relatively short because the data simply confirms what we’ve already known:
The labor market is (and will likely continue to be) resilient and dynamic.
It’s not rocket science folks, I’ve been saying this exact phrase 2+ years.
The non-government data from the world’s largest payroll company, ADP, indicated that the U.S. economy added 183,000 jobs in January 2025, which smashed the forecast of +150k and prior results of +176k.
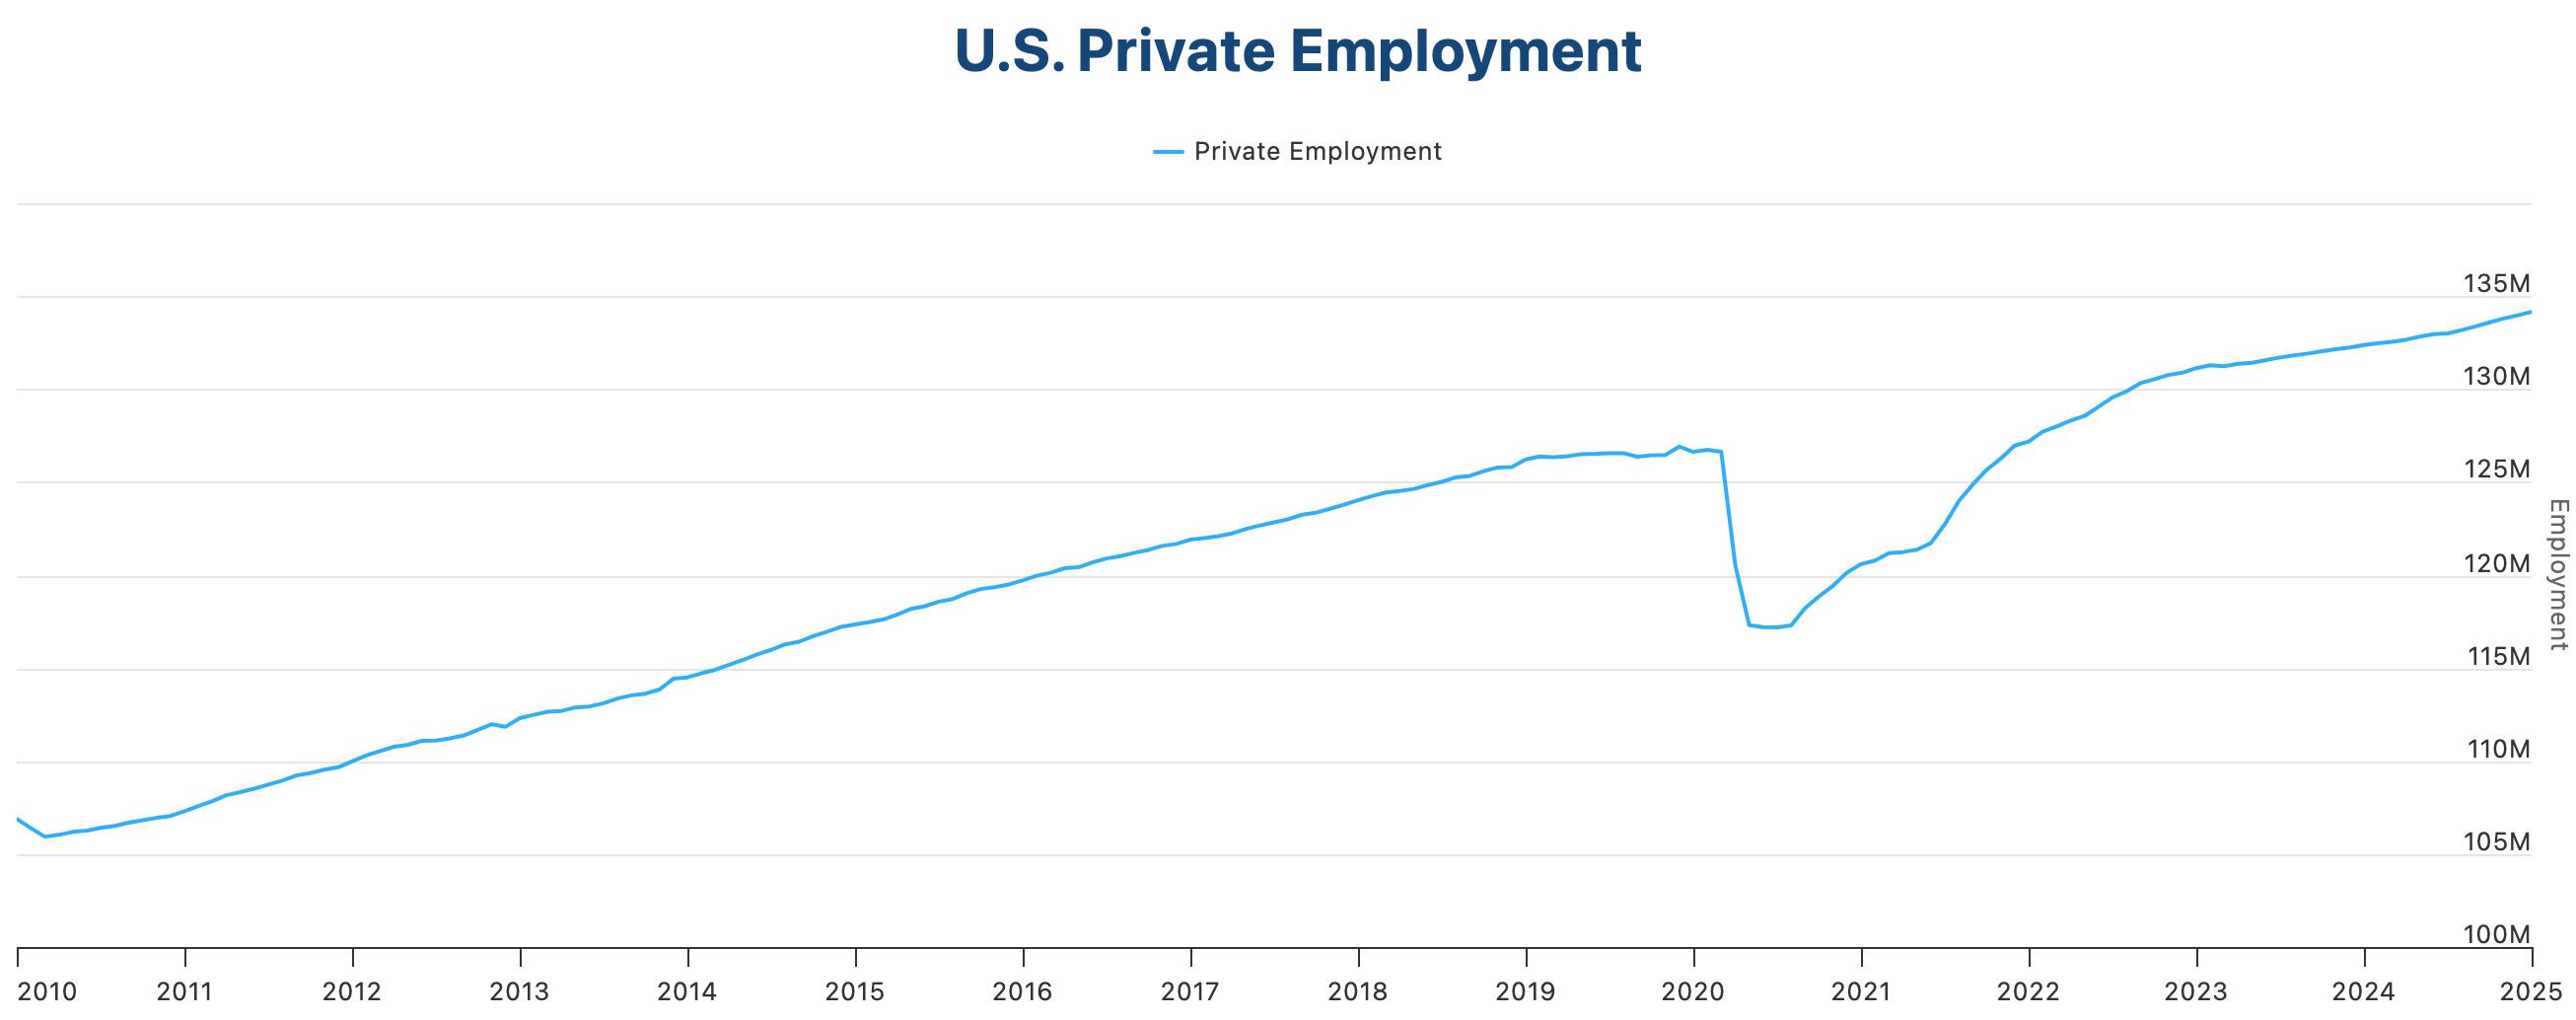
In total, U.S. private employment now stands at 134,157,000 jobs!
Mind you, this data is not controlled or reported by the U.S. government, so we can dispel the conspiracy about how either the Biden/Harris or Trump administration is trying to look good or get re-elected.
Additionally, the ADP data only reports on the private sector, meaning that it excludes government jobs & payrolls. This is an important distinction given that bears & Doomers have continuously claimed that all of the job creation has come solely from government jobs, which I’ve repeatedly debunked.
ADP also reported on wage growth, coming in at +4.7% YoY.
With inflation running at a pace of +2.9%, this would indicate a rough estimate of positive real wage growth of +1.8% YoY. While this isn’t a great number, it’s still positive and indicates that consumers are experiencing steady economic gains.
As we turn our attention to the nonfarm payrolls data from the Bureau of Labor Statistics, the ADP data helps to juxtapose and/or validate the official government data.
According to the BLS, 143k jobs were added in the month of January 2025.
While this figure came in below prior results of +256k and estimates of +169k, I was pleased to see three key dynamics within the NFP data:
Positive revisions: November and December 2024 were both revised higher by a combined amount of +100k jobs. Specifically, November was increased from the initially-reported amount of +212k to +261k and December was increased from +256k to +307k. This means that the U.S. economy has added an average of 237,000 jobs per month for the past three months! That doesn’t sound recessionary to me.
The unemployment rate: The unemployment rate has essentially flatlined for the past eight months, with the latest result coming in at 4.0% (down vs. prior 4.1%). The latest unemployment rate data is now at the same level as it was in May 2024. While everyone was running around like a chicken with its head cut off in mid-2024 about the Sahm Rule being triggered and that the unemployment rate would only accelerate further, I continued to reiterate the resilient & dynamic nature of the labor market. In the past six NFP reports, the unemployment rate has fallen three times, remained flat twice, and only increased once. That doesn’t sound recessionary to me.
Wage growth: According to the latest BLS data, nominal hourly earnings increased by +4.1%, representing a modest acceleration vs. the prior +4.0% result. While this pace lags the growth from the ADP data, it still marks a solid growth rate that is outpacing inflation. That doesn’t sound recessionary to me.
As a final note on labor market data, I also saw this data about construction jobs:

The fact of the matter is that construction jobs have decreased during every single recession since the 1970’s, which means that the ongoing increase and steady uptrend is the exact opposite of what we normally see during recessions. Of course, someone will retort that every peak in construction jobs has occurred after a steady uptrend in construction jobs; however, I’d simply respond that the economy tends to trend.
Historically, we’ve seen construction jobs steadily climb higher for years and years before they inevitably decline at the precipice of a recession.
The point is, we’re not showing any signs of slowing down right now.
That could change 1-3 months in the future, or maybe it won’t.
We don’t know.
That’s why it’s important to continue monitoring the data.
Regardless, as we look at the weight of the evidence in the labor market, it’s clear that the U.S. economy is resilient & dynamic, far from mirroring the conditions that are typical during recessions.
Stock Market:
Let’s put one final ribbon on labor market conditions, looking at the amount of times that S&P 500 companies have mentioned “layoffs” on their earnings calls.
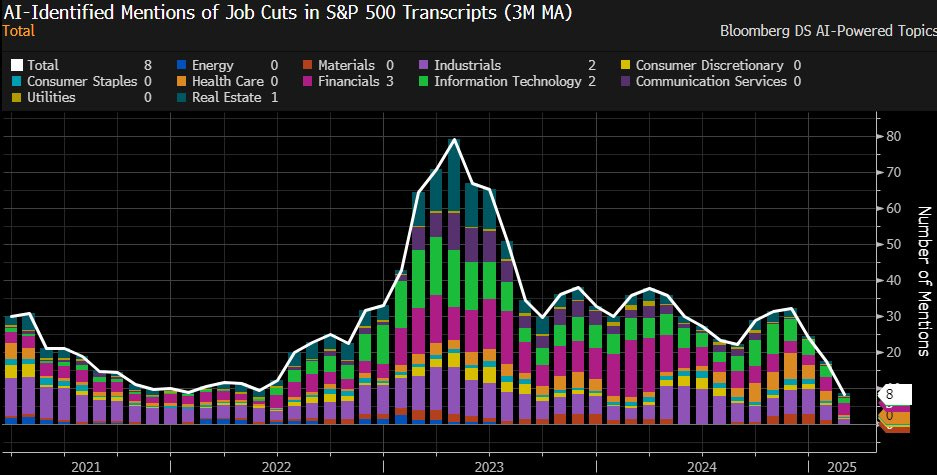
Once again, that doesn’t look recessionary to me.
But hey, I get it…
Many bears aren’t saying that we’re in a recession right now.
Instead, just like they were saying in 2021, 2022, 2023, and 2024, they’re warning that we’re on the precipice of a major recession, claiming that a variety of risks are going to tank the market.
As I’ve said dozens of times, risk is always present in the market.
In fact, you can’t show me a single time in the history of financial markets where risk wasn’t present.
Generally speaking, the market is able to see past these risks.

This is why I love the phrase, “bull markets climb a wall of worry”.
It’s important to recognize that many risks don’t actually materialize, and even if they do, they’re often far less severe than we might’ve suspected. I’m not saying to ignore or to dismiss risks, but history shows us that investors are often rewarded for staying focused on big picture fundamentals and staying optimistic.
So when we look at the current conditions of the stock market, how should we interpret the latest round of headline risks?
Quite simply, the fears around tariffs & trade wars, government spending cuts, deportations, “cracks in the labor market”, insufficient growth, valuations, weak breadth, the consumer’s dependency on credit, or any other headline risk that you’ve seen aren’t having a material impact on the market.
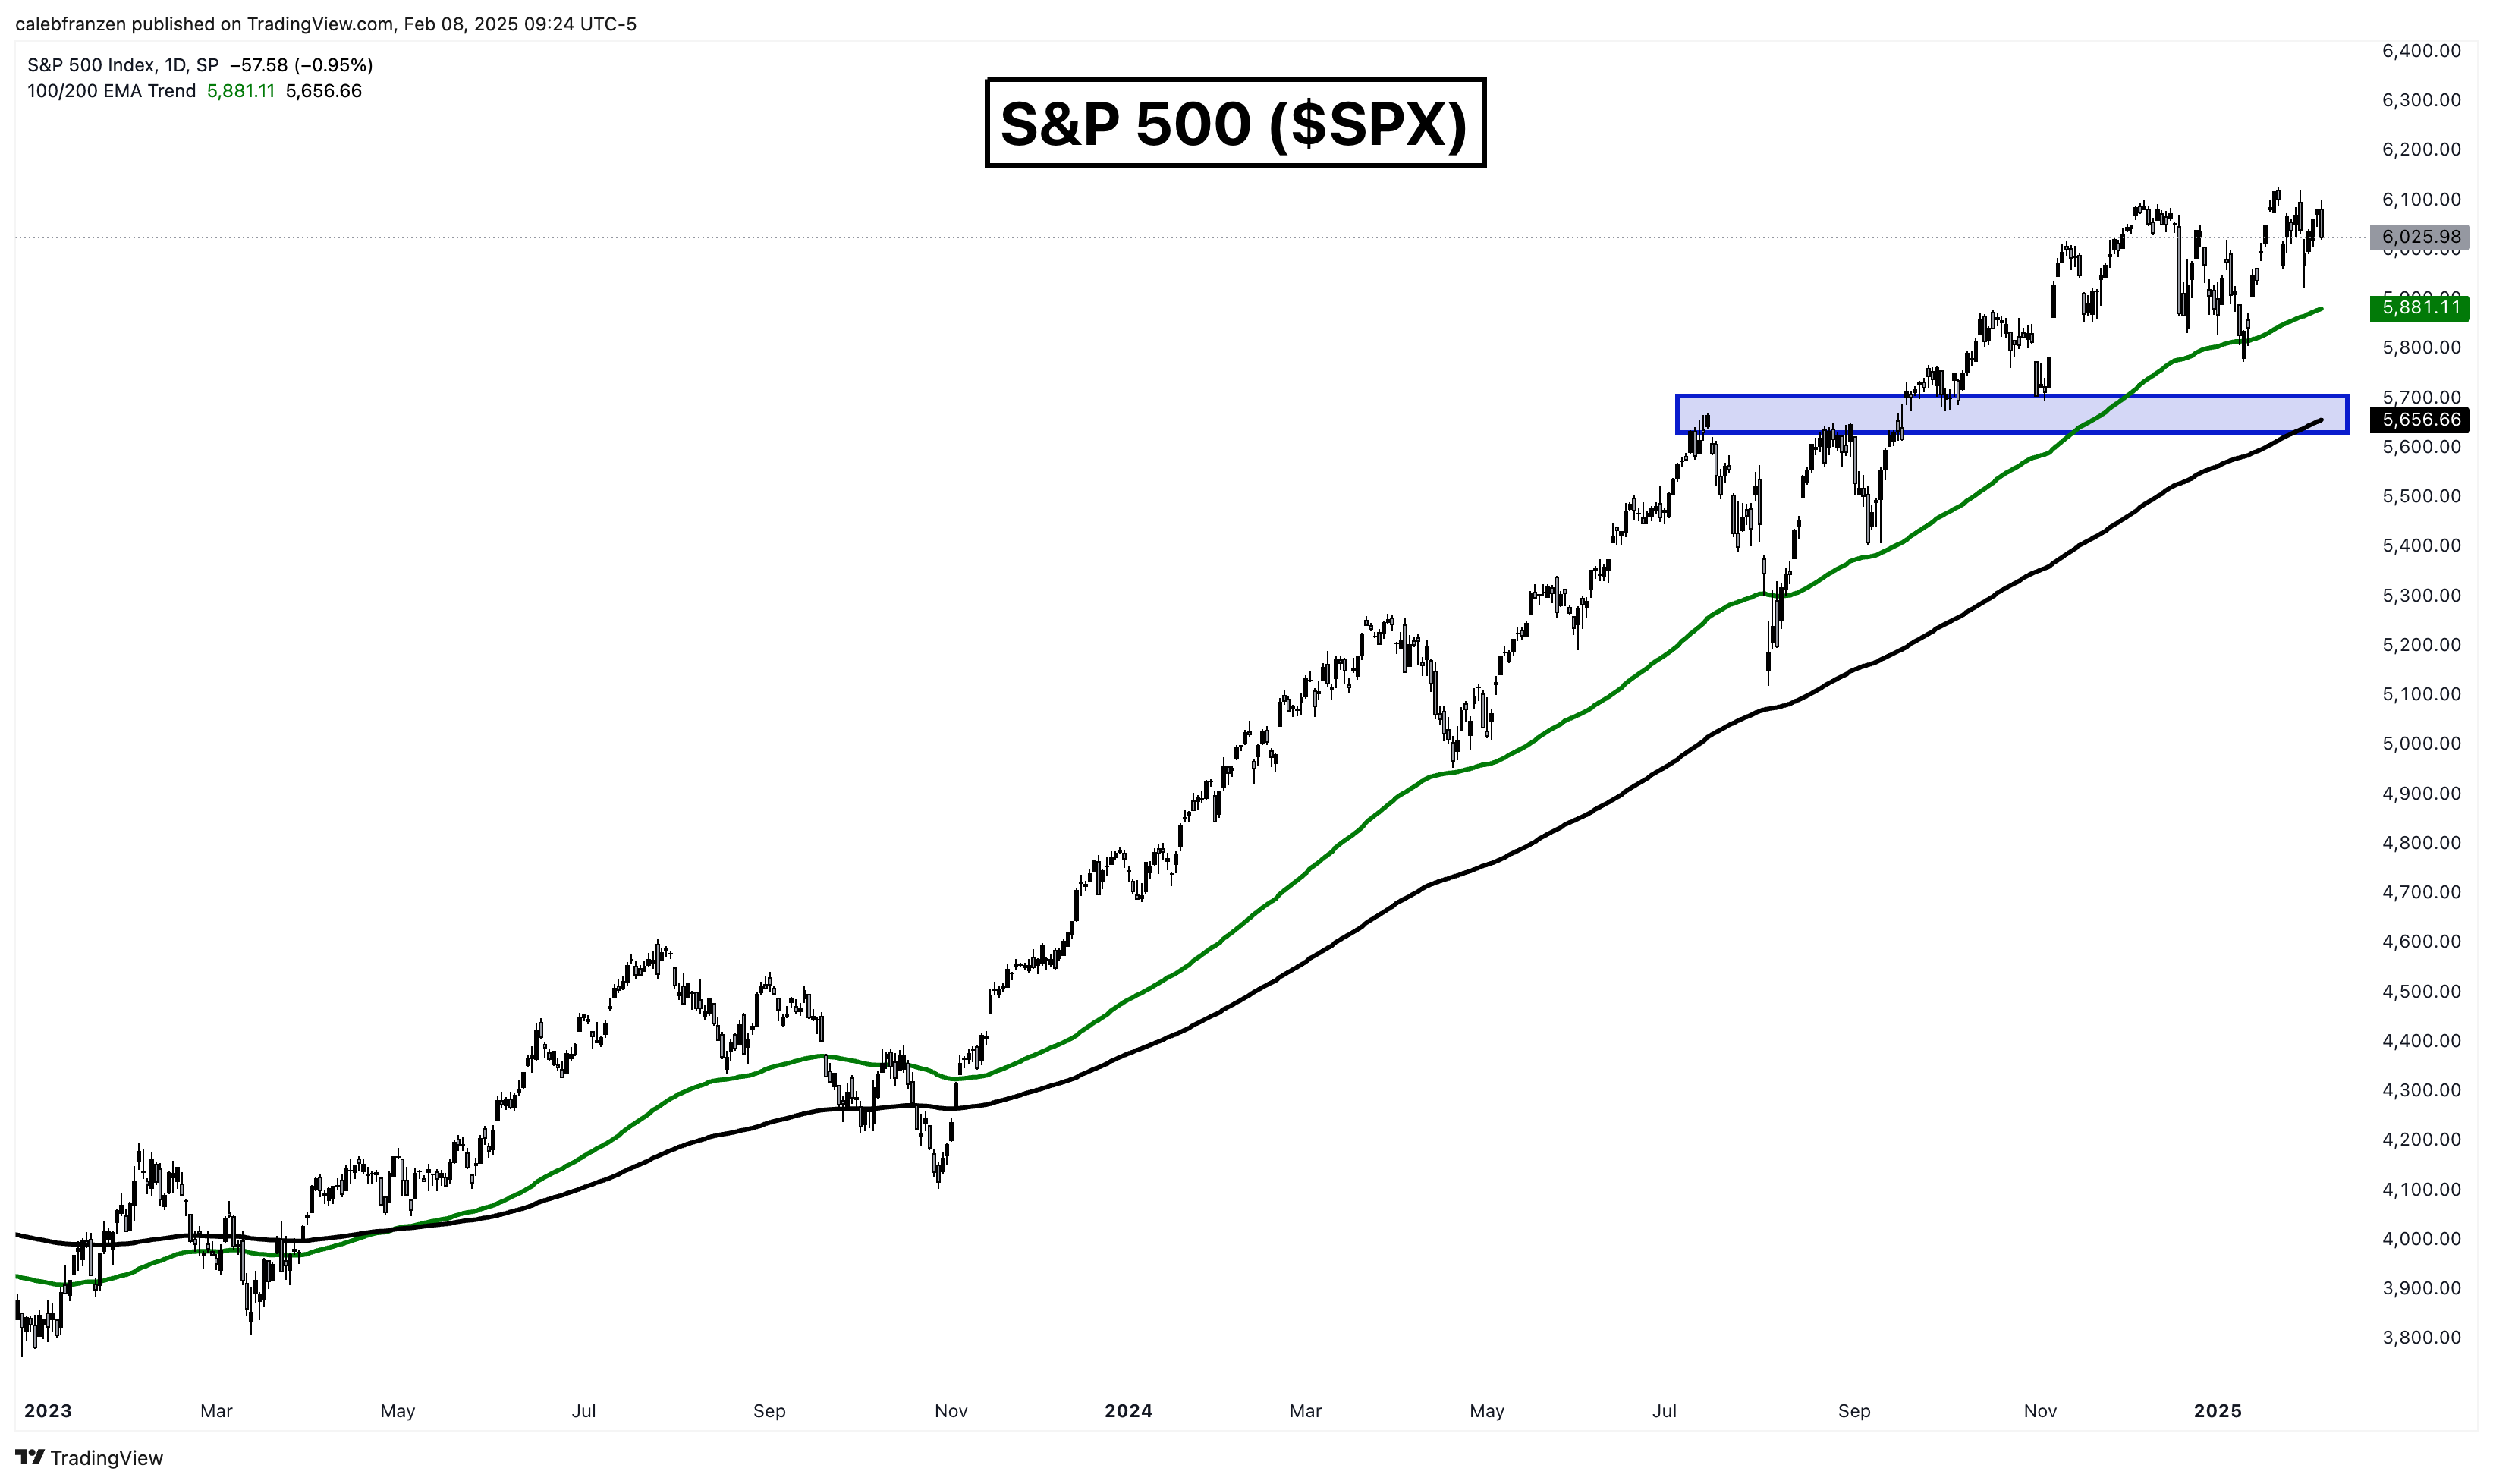
The fact of the matter is that the market is digesting all of these risks in stride, hence why the index is trading just +1.68% away from new all-time highs, even after Friday’s -0.95% decline.
In fact, stocks have ripped off their mid-January lows not even 4 weeks ago.
Since Monday, January 13th, these are the returns for various indices & ETFs:
Dow Jones Industrial Average ($DJI): +5.86%
S&P 500 ($SPX): +4.39%
Nasdaq-100 ($NDX): +4.6%
Russell 2000 ($RUT): +5.58%
NYSE FANG+ Index ($NYFANG): +6.72%
Equal-weight S&P 500 ($RSP): +4.51%
Equal-weight discretionary ($RSPD): +4.55%
Industrials ($XLI): +5.25%
Financials ($XLF): +10.13%
Cybersecurity ($CIBR): +10.63%
Water resources ($PHO): +4.85%
Value ($VTV): +5.27%
Growth ($VUG): +4.62%
High beta ($SPHB): +4.70%
Low volatility ($SPLV): +5.41%
Ark Innovation ETF ($ARKK): +13.51%
The market has ebbs and flows.
Only two of the ETFs mentioned above (XLF and CIBR) have made new all-time highs, so it’s important to highlight that despite the latest resurgence in asset prices, they still haven’t even recovered the losses from December and early January.
Most stocks are just going sideways.
And that’s perfectly fine!
Bull markets don’t mean “up only”.
Bitcoin:
As BTC trends sideways, mirroring the dynamics in the equity market, one of the key charts that I remain focused on is the short-term holder realized price (STHRP). For those who are unaware of this on-chain datapoint, it’s the only one that I focus on for a reason…
It tracks the rolling 155-day cost basis of all BTC that have been transacted, providing a real-time measurement of the market recent cost basis.
Typically, when price is above STHRP, we’re in a bull market & good things happen.
Conversely, when price is below STHRP, we’re in a bear market & bad things happen.
Yes, it’s really that simple.
Staying dynamic and flexible based on where price is relative to the STHRP is a great way to ensure that you’re staying on the right side of the trend or getting in/out at a potential inflection point.
So where’s the STHRP right now?

Roughly $91,000.
I’ve been very patient in recent weeks, recognizing that both bulls and bears are overreacting to small moves in either direction.
At this point, with Bitcoin currently trading at $96,100 at the time of writing, my plan is to wait for one of two conditions to buy more Bitcoin:
Bitcoin falls & retests the STHRP, currently at ~$91k.
Bitcoin rises and breaks above the 21-day EMA, currently at ~$102k.
Until either of these conditions are met, I’m not going to add to my current Bitcoin stack, which is the largest individual holding across my entire portfolio, comprising roughly 70% of my total net worth.
Best,
Caleb Franzen,
Founder of Cubic Analytics
This was a free edition of Cubic Analytics, a publication that I write independently and send out to 12,400+ investors every Saturday. Feel free to share this post!
To support my work as an independent analyst and access even more exclusive & in-depth research on the markets, consider upgrading to a premium membership with either a monthly or annual plan using the link below:
DISCLAIMER:
This report expresses the views of the author as of the date it was published, and are subject to change without notice. The author believes that the information, data, and charts contained within this report are accurate, but cannot guarantee the accuracy of such information.
The investment thesis, security analysis, risk appetite, and time frames expressed above are strictly those of the author and are not intended to be interpreted as financial advice. As such, market views covered in this publication are not to be considered investment advice and should be regarded as information only. The mention, discussion, and/or analysis of individual securities is not a solicitation or recommendation to buy, sell, or hold said security.
Each investor is responsible to conduct their own due diligence and to understand the risks associated with any information that is reviewed. The information contained herein does not constitute and shouldn’t be construed as a solicitation of advisory services. Consult a registered financial advisor and/or certified financial planner before making any investment decisions.
Each investor is responsible to understand the investment risks of the market & individual securities, which is subjective and will also vary in terms of magnitude and duration.