Momentum Will Push Stocks Higher
Investors,
The S&P 500 made new YTD highs on Friday, while also achieving the highest daily & weekly close of 2023. The index is now up +21.6% YTD (including dividends), easily outperforming the average calendar year return of +10.13% from 1957 to 2022. On top of that, the Dow Jones, Nasdaq-100, and the Wilshire 5000 are also outperforming their average calendar year returns!
But let’s stay focused on the S&P 500…
Back in August, I acknowledged how the index was retesting an important structural level, dating back to February 2022. At the time, I thought it would achieve a breakout, but we got rejected and the market consolidated for a few months; however, we’re right back at that same level today!
I’ve also added the 250-day Williams%R indicator in the lower-bound, providing a unique insight into market momentum and bullish behavior.
You might be asking, “but Caleb, why 250 days?” The answer is simply that there are 250 trading days in the calendar year of 2023, so this gives us an actual estimate of the 1-year price action in the traditional market.
The S&P 500 is currently trading above the upper-bound of the oscillator, suggesting that the index is “overbought”. For me and my investing/trading approach, an overbought readings is one of the most bullish signals I can see, because it implies that there’s been a significant amount of buying pressure in the individual asset relative to its historical data.
The last time the S&P 500 had crossed above the “overbought” threshold was in late April 2023, which was followed by some sideways price action and then the explosive move higher for a few months into the YTD highs. After the onset of the overbought signal on April 28, 2023, the index gained +13.8% into the YTD highs just 11 weeks later. Most recently, the index crossed the upper-bound on November 14th and has been on a slow grind higher, but with some sideways price action — not nearly as volatile as the price action after the last signal. So far, the index has gained +2.4% since the signal flashed and we’re now pushing right up against that horizontal resistance range that I mentioned at the onset of this analysis.
Based on the price action during the past overbought signal, as well as my belief that “overbought” is bullish due to the implication that buyers are stepping in with force & conviction, I think there’s an excellent chance that the S&P 500 will breakout in the coming weeks and even as soon as this upcoming week. Even if we get rejected on this range, as it did in July, that doesn’t mean that we can’t break out a few weeks later.
Market dynamics are strong and the release of the CPI report could provide the fundamental catalyst to push equity prices higher if my disinflationary thesis continues to be validated by the data.
In the remainder of this report, which is exclusive for premium members, I’ll focus on two things primarily:
My preview of the CPI. I hate to toot my own horn, but I’ve been one of the most outspoken macro analysts about disinflation. Every single month this year, I’ve told investors to “take the under” on YoY estimates for CPI and I’ve only been wrong in 1 of 10 reports. Disinflation has been one of the most predominant themes, and I’ll be updating some of my expectations for the latest data in this report. As I’ve said before, if you’ve gotten the inflationary trend correct, you’ve likely been on the right side of the market this year & enjoyed the strong returns.
Additional data & analysis for the S&P 500 to substantiate the Williams%R study from the intro above. We’ll cover market internals, momentum signals, seasonality, and some complimentary analysis in order to decipher how markets are likely to unfold in the near future.
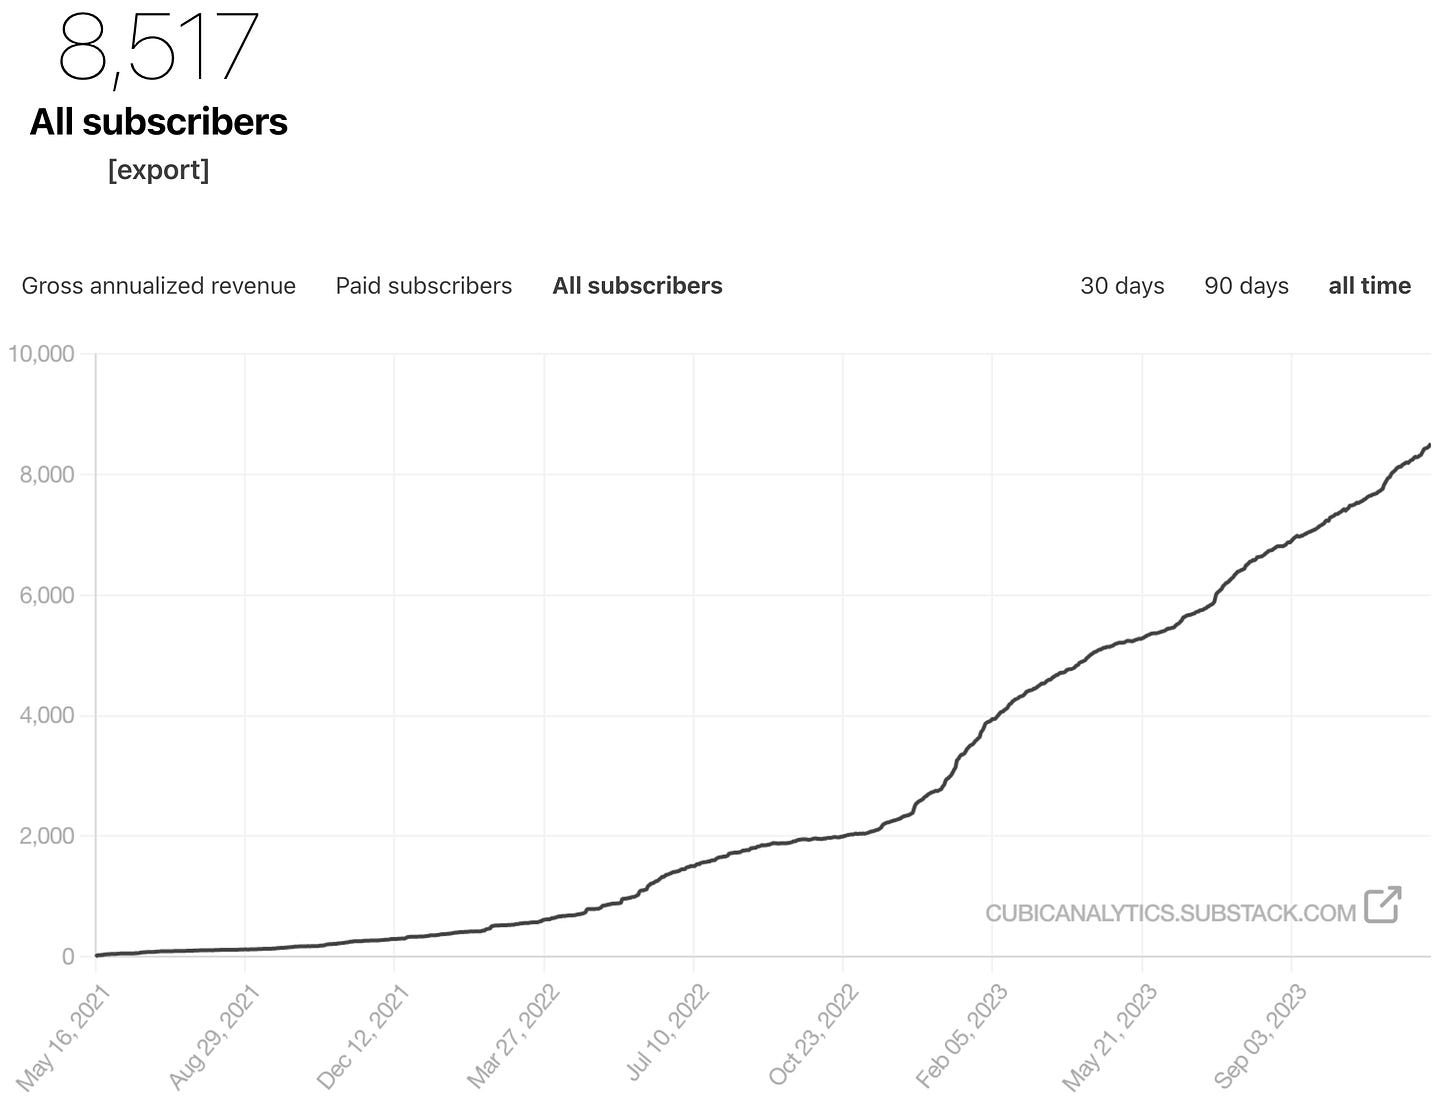
Before we dive in, I also want to celebrate the fact that there are now 8,500+ investors who are subscribed to Cubic Analytics in order to receive these reports!
As a way to express my excitement and gratitude to have you part of the team, I want to offer everyone a 15% discount to join the premium team, for either the monthly or annual plans. If you’d like to read the remainder of this report, all future weekly premium reports, and attend the weekly group calls, consider upgrading tonight!
Why should you upgrade?
This report alone has 18 charts and an abundance of individual datapoints to guide the analysis. You get four of these premium reports per month, four premium member group calls per month, the entire library of previous editions, and the upcoming edition of my stock market deep-dive series for Qualcomm.
Without further ado, let’s dive in!


