Lower We Go
Investors,
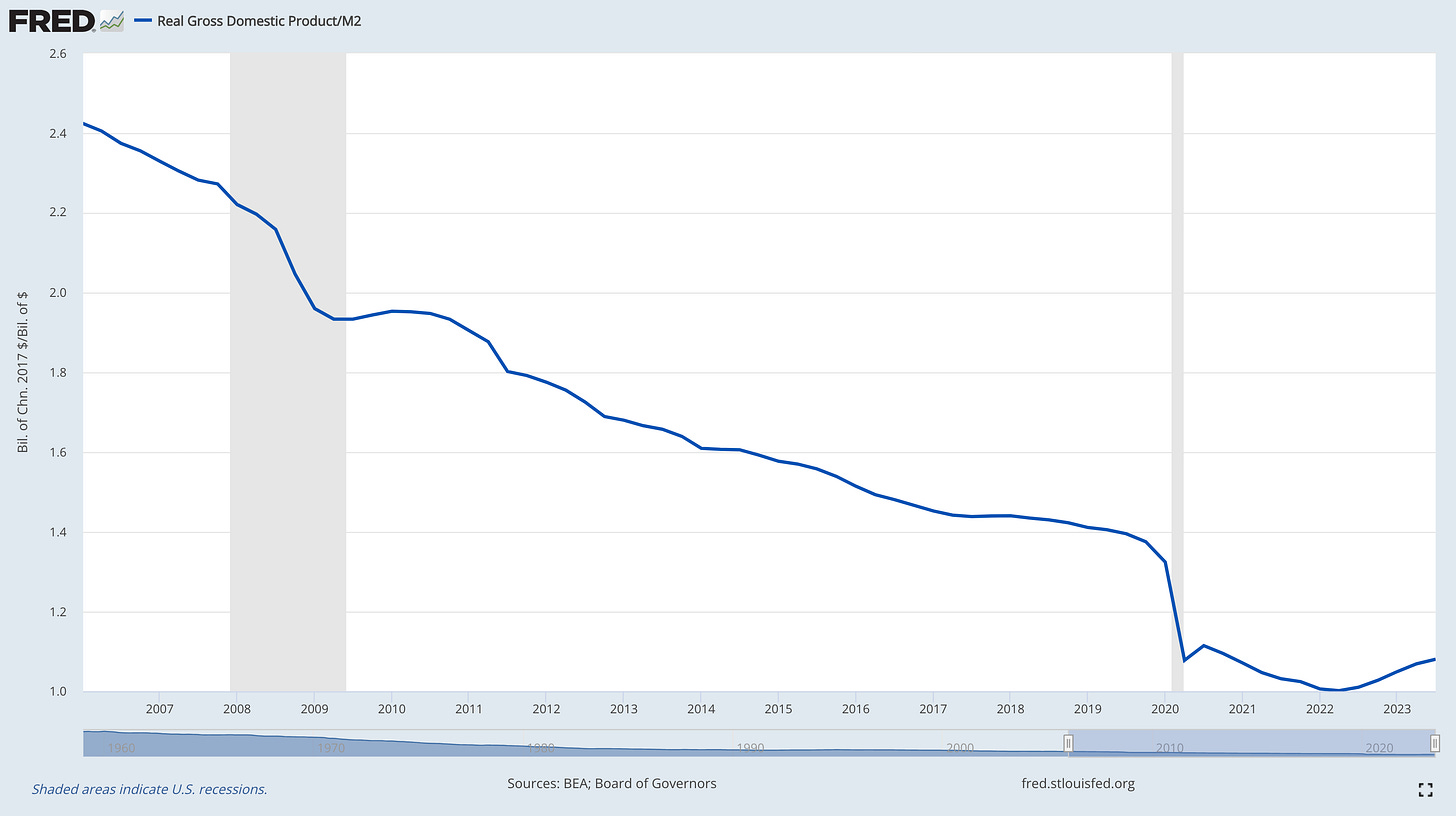
Adding to yesterday’s analysis of real GDP growth, this chart below helps to contextualize the size & trend of the U.S. economy relative to M2 money supply:
Top: Nominal GDP / M2
Bottom: Real GDP / M2
While both the nominal & real economy have been growing since COVID, one could argue that the growth is artificial due to a larger money supply! The good news is that both metrics have actually been rising again lately, though it’s unobservable for Real GDP / M2 due to the scale of the long-term downtrend.
Zooming in, we can actually observe a moderate increase for Real GDP / M2:
I thought this was another useful context for measuring GDP in Q3 2023, so I hope this is a valuable perspective to add to your understanding of economic trends.
In the remainder of this premium report, I’ll refrain from mentioning anything macro related and focus exclusively on the stock market. For the past few months, these premium reports have highlighted defensive trends within the market that some investors might interpret as being outright bearish. Considering that I was bullish on short-term market starting in April 2023, my willingness to adapt and change with market conditions has kept my trading portfolio out of harms way. Rather than trying to force my own opinion on the market, I would rather make money (or preserve my capital) instead of trying to protect my ego and continue to be bullish.
If you’re interested in reading my objective & in-depth updates on market dynamics, these weekly premium reports are just for you. Consider upgrading below.
Specifically, I’ll be covering:
Bearish market internals for the S&P 500
Price targets for the indexes with full explanations
Sector trends & implications for the market
My weekly portfolio update
Earnings season analysis with 49% of companies reporting thus far


