Investors,
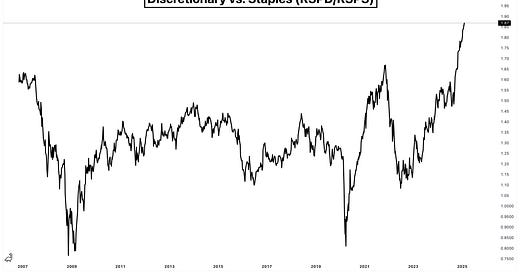
Consumer discretionary stocks just had their highest weekly close of all-time relative to consumer staples stocks on an equal-weight basis, which is a key market dynamic that you need to be aware of.
Why is it so important?
Because discretionary stocks represent “high risk” while staples stocks represent “low risk”, therefore, the outperformance of risky vs. less risky stocks indicates that risk appetite is rising.
Taking it a step further, we can assume that risk appetite tends to rise during market uptrends and falls during market downtrends, which would suggest a correlation between RSPD/RSPS and the general direction of the stock market.
But is this actually the case?
Yes!
In fact, the correlation since 2020 suggests that it’s a strong correlation:
⚫ RSPD/RSPS
🔵 S&P 500 (SPX)
Better yet, RSPD/RSPS acts as a leading indicator for the S&P 500:
In late 2019 and early 2020, RSPD/RSPS was falling while the S&P 500 was making new highs, suggesting that market internals were shifting into a “risk-off” environment while the index level was masking that weakness. In the end, RSPD/RSPS was right and the S&P 500 fell shortly thereafter.
In November 2021, RSPD/RSPS peaked and made a lower high while the S&P 500 still produced higher highs. Again, this divergence suggested weakness under-the-hood and a potential shift into a risk-off environment. As we know, the rest of the market eventually recognized what RSPD/RSPS was saying and the stock market experienced a significant pullback.
In the 2nd half of 2022, RSPD/RSPS made a higher low while the S&P 500 made a lower low. This divergence was actually a bullish indicator, signaling that risk appetite was improving despite the weak performance at the index level. This signal would’ve told investors to develop a bullish bias and begin taking more risk, which proved to be extremely profitable.
So when we look at the relationship between RSPD/RSPS and the S&P 500 today, we aren’t seeing either a bullish or bearish divergence.
Instead, we’re seeing that risk appetite is essentially confirming the uptrend in the S&P 500, telling investors to trust that the steady increase in risk appetite will help to sustain a bid at the index level.
In other words, RSPD/RSPS is telling investors to stay long and strong.
I think that’s important, don’t you?
In the remainder of this premium report, I’ll dive into a wide range of topics and different forms of analysis in order to keep a pulse on market dynamics, giving myself the best chance at success in the ongoing market environment. In total, this report contains LKASDJFLSADKFJ charts.
If you’re seeing a paywall now, you’ll be able to access this report, future premium reports, and our weekly investor calls for premium members by upgrading your membership to a monthly or annual plan.
I’ll see you on the inside.


