
It Happens Every Single Time

Investors,
In every Bitcoin bear market, price has fallen to one key level without exception.
This on-chain datapoint is a magnet for price in bear markets, while doing an excellent job of marking highly profitable accumulation levels for the inevitable new bull market.
I’m talking about the long-term holder realized price (LTHRP), which measure the cost per BTC of all Bitcoin that have been unmoved for at least 155 days. In other words, it’s the cost basis of all Bitcoin that were purchased more than 155 days ago, reflecting the conviction and accumulation behavior of committed investors.
Given how my research indicates that Bitcoin is in a bear market, wouldn’t it be informative to know exactly where the LTHRP is currently trading?
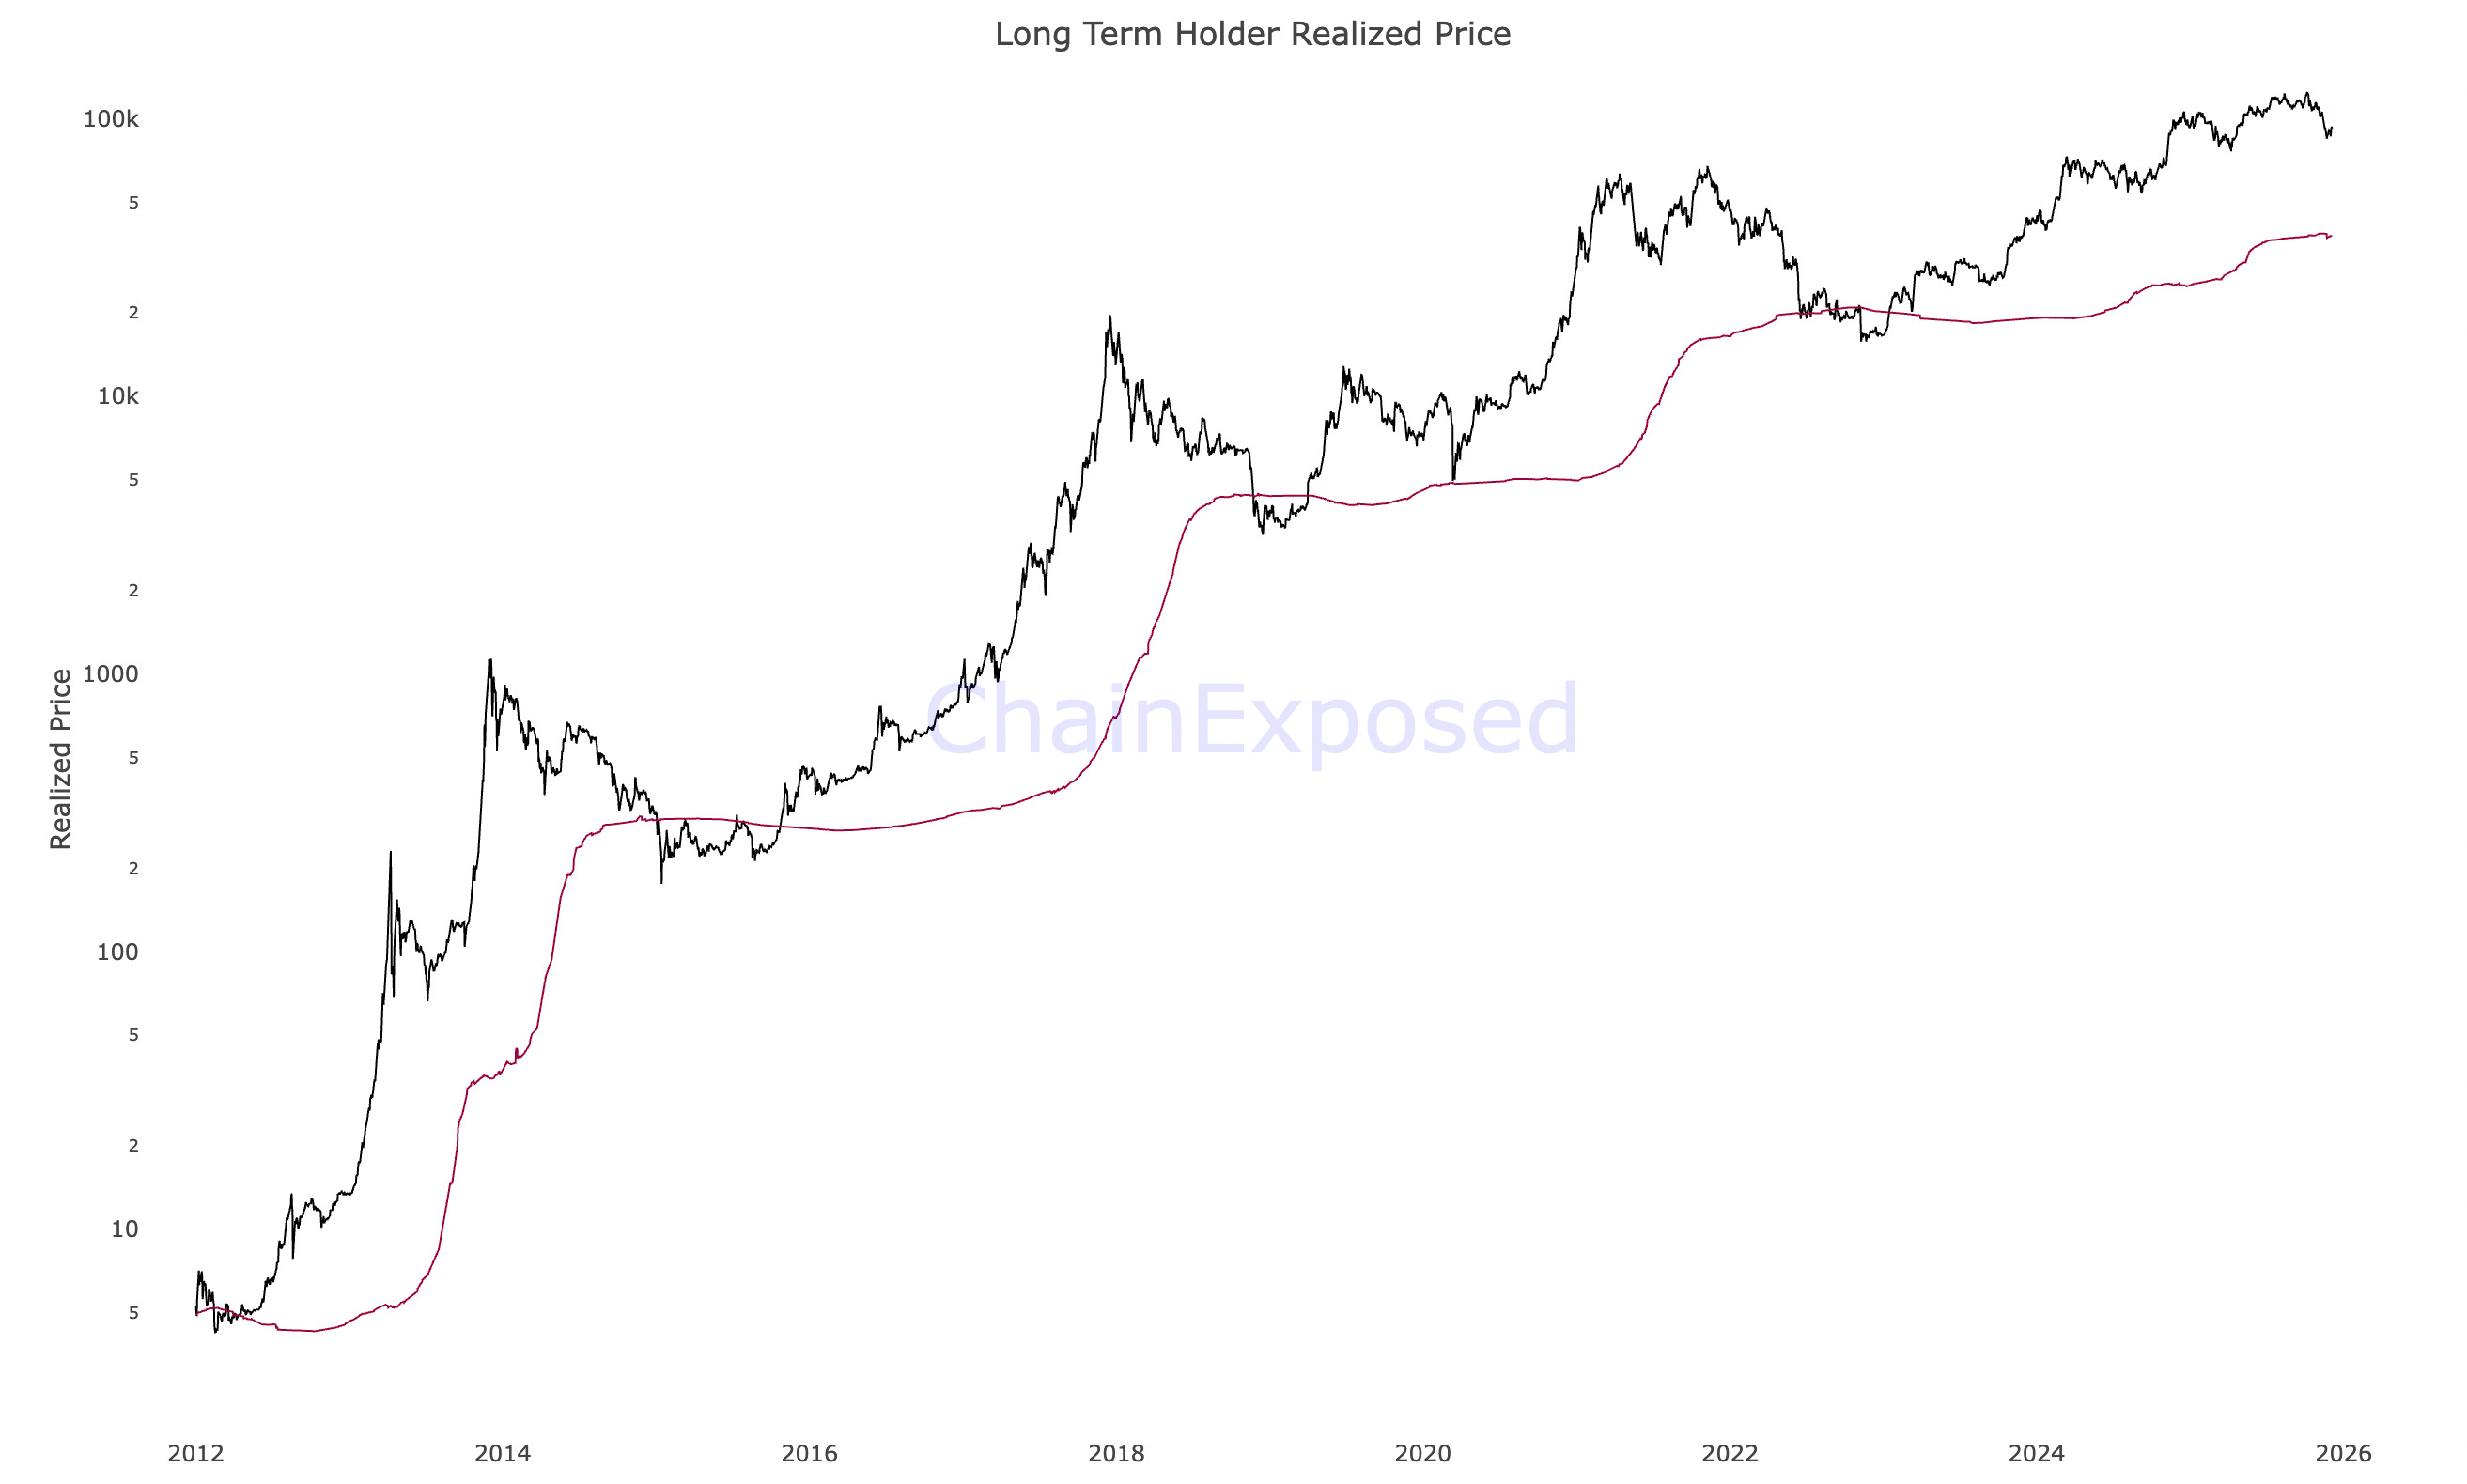
$37,900.
That’s the level we should keep in mind if bear market dynamics remain intact.
What do I mean by “if bear market dynamics remain intact”?
If Bitcoin manages to get back above its 2-day 200 moving average cloud (the bull vs. bear market line in the sand that I’ve been sharing since February 2025), then I’ll proclaim that the bear market is over and that we’re back in an uptrend/bull market.
This will require Bitcoin to reclaim $101.2k vs. the current price of $89.7k.
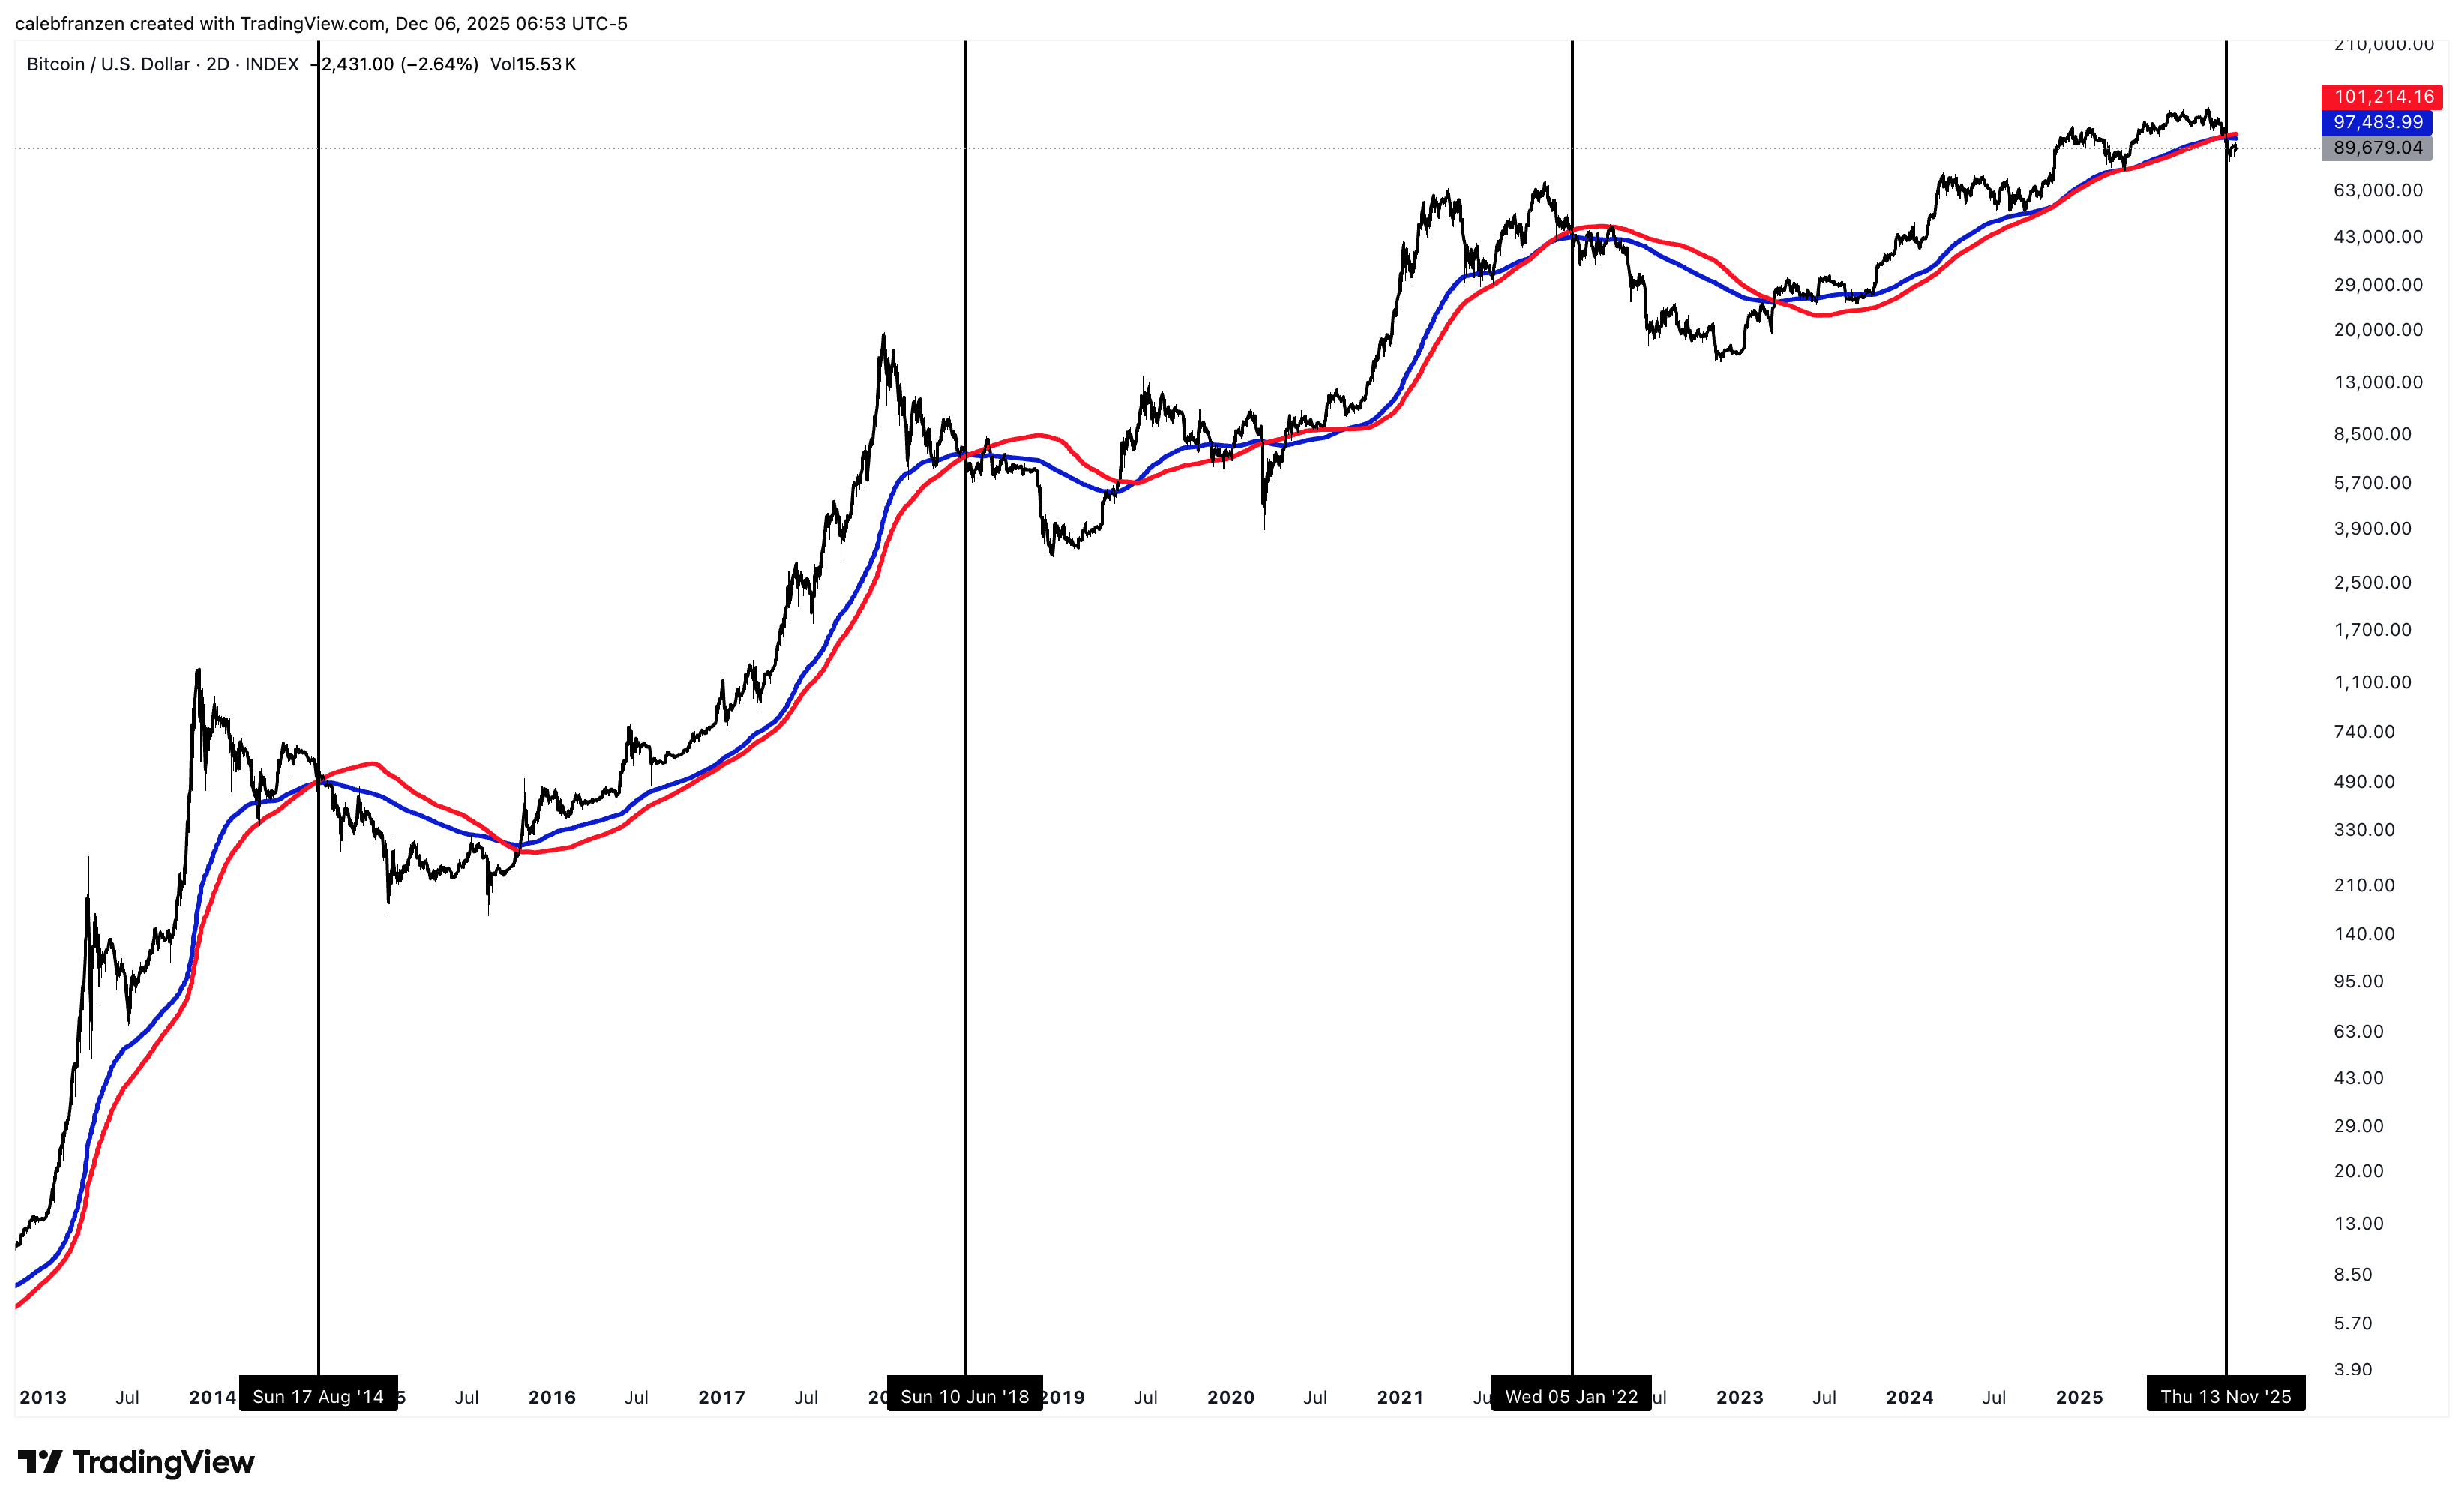
With this signal predicting an official transition from bull to bear with 100% accuracy, the fact that Bitcoin falls an average of -58.5% in 228 trading days AFTER the breakdown tells us that we should pay attention, even if we don’t like the implications.
We can ignore data, or we can try to use it to our advantage as much as possible.
I’m doing the latter.
That’s why I wrote “The Bear Market Playbook”, which took me nearly one month to write, and I’m super happy to have received such great feedback on it since I published the report a few weeks ago.

The report is intended to provide a variety of investing frameworks and mental models to improve our probability of success over the coming months/quarters, should this bear market persist.
And maybe it won’t persist…
Maybe we’ll get back above the 2-day 200 moving average cloud in the next few weeks.
But I’d rather be prepared & calculated, so that I can remain calm while others panic.
If you’re the same way, I’d encourage you to read the report.
As an FYI, I’ll publish my quarterly portfolio deep-dive tomorrow (December 7th), sharing the full breakdown of my TradFi portfolio, my holdings, the allocations, and a general discussion of my plans/strategy for 2026.
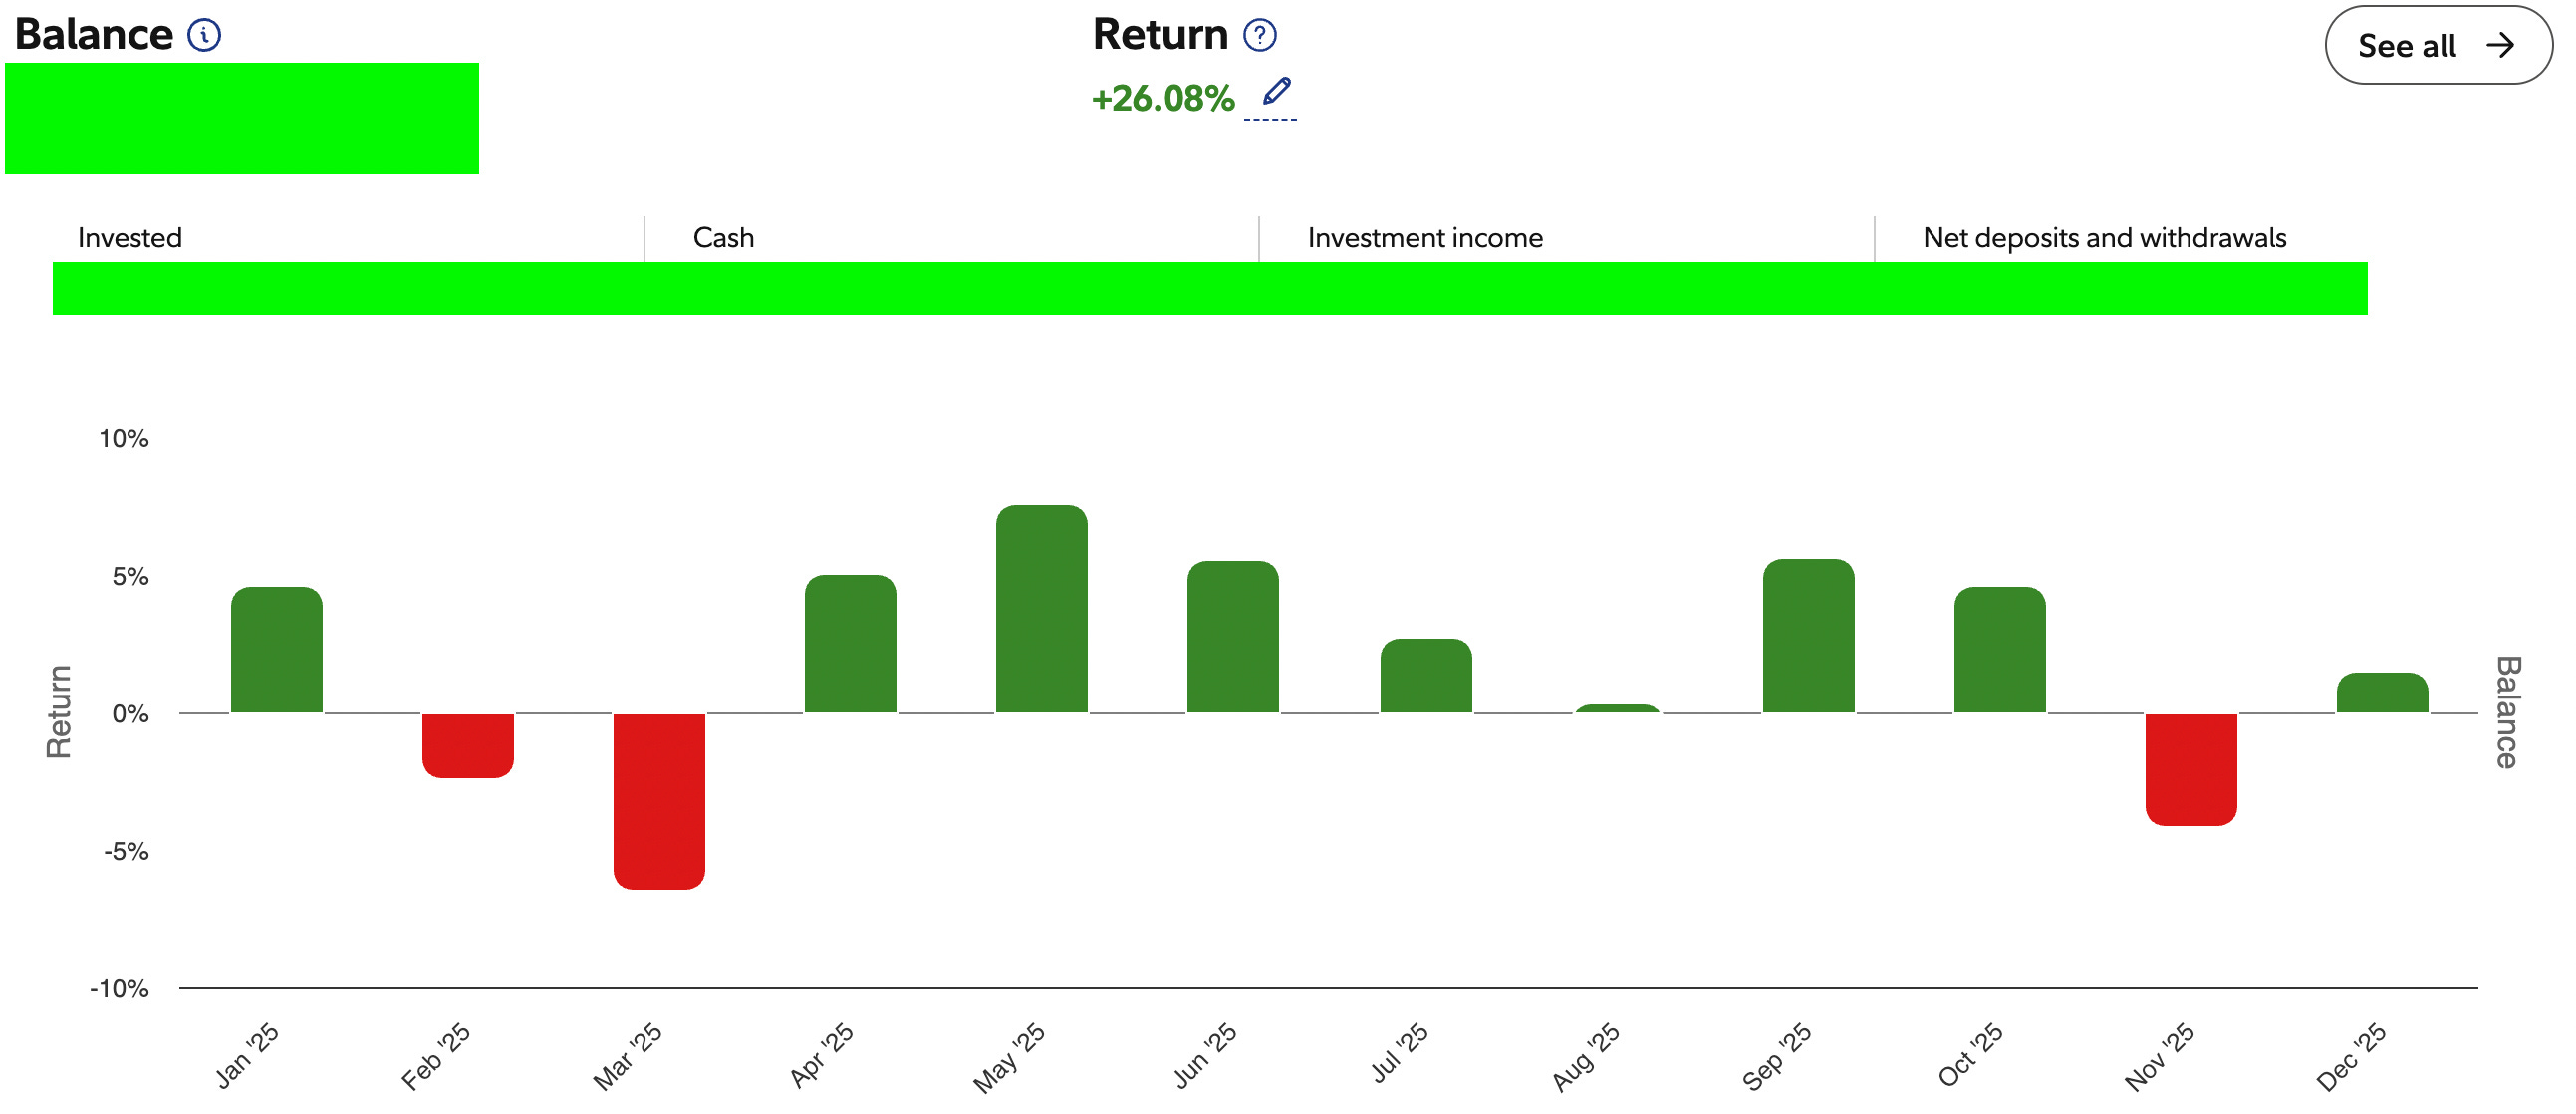
My portfolio has generated stellar results for the past several years, but has continued to build on the recent success in 2025, generating a +27% YTD return (data doesn’t include Friday’s gain of +1.02%).
With 1,150+ investors on the premium team, I’m hoping to see you join them and unlock the exclusive insights & benefits that I’m sharing with those investors.
Best,
Caleb Franzen,
Founder of Cubic Analytics
This was a free edition of Cubic Analytics, a publication that I write independently and send out to 14,500+ investors every Saturday. Feel free to share this post!
To support my work as an independent analyst and access even more exclusive & in-depth research on the markets, consider upgrading to a premium membership with either a monthly or annual plan using the link below:
There are currently 1,150+ investors who are on a premium plan, accessing the exclusive alpha and benefits that I share with them regarding the stock market, Bitcoin, and my own personal portfolio.
DISCLAIMER:
This report expresses the views of the author as of the date it was published, and are subject to change without notice. The author believes that the information, data, and charts contained within this report are accurate, but cannot guarantee the accuracy of such information.
The investment thesis, security analysis, risk appetite, and time frames expressed above are strictly those of the author and are not intended to be interpreted as financial advice. As such, market views covered in this publication are not to be considered investment advice and should be regarded as information only. The mention, discussion, and/or analysis of individual securities is not a solicitation or recommendation to buy, sell, or hold said security.
Each investor is responsible to conduct their own due diligence and to understand the risks associated with any information that is reviewed. The information contained herein does not constitute and shouldn’t be construed as a solicitation of advisory services. Consult a registered financial advisor and/or certified financial planner before making any investment decisions.
Each investor is responsible to understand the investment risks of the market & individual securities, which is subjective and will also vary in terms of magnitude and duration.
I am just glad to be a permabull.
Hey Caleb, there is one exception which may be worth looking at in further detail ... H2 2019 (the last time QT ended); we only came back to test the LTHRP due to the Covid sell-off, otherwise we would not have made it down that far. Excluding the March 2020 black swan, we would have touched the 100-week EMA (just as we have done these past 3 weeks) and then gradually climbed back up, until the full bonanza when QE restarted.
Ben Cowen is increasingly drawing comparisons with H2 2019 too, so I think there might be something to the analogy 👍🏼
(this would also confuse a LOT of people, because they think this bear market has to be the same length as every other "4-year cycle" bear market, but 2019 was essentially a mini bear market with a flash crash w/c 9 Mar 2020 that recovered back above the 100-week EMA within 4 weeks)